Abstract
Tortuosity that often occurs in carotid and other arteries has been shown to be associated with high blood pressure, atherosclerosis, and other diseases. However the mechanisms of tortuosity development are not clear. Our previous studies have suggested that arteries buckling could be a possible mechanism for the initiation of tortuous shape but artery buckling under pulsatile flow condition has not been fully studied. The objectives of this study were to determine the artery critical buckling pressure under pulsatile pressure both experimentally and theoretically, and to elucidate the relationship of critical pressures under pulsatile flow, steady flow, and static pressure. We first tested the buckling pressures of porcine carotid arteries under these loading conditions, and then proposed a nonlinear elastic artery model to examine the buckling pressures under pulsatile pressure conditions. Experimental results showed that under pulsatile pressure arteries buckled when the peak pressures were approximately equal to the critical buckling pressures under static pressure. This was also confirmed by model simulations at low pulse frequencies. Our results provide an effective tool to predict artery buckling pressure under pulsatile pressure.
Keywords: artery buckling, tortuosity, pulsatile flow, critical pressure, pulse pressure
1. Introduction
The stability of arteries under lumen blood pressure is essential to maintain their physiological function. Arteries remain stable under normal conditions while subjected to significant blood pressure and axial tension. However, they may lose stability when the lumen pressure or axial tension is changed due to aging or vascular diseases (Han et al. 1998; Jackson et al. 2005; Han 2009). On the other hand, clinical studies have shown that tortuosity, kinking, and coiling happened in many arteries and veins including internal carotid arteries, iliac arteries, coronary arteries, retinal arteries, conjunctival arteries, and others (Metz et al. 1961; Weibel and Fields 1965; Jakob et al. 1996; Del Corso et al. 1998; Amemiya and Bhutto 2001; Cheung et al. 2001; Owen et al. 2008). Artery tortuosity and kinking are shown to be associated with high blood pressure, aging, atherosclerosis, and other pathologic changes in the arteries (Del Corso et al. 1998; Pancera et al. 2000). Our previous studies suggested that loss of mechanical stability may lead to vessel tortuosity (Han 2007; Han 2009; Lee et al. 2011; Han 2012). It is thus important to better understand the stability of arteries.
Recent theoretical studies (Han 2007; Han 2008; Han 2011) have established linear and nonlinear artery models for buckling analysis using adjacent equilibrium approach and energy approach, and have demonstrated that arteries will buckle and become tortuous. However in these studies arteries were under static pressure but in vivo they are usually under pulsatile flow with both the mean pressure and the pulse pressure changing at physiological or pathological conditions. Very recently, Rachev proposed a mathematical model for arteries under pulsatile pressure based on beam vibration equation (Rachev 2009). This model provides theoretical insights into the dynamic stability of artery; however, experimental studies are needed to test the model predictions. Furthermore, it is of clinical interest to compare the buckling and post-buckling behaviors of arteries between static/steady flow and pulsatile flow condition, in order to better understand the mechanisms of artery tortuosity in vivo.
Accordingly, the objectives of this study were to determine, both experimentally and theoretically, the artery critical buckling pressure under pulsatile pressure and static pressure, and to elucidate the relationship of critical pressures under pulsatile flow, steady flow, and static pressure. In vitro experiments were performed using porcine carotid arteries. Buckling equations of nonlinear elastic artery under pulsatile pressure were also established and solved numerically to determine buckling pressures under static and pulsatile pressure.
2. Materials and Methods
2.1 Artery preparation and determination of stress-strain relationship
Carotid arteries were harvested from farm pigs (6 – 7 months, 100 – 150 kg) at local abattoirs post mortem and transported to our laboratory. These arteries underwent pressurized inflation test and the results were fitted with Fung strain energy function to determine their material constants as described previously (Martinez et al. 2010; Lee et al. 2011). A brief description of the process is given in the Appendix.
2.2 Artery buckling test
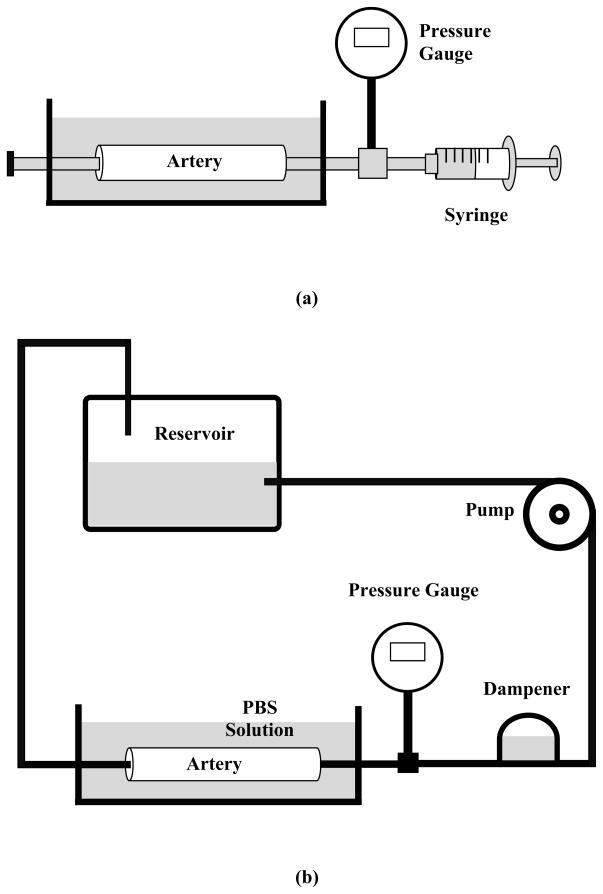
For each artery, we first determined the buckling pressures under static pressure. The artery was connected at both ends to cannulae in a tissue chamber, and was stretched axially to designated ratios of 1.3 and 1.5, as arteries are normally tethered and stretched of 1.2 – 1.6 (Learoyd and Taylor 1966; Han 2007). One cannula was connected to a pressure transducer and a syringe pump, while the other one at the distal end was closed (Fig. 1a). The artery was gradually pressurized with PBS by the syringe at 5 mmHg increment until large deflection was observed. The outer diameter and deflection of the artery were recorded by a digital camera at the same time.
Figure 1.
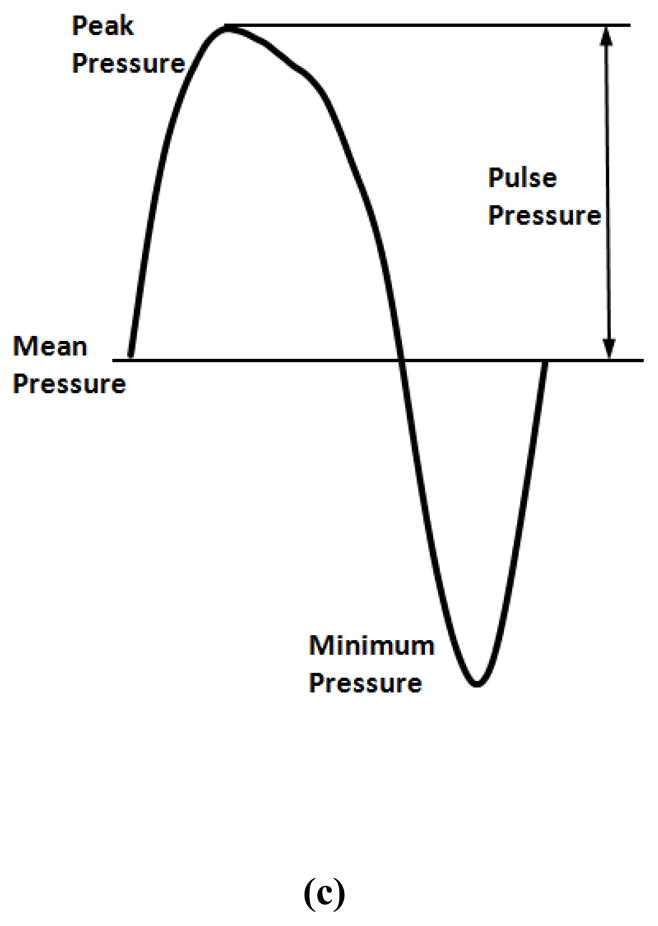
Schematics of the experimental setups. (a) Buckling test under static pressure; (b) buckling test under steady and pulsatile flow; (c) a sample pressure waveform recorded from one experiment illustrating the mean pressure (average of the peak and minimum) and the pulse pressure (half of the difference between the peak and minimum).
For buckling test under steady flow, the distal cannulae were connected to a flow loop which including a pump, a reservoir, and a dampening dome (Fig. 1b). The dampening dome was used to dampen off the pulsatility and keep the flow steady. The flow rate inside the loop was maintained at 160 ml/min by controlling the speed of the pump (Lee et al. 2010). Pressure was increased gradually until large deflection was observed in the arteries.
For buckling test under pulsatile flow, the dampening dome was replaced by a syringe filled with PBS and air. By adjusting the air volume in the syringe, the pulse pressure was controlled at a constant value (10 mmHg) during the tests. The mean pressure was gradually increased at increments of 5 mmHg until a large deflection in the arteries was observed. The mean pressure and pulse pressure were defined as the average and difference of the peak and minimum of the pressure wave, respectively (Fig. 1c).
After testing the critical buckling pressures under various loading conditions, several rings were cut off from each artery, and the inner and outer diameters of the cross section were measured and averaged.
2.3 Measurement of critical buckling pressure and deflection
The deflection of an artery was measured as the maximum displacement of the centerline of each artery at the maximum deflection point (approximately at the middle point). In the initial set of the experiment (artery # 1 – 5), the centerline position were determined as the average of the two edges measured from photos taken during the experiments using ImageJ. Later, to better measure the dynamic changes in deflection, the edge positions in a second set of arteries (artery # 6 – 10) were tracked automatically using a LED optical micrometer (LS7030, Keyence Corp., Osaka, Japan) recently acquired in our lab. The central line deflections were then determined by comparing the centerline position at each pressure to its baseline position at zero pressure. The deflections were then plotted with respect to the lumen pressure. The critical buckling pressure was defined such that the lateral deflection was about 0.5 mm.
2.4 Dynamic modeling of artery buckling under pulsatile pressure
Arteries were modeled as beam-columns with mass m per unit length, bending rigidity EI, axial tension N, and was subjected to pulsatile lumen pressure,
| (1) |
where Ω is the excitation angular frequency. Designating the lateral deflection of the artery (central axis) due to buckling as uc, the lateral distributed load q generated by pressure p was given by (Han 2009)
| (2) |
Following the beam-column model (Timoshenko and Gere 1963; Bazant and Cedolin 2003) and plugging in the distribution load q determined from in equations (1) and (2), the differential equation of dynamic motion became
| (3) |
For the case of an artery fixed at both ends, the solution of this equation is in the form of
| (4) |
where fn(t) are time dependent displacement functions. Taking Eq. (4) into Eq. (3), multiplying and integrating with respect to x from 0 to l, yield
| (5) |
where
| (6) |
where the area of the artery lumen, ωn0 is the nth natural angular frequency of the artery fixed at both ends.
For an artery at any given pressure and excitation, fn(t) can be determined using equation (5). In general, a dynamic system is stable if the displacements under small perturbation are bounded; it is unstable if the displacements of the system amplify with time. Accordingly, the critical pressure was determined as the minimum pressure at which the displacement became unstable in our simulations. For each given pulse pressure, the mean pressure was gradually increased until the displacement became unstable.
For steady flow and static pressure (pa = 0, fn(t) = constant), the critical buckling pressure (n = 1) became
| (7) |
This equation is the same as shown in (Han 2007; Han 2009). The bending rigidity EI was determined using arterial wall dimensions and material constants b0 – b6 (Han 2008; Han 2009).
3. Results
A total of 10 porcine arteries were tested. The initial geometrical dimensions of the arteries are shown in Table 1.
Table 1.
Initial dimensions of arteries tested.
| vessel | initial length (mm) | outer diameter (mm) | inner diameter (mm) | thickness (mm) |
|---|---|---|---|---|
| 1 | 45.0 | 5.38 | 3.38 | 1.00 |
| 2 | 44.0 | 5.50 | 4.50 | 0.50 |
| 3 | 52.2 | 7.20 | 4.28 | 1.46 |
| 4 | 47.2 | 7.12 | 4.03 | 1.55 |
| 5 | 44.0 | 6.85 | 3.78 | 1.54 |
| 6 | 38.1 | 6.06 | 2.68 | 1.69 |
| 7 | 41.8 | 4.98 | 3.02 | 0.98 |
| 8 | 43.0 | 6.23 | 2.72 | 1.75 |
| 9 | 45.9 | 5.36 | 2.65 | 1.35 |
| 10 | 51.7 | 5.42 | 2.91 | 1.25 |
| mean | 45.3 ± 4.3 | 6.01 ± 0.81 | 3.40 ± 0.70 | 1.31 ± 0.39 |
3.1 Mechanical properties of arteries
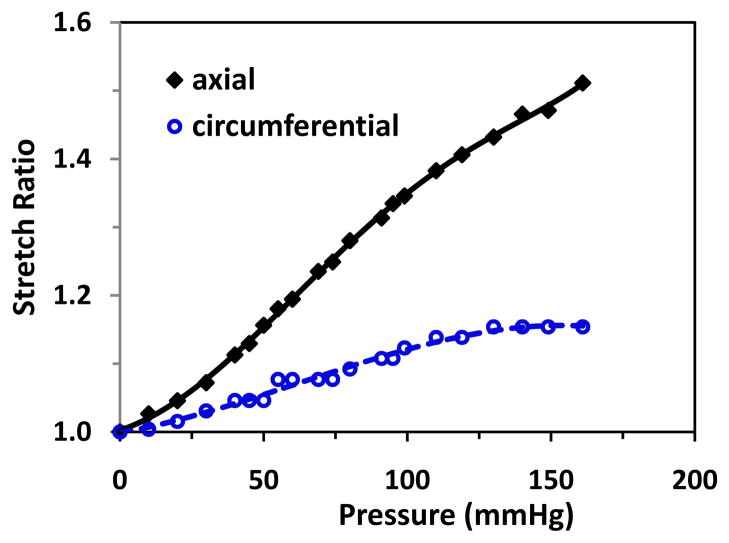
When being inflated with one end free to move, arteries dilated (circumferential stretch) and elongated (axial stretch) simultaneously (Fig. 2). The axial stretch ratio increased steadily with the pressure, but the circumferential stretch ratio increased slowly and nearly reached a plateau after the pressure reached about 125 mmHg, which indicates that the arteries were stiffer in the circumferential direction than in the axial direction. The material constants b0 – b6 for the Fung strain energy function obtained by fitting Eq. (A2) with the deformation-pressure relations are given in Table 2.
Figure 2.
Inflation test results of a typical artery. Changes of axial and outer wall circumferential stretch ratios plotted as functions of the lumen pressure.
Table 2.
Material constants obtained from inflation test.
| vessel | b1 | b2 | b3 | b4 | b5 | b6 | b0 (kPa) |
|---|---|---|---|---|---|---|---|
| 2 | 0.5056 | 0.09969 | 0.0010 | 0.6776 | 0.4170 | 0.3741 | 37.611 |
| 3 | 0.7259 | 0.0533 | 0.0010 | 0.6771 | 0.3212 | 0.7564 | 49.287 |
| 4 | 0.8136 | 0.030 | 0.0010 | 0.6030 | 0.1110 | 0.5536 | 60.275 |
| 5 | 0.4697 | 0.01647 | 0.0010 | 0.3443 | 0.028 | 0.2085 | 119.02 |
3.2 Critical buckling pressures under various pressure conditions
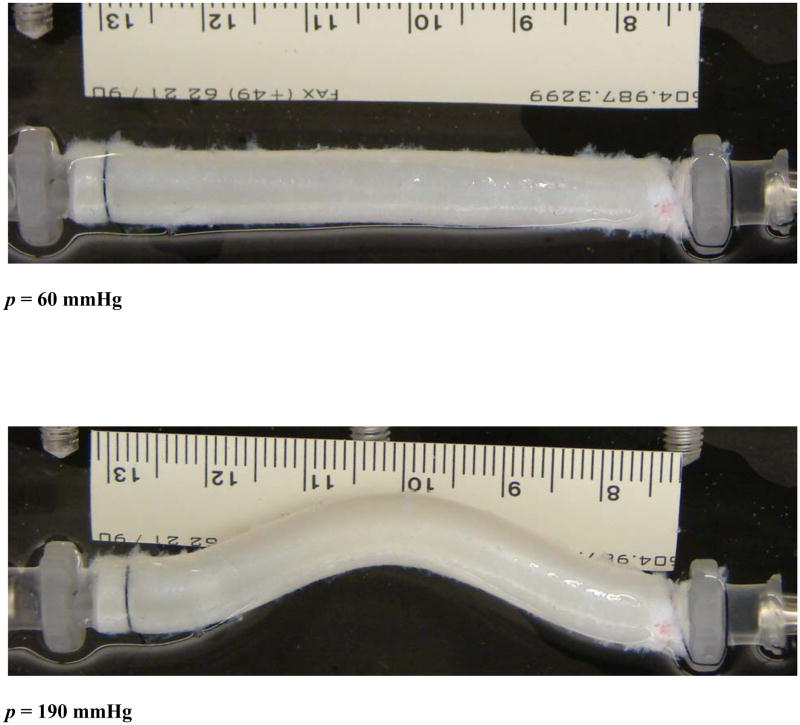
When being fixed at both ends and inflated under a gradual increasing static lumen pressure at a given length, arteries dilated (diameter increased) initially without lateral deflection (Fig. 3a). When the lumen pressure exceeded a critical value, arteries buckled and started to deflect. The deflection was initially very tiny and then gradually increased to become visually large with further increase of the pressure (post-buckling, Fig. 3b).
Figure 3.
Photographs of an artery before and after buckling. Top: at a pressure of 60 mmHg before buckling. Bottom: at a pressure of 190 mmHg after buckling. The buckling pressure of the artery was 85 mmHg.
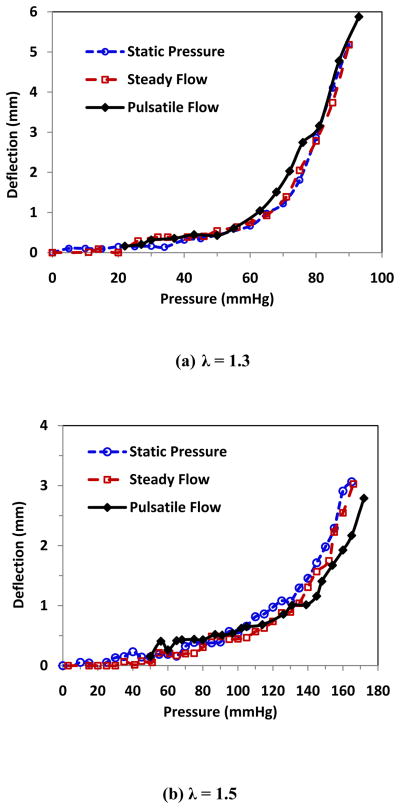
The critical pressures were first obtained for a group of 5 arteries at stretch ratios of 1.3 and 1.5 under static condition, steady flow, and pulsatile flow, respectively. The buckling behaviour under pulsatile pressure and steady flow were then carefully compared in another group of 5 arteries at a stretch ratio of 1.5 using a LED micrometer. The results showed that there was no significant difference between the buckling pressures under static condition and steady flow. The buckling pressures were significantly (p<0.05) higher at stretch ratio of 1.5 than at 1.3 (Table 3).
Table 3.
Experimental data of critical buckling pressure in the arteries.
| vessel # | Critical Pressure (mmHg)
|
|||||
|---|---|---|---|---|---|---|
| Axial stretch ratio = 1.3 | Axial stretch ratio = 1.5 | |||||
| static | steady | pulsatile | static | steady | pulsatile | |
| 1 | 40 | 43 | 44 | 110 | 120 | 124 |
| 2 | 60 | 50 | 50.5 | 71 | 70 | 74 |
| 3 | 64 | 69 | 60 | 98 | 101 | 89 |
| 4 | 58 | 55 | 55 | 60 | 80 | 80 |
| 5 | 52.5 | 50 | 52 | 93 | 100 | 97 |
| mean | 54.9 | 53.4 | 52.3 | 86.4 | 94.2 | 92.8 |
| 6 | 65 | 62 | ||||
| 7 | 97 | 100 | ||||
| 8 | 86 | 84 | ||||
| 9 | 116 | 116 | ||||
| 10 | 100 | 93 | ||||
| mean | 92.8 | 91 | ||||
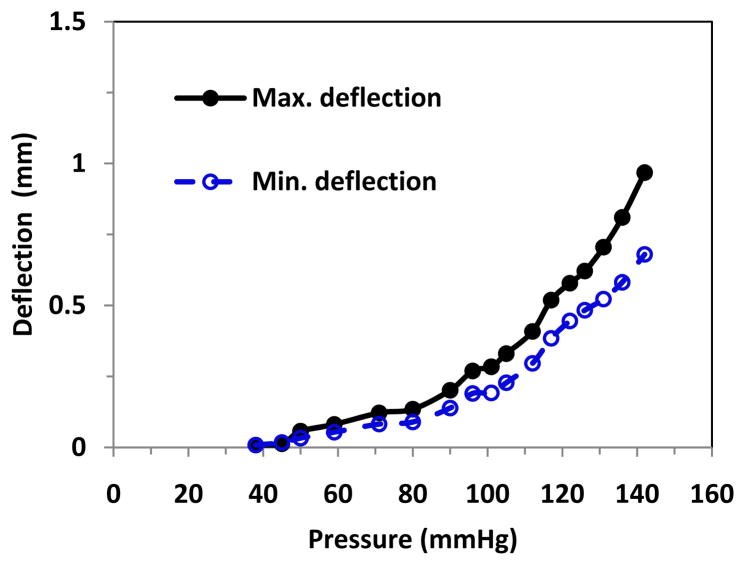
While the deflection increased steadily under static pressure or steady flow, the deflection increased with oscillation under oscillatory pulsatile pressure, and the difference between the maximum and minimum (peak and valley) deflections enlarged with the increase of the mean pressure (Fig. 4). The peak deflections were plotted with the peak pressure (mean pressure + pulse pressure) and compared with the deflection versus pressure plots under static and steady flow (Fig. 5). It is seen that when the lumen pressure continued to increase beyond the critical pressure, arterial deflections continued to increase. Under static pressure and steady flow, artery deflection versus pressure curves overlapped each other at both stretch ratios. Under pulsatile flow, the peak deflection versus peak pressure also nearly overlapped with those of static pressure and steady flow. The average critical buckling pressures under steady flow and the average critical peak pressure under pulsatile flow were 92.8 mmHg and 91.0 mmHg, respectively (Table 3). There were no statistical differences between these averages.
Figure 4.
Buckling behavior of an artery under pulsatile flow. The maximum and minimum deflections of the artery were plotted with respect to the pressure.
Figure 5.
Comparison of the buckling behavior of an artery under different conditions. The lateral deflection plotted as functions of lumen pressure at stretch ratio (a) λ = 1.3 and (b) λ = 1.5 under static pressure (○), steady flow (□), and pulsatile flow (◆). The maximum deflection was plotted as a function of the peak pressure for pulsatile flow.
These results suggest that under pulsatile flow the critical peak pressure approximately equals to the buckling pressures under static of steady flow conditions. In addition, arteries have the similar post-buckling behaviors under static pressure, steady flow, and pulsatile flow.
3.3 Critical pressures from model simulations
For a group of 4 arteries, each artery’s rigidity EI under mean pressure was determined using its dimensions and material constants (Han 2009), and then its dynamic buckling pressures were determined using the buckling equation. The predicted critical peak pressures are compared with the critical buckling pressures measured in the experiments under pulsatile pressure (Table 4). It is seen that model predicted artery buckling pressures under various pressure/flow conditions were lower than those measured in the experiments.
Table 4.
Comparison of experimentally measured and model predicted critical buckling peak pressures of arteries under pulsatile pressure.
| vessel | L/r | t/r | Critical Pressure (mmHg)
|
|||||
|---|---|---|---|---|---|---|---|---|
| Axial stretch ratio = 1.3 | Axial stretch ratio = 1.5 | |||||||
| exp | simulation | diff | exp | simulation | diff | |||
| 2 | 17.60 | 0.20 | 50.5 | 35.0 | 30.7% | 74.0 | 55.0 | 25.7% |
| 3 | 18.19 | 0.51 | 60 | 28.4 | 52.7% | 89.0 | 57.0 | 35.9% |
| 4 | 16.93 | 0.56 | 55 | 35.9 | 34.7% | 80.0 | 67.8 | 15.2% |
| 5 | 16.56 | 0.58 | 52 | 56.3 | 8.3% | 97.0 | 93.2 | 4.0% |
Note: L/r and t/r are the length to radius ratio and wall thickness to radius ratio, respectively.
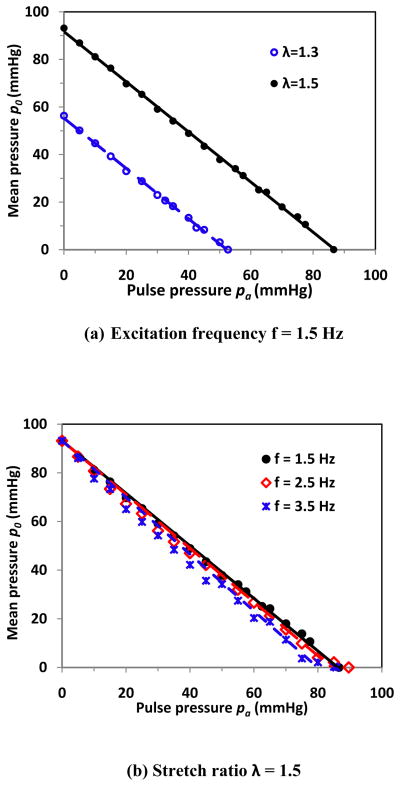
To further study the relationship of critical mean pressure and pulse pressure, we did simulations using the material constants of an artery (artery # 5 in Table 1). Our model simulations showed at low pulse pressure, the critical mean pressure and pulse pressure were nearly linearly correlated to each other. When rearranging the regression equation at λ = 1.5 and excitation frequency 1.5 Hz (approximately the heart rate in humans and pigs), for example, we got p0 + 1.08pa = 93.2 mmHg (Fig. 6a). This equation showed that the summation of critical mean pressure p0 and critical pulse pressure pa was approximately equal to a constant 93.2 mmHg, which was the critical buckling pressure under steady flow. It indicated that the artery buckled when the peak pressure of pulsatile flow reached the critical buckling pressure determined under steady flow. At higher pulse pressures, the influence of pulse pressure becomes greater. For example, for the vessel shown in Fig. 6a, the pulse effect became evident and the relation started to vary from linear when the pulse pressure reached above 30 mmHg for λ = 1.3 or 50 mmHg for λ = 1.5, which was most likely due to the dynamic effect at these conditions. The artery will buckle even when the peak pressure is less than the buckling pressure of steady flow at those cases.
Figure 6.
Model simulation results of a typical artery. The critical mean pressure p0 and pulse pressure pa was plotted at different frequencies and stretch ratios. (a) At excitation frequency f = 1.5 Hz. The linear regression equations for stretch ratios λ = 1.3 and 1.5 are p0 = −1.08pa + 56.3 and p0 = −1.08pa + 93.2 respectively; (b) at stretch ratio λ = 1.5. The linear regression equations are for frequencies f = 1.5 Hz, 2.5 Hz, and 3.5 Hz p0 = −1.08pa + 93.2, p0 = −1.10pa + 93.2, and p0 = −1.17pa + 93.2, respectively.
The excitation frequency also affects the stability of the artery. At given pulse pressure, the critical mean pressure decreased as the excitation frequency increased (Fig. 6b). For example, at pulse pressure 40 mmHg, the critical mean pressure decreased from 49 mmHg to 42 mmHg as the excitation frequency increased from 1.5 to 3.5 Hz. At frequency 3.5 Hz, the artery buckled when the peak pressure reached 85.7 mmHg, which was lower than the critical pressure of 93.2 mmHg under steady flow. Overall, the effects of excitation was small in the low frequency range (<5 Hz) but become larger in the higher frequency range. The relationship between the mean and pulse pressure becomes non-linear at higher excitation frequencies (> 5 Hz).
4. Discussion
We determined the critical buckling pressures of porcine carotid artery under static pressure, steady and pulsatile flow, and their relationship using experimental testing and a nonlinear anisotropic elastic model analysis. Both experimental and simulation results demonstrated that arterial buckling behaviors were similar under static pressure, steady and pulsatile flow. Arteries buckled under pulsatile flow when the peak pressure reached the critical pressure determined under static or steady conditions. Thus, for a given artery the critical mean pressure increased almost linearly with the decrease of the pulse pressure (at low frequencies < 5 Hz).
4.1 Model validations
The dynamic equation developed in our model is similar to the equation obtained previously. Our current equation was established through modeling the arterial wall per se subjected to internal pressure and axial tension, while the previous equation was obtained by modeling the arterial wall with the fluid inside subjected to an axial pressure force (Rachev 2009). Our model based on beam-column subject to axial tension and lateral distributed load (Timoshenko and Gere 1963; Bazant and Cedolin 2003) while the previous one was based on beam vibration under axial force (Xie 2006). Another difference is that we considered the arteries fixed at both ends which were the same as the boundary conditions in the experimental setting (see Fig. 3), while the previous model analysis was based on arteries simply pinned at both ends. Mathematically, these equations are similar and the similarity provides a validation to the equation.
Our model predictions of critical pressures demonstrated a significant difference from our experimental measurements. There are several possible reasons for the difference. First, our model ignored the geometric and material variations within the arterial wall. Our previous simulation results showed that geometric variations could slightly reduce or increase the buckling pressure (Datir 2010). However, since the carotid arteries used were very close to uniform cylindrical tubes, we expect that the error due to these factors would be small. Second, a mean opening angle (139.4°) obtained from a group of similar arteries was used in model simulations since opening angle was not measured for the individual vessel tested. Our results demonstrated that the opening angle has a small effect on the material constants overall. Further analysis demonstrated that the material constants and critical pressure were not sensitive to the opening angle. For example, for this artery #5 which had the most change in material constants, when the opening angle changed from 139.4° to 100°, the material property constants changed within 10%, and the critical pressures changed from 56.3 to 56.93 mmHg at stretch ratio 1.3, and from 93.2 to 95.28 mmHg at stretch ratio 1.5. Therefore, we concluded that the opening angle had little effect on the critical pressure. This conclusion is consistent with our previous simulation results using rabbit artery data from Chuong and Fung (Chuong and Fung 1986; Han 2009).
On the other hand, due to material and geometric nonlinearity, the deflection is very small when buckling occurs (Han 2009). Although the deflection will increase with pressure beyond the critical state and become large, as seen in the experiment as well as in vivo, it is very difficult in practices to determine the pcr by measuring the deflection at the critical state. We thus determined the critical buckling pressures as the pressures at which the deflections reached a small value (~0.5 mm), and thus the readings are slightly higher than the critical pressure. It was estimated that the critical pressures determined could have an error of 5 mmHg. This is most likely the main reason that the buckling pressures measured from the experiments were higher than those predicted. However, this overestimation would occur in all 3 loading conditions, therefore the relationships of the critical pressures among these loading conditions obtained in our experiments still remain valid, as verified by the theoretical simulations.
Furthermore, our model results demonstrated consistence with experimental results. First, while errors exist, the model predicted critical pressures correlated well with experimental measurements (R2 = 0.65). Second, the dynamic buckling tests performed under two stretch ratios verified that the critical buckling pressures increased as stretch ratio increased from 1.3 to 1.5. These results are consistent with the model analysis, as well as our previous theoretical analysis and experimental observations for arteries (Han 2007; Han 2008) and veins (Lee and Han 2010; Martinez et al. 2010) under static pressure.
In addition, further simulation demonstrated that a long artery segment with a bigger L/r value tended to buckle at a lower pressure compared to a shorter artery, although the difference would become small when the L/r reached a certain level. Previous theoretical study (Han 2007; Han 2009) showed critical buckling pressures changed very little when L/r > 15. Since our model predictions were vessel specific, it was in fact advantageous to use different length and L/r value to illustrate the predictive value of the model. Accordingly, both vessel length or slenderness ratio (L/r) of the arteries were allowed to vary among our artery samples.
4.2 Limitations
In the current model, the arterial wall was assumed to be homogeneous and cylindrical. The effects of layered-wall structure, possible geometric and material variations on the critical pressure of arteries were ignored. As discussed above, we expect the effect of these imperfections to be moderate.
Another limitation of this study is that we did not consider the surrounding tissue’s effect on artery buckling. At in vivo condition, arteries are surrounded by connective tissues and muscles, arteries will buckle at higher critical pressures and at higher order mode shapes rather than the basal mode shape at in vitro condition. The tissue effect can be simulated as elastic matrix and adding an elastic force to equation (4) as demonstrated previously (Han 2009). In addition, here we expressed the pulsatile pressure as a cosine function of the first harmonic mode; using multiple harmonic functions would better simulate the in vivo pressure waveform but will be more complex mathematically.
4.3 Model application
The conclusions from the current study are applicable to human and pig arteries since the pulse frequency is about 1.5 – 2 Hz in pigs (Gorge et al. 1994) and < 2 Hz in humans. However these results are not true at higher frequencies (> 5 Hz). The relation of mean pressure and pulse pressure becomes nonlinear at higher heart beat rate, and thus is not applicable to mouse that has a pulse frequency of 8 – 10 Hz. This is due to the strong dynamic effects on the artery at high frequencies. In addition, although our simulations were based on arteries fixed at both ends, this model can also be applied to arteries under various boundary conditions by using “equivalent length” (Han 2007; Han 2009).
4.4 Clinical relevance
The current study demonstrated that arteries buckled under increased lumen pressure, which is consistent with previous results (Han 2007; Han 2008; Han 2011). These results are supported by clinical observations that arteries became tortuous under increased pressure or reduced stretch ratio, shortening the redundant arteries and vein grafts in patients eliminated tortuosity and kinking (Han et al. 1998; Ballotta et al. 2005; Illuminati et al. 2008), indicating vessel stability (buckling pressure) increased with increased axial stretch ratio. The current model can be used to determine the critical level of axial strain in blood vessels in vascular reconstruction and grafting to prevent vessel tortuosity or kinking.
Arteries in vivo are subjected to pulsatile flow. The pulse pressure increases significantly in aged population (Izzo et al. 2000), and high pulse pressure was found to stimulate the matrix remodeling of the artery in aging and vascular diseases (Dart and Kingwell 2001; Galis and Khatri 2002; Yao et al. 2009). Under high pulsatile pressure arteries may lose stability and buckle, which would change lumen blood flow and wall stress and result in thrombosis (Liu et al. 2008; Chesnutt and Han 2011) and arterial wall remodeling (Smedby and Bergstrand 1996; Wood et al. 2006). Our results also provide a useful tool to determine the critical pulse pressure that will cause the loss of stability in the artery. These results also enhance our understanding of the stability of arteries under pulsatile flow in vivo. Understanding the behavior of artery buckling would enrich our knowledge of vascular physiology and pathology.
Acknowledgments
This work was supported by CAREER award #0644646 from the National Science Foundation and grant R01HL095852 from the National Institute of Health. We also thank Watark at Poth and Granzins at New Braunfels, TX for their kind help.
Appendix
A1. Artery preparation
Carotid arteries were harvested from farm pigs at local abattoirs post mortem. The arteries were rinsed with Dulbecco’s phosphate buffered saline (PBS, Sigma Chemical, St. Louis, MO), stored in ice-cold PBS, and transported to our laboratory. Once in the laboratory, arteries were transferred into PBS at room temperature. Excessive tissues on the arteries were removed. Each end of arteries was tied to a luer connector (Cole Parmer, Vernon Hill, IL). Then, with one end connected to a syringe and the other end closed, arteries were inflated very briefly with air to check for leaks. Only arteries with no leaks or branches would be used for buckling tests.
Arterial segments were mounted to a cannula in a tissue chamber at one end, and the other end tied onto a luer stopper and allowed to move freely. Then they were preconditioned by inflating and deflating gradually with PBS from 0 to 200 mmHg using a syringe pump connected to the luer connector. Preconditioning would be repeated 5 – 10 times.
A2. Inflation test
To obtain the stress-strain relationship (material properties) of the arteries, we measured the elongations and diameters of arteries under gradually increased internal pressure load (Martinez et al. 2010; Lee et al. 2011). Briefly, arteries were connected one end with a syringe pump and a pressure transducer, and the other end occluded by a stopper but free to move. After measurement of the initial lengths and outer diameters, the arteries were inflated with PBS slowly at 5 mmHg intervals till 120 mmHg. The outer diameter and axial length of the arteries were recorded simultaneously using a digital camera and measured later using ImageJ software (National Institutes of Health).
A3. Determination of nonlinear stress-strain relationship
Arteries were modeled as thick-walled cylinders with wall properties characterized by Fung’s exponential strain energy function (Fung 1993),
| (A1) |
where b0 – b6 are the material property constants and K is a Lagrangian multiplier for incompressibility. Eθ, Ez, and Er are the Green strain components in the circumferential, axial, and radial directions, all refer to the zero-stress state as described previously (Fung 1990; Humphrey 2002; Han 2008; Han 2009). An opening angle of 139.4° and a thickness increase of 1.005-fold from load-free state to zero-stress state obtained from a previous study were used in the calculations (Lee et al. 2011). The inner and outer radii at the zero-stress state were determined from the inner and outer radii at no-load state using wall incompressibility condition.
By using the equilibrium equation for cylindrical artery under axial load and internal pressure with the boundary conditions that internal pressure is p and outer pressure equals 0. The internal pressure p and axial force N in the vessel can be expressed as (Fung 1990; Humphrey 2002; Han 2008; Han 2009):
| (A2) |
wherein ri, re are the inner and outer radii. The material constants were determined by fitting Eq. (A2) to experimental data from the inflation tests (Lee et al. 2011). The input parameters included initial dimensions (outer/inner diameter and wall thickness) measured from the cross section of short ring segments, the outer diameter re, vessel length l, axial force N (=πr2p), and lumen pressure p measured from the inflation test, and the lumen radius determined based on wall incompressibility (Han 2008).
Footnotes
Conflict of interest
The authors have no conflict of interest.
Publisher's Disclaimer: This is a PDF file of an unedited manuscript that has been accepted for publication. As a service to our customers we are providing this early version of the manuscript. The manuscript will undergo copyediting, typesetting, and review of the resulting proof before it is published in its final citable form. Please note that during the production process errors may be discovered which could affect the content, and all legal disclaimers that apply to the journal pertain.
References
- Amemiya T, I, Bhutto A. Retinal vascular changes and systemic diseases: corrosion cast demonstration. Ital J Anat Embryol. 2001;106(2 Suppl 1):237–44. [PubMed] [Google Scholar]
- Ballotta E, Thiene G, Baracchini C, Ermani M, Militello C, Da Giau G, Barbon B, Angelini A. Surgical vs medical treatment for isolated internal carotid artery elongation with coiling or kinking in symptomatic patients: a prospective randomized clinical study. J Vasc Surg. 2005;42(5):838–46. doi: 10.1016/j.jvs.2005.07.034. discussion 846. [DOI] [PubMed] [Google Scholar]
- Bazant ZP, Cedolin L. Stability of Structures: Elastic, Inelastic, Fracture, and Damage Theories. Mineola, NY: Dover Publications, Inc; 2003. [Google Scholar]
- Chesnutt JK, Han HC. Tortuosity triggers platelet activation and thrombus formation in microvessels. J Biomech Eng. 2011;133(12):121004. doi: 10.1115/1.4005478. [DOI] [PMC free article] [PubMed] [Google Scholar]
- Cheung AT, Ramanujam S, Greer DA, Kumagai LF, Aoki TT. Microvascular abnormalities in the bulbar conjunctiva of patients with type 2 diabetes mellitus. Endocr Pract. 2001;7(5):358–63. doi: 10.4158/EP.7.5.358. [DOI] [PubMed] [Google Scholar]
- Chuong CJ, Fung YC. On residual stresses in arteries. J Biomech Eng. 1986;108(2):189–92. doi: 10.1115/1.3138600. [DOI] [PubMed] [Google Scholar]
- Dart AM, Kingwell BA. Pulse pressure--a review of mechanisms and clinical relevance. J Am Coll Cardiol. 2001;37(4):975–84. doi: 10.1016/s0735-1097(01)01108-1. [DOI] [PubMed] [Google Scholar]
- Datir P, Lee AY, Lamm SD, Han HC. Effect of geometric variations on the vuckling of arteries. Int J Appl Mech. 2010;3(2):385–406. doi: 10.1142/S1758825111001044. [DOI] [PMC free article] [PubMed] [Google Scholar]
- Del Corso L, Moruzzo D, Conte B, Agelli M, Romanelli AM, Pastine F, Protti M, Pentimone F, Baggiani G. Tortuosity, kinking, and coiling of the carotid artery: expression of atherosclerosis or aging? Angiology. 1998;49(5):361–71. doi: 10.1177/000331979804900505. [DOI] [PubMed] [Google Scholar]
- Fung YC. Biomechanics: motion, flow, stress, and growth. New York: Springer-Verlag; 1990. [Google Scholar]
- Fung YC. Biomechanics: Mechanical Properties of Living Tissues. New York: Springer Verlag; 1993. [Google Scholar]
- Galis ZS, Khatri JJ. Matrix metalloproteinases in vascular remodeling and atherogenesis: the good, the bad, and the ugly. Circ Res. 2002;90(3):251–62. [PubMed] [Google Scholar]
- Gorge G, Erbel R, Dobbertin A, Hanggi M, Hake U, Meyer J. Isolated in-vitro perfusion of pig hearts obtained from the abattoir - an alternative to animal-experiments. European Heart J. 1994;15(6):851–857. doi: 10.1093/oxfordjournals.eurheartj.a060594. [DOI] [PubMed] [Google Scholar]
- Han HC. A biomechanical model of artery buckling. J Biomech. 2007;40(16):3672–3678. doi: 10.1016/j.jbiomech.2007.06.018. [DOI] [PMC free article] [PubMed] [Google Scholar]
- Han HC. Nonlinear buckling of blood vessels: a theoretical study. J Biomech. 2008;41(12):2708–2713. doi: 10.1016/j.jbiomech.2008.06.012. [DOI] [PubMed] [Google Scholar]
- Han HC. Blood vessel buckling within soft surrounding tissue generates tortuosity. J Biomech. 2009;42(16):2797–801. doi: 10.1016/j.jbiomech.2009.07.033. [DOI] [PubMed] [Google Scholar]
- Han HC. The theoretical foundation for artery buckling under internal pressure. J Biomech Eng. 2009;131(12):124501. doi: 10.1115/1.4000080. [DOI] [PubMed] [Google Scholar]
- Han HC. Determination of the critical buckling pressure of blood vessels using the energy approach. Ann Biomed Eng. 2011;39(3):1032–1040. doi: 10.1007/s10439-010-0212-2. [DOI] [PMC free article] [PubMed] [Google Scholar]
- Han HC. Twisted blood vessels: symptoms, etiology, and biomechanical mechanisms. J Vasc Res. 2012;49 doi: 10.1159/000335123. In press. [DOI] [PMC free article] [PubMed] [Google Scholar]
- Han HC, Zhao L, Huang M, Hou LS, Huang YT, Kuang ZB. Postsurgical changes of the opening angle of canine autogenous vein graft. J Biomech Eng. 1998;120(2):211–6. doi: 10.1115/1.2798304. [DOI] [PubMed] [Google Scholar]
- Humphrey JD. Cardiovascular solid mechanics: cells, tissues, and organs. New York: Springer; 2002. [Google Scholar]
- Illuminati G, Ricco JB, Calio FG, D’Urso A, Ceccanei G, Vietri F. Results in a consecutive series of 83 surgical corrections of symptomatic stenotic kinking of the internal carotid artery. Surgery. 2008;143(1):134–9. doi: 10.1016/j.surg.2007.07.029. [DOI] [PubMed] [Google Scholar]
- Izzo JL, Jr, Levy D, Black HR. Clinical Advisory Statement. Importance of systolic blood pressure in older Americans. Hypertension. 2000;35(5):1021–4. doi: 10.1161/01.hyp.35.5.1021. [DOI] [PubMed] [Google Scholar]
- Jackson ZS, Dajnowiec D, Gotlieb AI, Langille BL. Partial off-loading of longitudinal tension induces arterial tortuosity. Arterioscler Thromb Vasc Biol. 2005;25(5):957–62. doi: 10.1161/01.ATV.0000161277.46464.11. [DOI] [PubMed] [Google Scholar]
- Jakob M, Spasojevic D, Krogmann ON, Wiher H, Hug R, Hess OM. Tortuosity of coronary arteries in chronic pressure and volume overload. Cathet Cardiovasc Diagn. 1996;38(1):25–31. doi: 10.1002/(SICI)1097-0304(199605)38:1<25::AID-CCD7>3.0.CO;2-5. [DOI] [PubMed] [Google Scholar]
- Learoyd BM, Taylor MG. Alterations with age in the viscoelastic properties of human arterial walls. Circ Res. 1966;18(3):278–292. doi: 10.1161/01.res.18.3.278. [DOI] [PubMed] [Google Scholar]
- Lee AY, Han B, Lamm SD, Fierro CA, Han HC. Effects of elastin degradation and surrounding matrix support on artery stability. Am J Physiol Heart Circ Physiol. 2011 doi: 10.1152/ajpheart.00463.2011. epub online Dec 9. [DOI] [PMC free article] [PubMed] [Google Scholar]
- Lee AY, Han HC. A Nonlinear Thin-Wall Model for Vein Buckling. Cardiovasc Eng. 2010;1(4):282–289. doi: 10.1007/s13239-010-0024-4. [DOI] [PMC free article] [PubMed] [Google Scholar]
- Lee YU, Hayman D, Sprague EA, Han HC. Effects of axial stretch on cell proliferation and intimal thickness in arteries in organ culture. Cell & Mol Bioeng. 2010;3(3):286–295. doi: 10.1007/s12195-010-0128-9. [DOI] [PMC free article] [PubMed] [Google Scholar]
- Liu Q, Mirc D, Fu BM. Mechanical mechanisms of thrombosis in intact bent microvessels of rat mesentery. J Biomech. 2008;41(12):2726–34. doi: 10.1016/j.jbiomech.2008.06.013. [DOI] [PubMed] [Google Scholar]
- Martinez R, Fierro CA, Shireman PK, Han HC. Mechanical buckling of veins under internal pressure. Ann Biomed Eng. 2010;38(4):1345–53. doi: 10.1007/s10439-010-9929-1. [DOI] [PMC free article] [PubMed] [Google Scholar]
- Metz H, Murray-Leslie RM, Bannister RG, Bull JW, Marshall J. Kinking of the internal carotid artery. Lancet. 1961;1(7174):424–6. doi: 10.1016/s0140-6736(61)90004-6. [DOI] [PubMed] [Google Scholar]
- Owen CG, Newsom RS, Rudnicka AR, Barman SA, Woodward EG, Ellis TJ. Diabetes and the tortuosity of vessels of the bulbar conjunctiva. Ophthalmology. 2008;115(6):e27–32. doi: 10.1016/j.ophtha.2008.02.009. [DOI] [PubMed] [Google Scholar]
- Pancera P, Ribul M, Presciuttini B, Lechi A. Prevalence of carotid artery kinking in 590 consecutive subjects evaluated by Echocolordoppler. Is there a correlation with arterial hypertension? J Intern Med. 2000;248(1):7–12. doi: 10.1046/j.1365-2796.2000.00611.x. [DOI] [PubMed] [Google Scholar]
- Rachev A. A theoretical study of mechanical stability of arteries. J Biomech Eng. 2009;131(5):051006. doi: 10.1115/1.3078188. [DOI] [PubMed] [Google Scholar]
- Smedby O, Bergstrand L. Tortuosity and atherosclerosis in the femoral artery: what is cause and what is effect? Ann Biomed Eng. 1996;24(4):474–80. doi: 10.1007/BF02648109. [DOI] [PubMed] [Google Scholar]
- Timoshenko SP, Gere JM. Theory of Elastic Stability. New York: McGraw-Hill; 1963. [Google Scholar]
- Weibel J, Fields WS. Tortuosity, Coiling, and Kinking of the Internal Carotid Artery. Ii. Relationship of Morphological Variation to Cerebrovascular Insufficiency. Neurology. 1965;15:462–468. doi: 10.1212/wnl.15.5.462. [DOI] [PubMed] [Google Scholar]
- Wood NB, Zhao SZ, Zambanini A, Jackson M, Gedroyc W, Thom SA, Hughes AD, Xu XY. Curvature and tortuosity of the superficial femoral artery: a possible risk factor for peripheral arterial disease. J Appl Physiol. 2006;101(5):1412–8. doi: 10.1152/japplphysiol.00051.2006. [DOI] [PubMed] [Google Scholar]
- Xie W-C. Dynamic stability of structures. New York: Cambridge University Press; 2006. [Google Scholar]
- Yao Q, Hayman DM, Dai Q, Lindsey ML, Han HC. Alterations of pulse pressure stimulate arterial wall matrix remodeling. J Biomech Eng. 2009;131(10):101011. doi: 10.1115/1.3202785. [DOI] [PMC free article] [PubMed] [Google Scholar]


