Abstract
Formate can differentiate between hyperhomocysteinemia due to impaired remethylation and impaired transsulfuration. Am J Physiol Endocrinol Metab 301: E000–E000, 2011. First published September 20, 2011; 10.1152/ajpendo.00345.2011.—We carried out a 1H-NMR metabolomic analysis of sera from vitamin B12-deficient rats. In addition to the expected increases in methylmalonate and homocysteine (Hcy), we observed an approximately sevenfold increase in formate levels, from 64 μM in control rats to 402 μM in vitamin B12-deficient rats. Urinary formate was also elevated. This elevation of formate could be attributed to impaired one-carbon metabolism since formate is assimilated into the one-carbon pool by incorporation into 10-formyl-THF via the enzyme 10-formyl-THF synthase. Both plasma and urinary formate were also increased in folate-deficient rats. Hcy was elevated in both the vitamin B12- and folate-deficient rats. Although plasma Hcy was also elevated, plasma formate was unaffected in vitamin B6-deficient rats (impaired transsulfuration pathway). These results were in accord with a mathematical model of folate metabolism, which predicted that reduction in methionine synthase activity would cause increased formate levels, whereas reduced cystathionine β-synthase activity would not. Our data indicate that formate provides a novel window into cellular folate metabolism, that elevated formate can be a useful indicator of deranged one-carbon metabolism and can be used to discriminate between the hyperhomocysteinemia caused by defects in the remethylation and transsulfuration pathways.
vitamin b12 deficiency results in a wide spectrum of hematologic and neuropsychiatric disorders. The detection of vitamin B12 deficiency has traditionally been based on low serum vitamin B12 levels, with supportive clinical evidence of disease. It is now recognized that serum vitamin B12 may be insufficient to detect a deficiency, especially in the case of elderly subjects without hematologic abnormalities. The measurement of metabolites such as homocysteine (Hcy) and methylmalonic acid (MMA) has been shown to be more sensitive in diagnosing vitamin B12 deficiency (33, 34). In a search for novel biomarkers of vitamin B12 deficiency, we fed rats a vitamin B12-deficient diet and subjected their sera to 1H-NMR metabolomic analysis. Together with the expected increased concentrations of Hcy and MMA, we found an approximately sevenfold increase in both serum and urinary formate concentrations in the vitamin B12-deficient animals. We confirmed that elevated formate would also be found in folate-deficient rats, since impaired folate metabolism (via the methylfolate trap) is a well-recognized consequence of vitamin B12 deficiency (12, 31, 32) and because formate is incorporated into 10-formyl-tetrahydrofolate (THF) via 10-formyl-THF synthase (37). Both folate and vitamin B12 deficiencies are characterized by elevated plasma Hcy. A deficiency of pyridoxal (vitamin B6) also causes elevated plasma Hcy, which becomes more pronounced after methionine loading (18). This is due to impaired removal of Hcy via the transsulfuration pathway, since the two enzymes of this pathway [cystathionine β-synthase (CBS) and cystathionine γ-lyase] employ pyridoxal 5′-phosphate as a cofactor. We hypothesized that formate would remain low during vitamin B6 deficiency and that this could be used to discriminate the hyperhomocysteinemia of vitamin B6 deficiency from that due to either folate or vitamin B12 deficiency. This hypothesis was also experimentally tested.
MATERIALS AND METHODS
Reagents.
HPLC-grade methanol and acetonitrile were obtained from Fisher Scientific. D3-MMA was obtained from Cambridge Isotope (Andover, MA). All other chemicals and reagents were obtained from Sigma.
Animals.
Male Sprague-Dawley rats (25 days old) were obtained from Memorial University's breeding colony. They were housed on a 12:12-h light-dark cycle and had continuous access to food and fresh water. Rats were weighed weekly during the feeding experiments. For the vitamin B12 deficiency experiment, the rats were housed in cages with a floor grid so that feces, which might contain microbially produced B12, would become inaccessible to the animal. The vitamin B12-deficient diet was prepared as described by Choi et al. (6); the control and deficient diets were identical, except that 50 μg/kg of vitamin B12 (cyanocobalamin) was added to the control. A commercial version of the Clifford/Koury folate-deficient l-amino acid rodent diet with 1% succinyl sulfathiazole [cat. no. 517777; Dyets, Bethlehem, PA (4)] was used in the folate deficiency experiments. The control diet was identical, except it was supplemented with 2 mg/kg folic acid. In both the vitamin B12 and folate deficiency experiments, the rats were housed in metabolic cages for the final 48 h so as to collect urine. Urine was collected into a sodium azide solution to prevent bacterial growth. The vitamin B6-deficient diet was from Dyets (cat. no. 117017); the control diet was identical, except it was supplemented with 7 mg/kg pyridoxine.
For vitamin B12 deficiency, rats (initial weight 59.7 ± 7.7 g) were randomly assigned to either a vitamin B12-deficient or control diet for 6 wk. In the case of folate deficiency, rats (initial weight 62.5 ± 4.0 g) were randomly assigned to a folate-deficient or control diet for 4 wk. A time course of folate deficiency was also carried out by placing 12 rats each on either a folate-deficient diet or a control diet, as described above; three rats in each group were euthanized after 1, 5, 10, and 15 days. Vitamin B6 deficiency was produced by feeding rats (initial weight 68.2 ± 2.6 g) on a vitamin B6-deficient diet for 4 wk. Some of the rats were then lightly anesthetized with isoflurane (IsoFlo; Abbott Laboratories, Saint-Laurent, QC, Canada) and received a gastric gavage of 100 mg/kg body wt l-methionine dissolved in physiological saline, as described by Miller et al. (18), and returned to their cages. Blood was sampled as described above 2 h after the methionine gavage. Six rats on the control diet also received a methionine load.
Tissue and blood sampling.
Rats were anesthetized with 6 mg of pentobarbital sodium (ip)/100 g body wt. After laparotomy, blood was drawn from the aorta. For the metabolomic experiment, the blood was taken into vacuum tubes (no additive) and allowed to clot on ice for 2 h. The tubes were then centrifuged for 10 min and the serum aliquoted into microcentrifuge tubes and stored at −80°C. When plasma was required, the blood was taken into heparinized tubes and promptly centrifuged, and the plasma was stored at −80°C until required for analysis. Immediately following blood collection, liver and brain were rapidly freeze-clamped in liquid nitrogen and stored at −80°C until further analysis.
Metabolomic analysis.
Sera of rats from the vitamin B12-deficient study were deproteinized by ultrafiltration, using spin columns with a molecular cutoff of 3 kDa (Nanosep 3K omega; Pall Canada, Ville St-Laurent, QC, Canada) that were initially washed as recommended by Tiziani et al. (38). Deproteinized samples were spiked with 2,2-dimethyl-2-sila 3,3,4,4,5,5-hexadeuteropentane sulphonic acid (DSS-D6) to a final concentration of 0.25 mM; this served as both a chemical shift indicator and a concentration standard for determining absolute metabolite concentrations. Spectra were acquired on a 600-MHz Varian Inova NMR spectrometer (Varian, Palo Alto, CA) at 30°C using a tnnoesy pulse sequence (circa Vnmr 6.1B software, Varian). All spectra had an acquisition time of 4 s, a preacquisition delay of 1 s, a mixing time of 0.1 s, and a sweep width of 7,200 Hz, and 256 transients were collected with 33.5-k data points. Spectra were Fourier-transformed without line broadening, referenced to the DSS-D6 singlet at 0 ppm, manually phased, and baseline corrected. Chenomx NMR Suite Professional software version 4.5 (Chenomx, Edmonton, AB, Canada) was used for identification and quantification of metabolites by computer-assisted manual fitting of selected peaks (41).
Biochemical assays.
Methylmalonic acid was assayed by LC-MS with D3-MMA as an internal standard (11). Formate in serum or plasma was measured by an enzyme assay, using formate dehydrogenase (10); urinary formate was measured by 1H-NMR as follows: 60 μl of buffer (1.5 M potassium phosphate, 2 mM NaN3, pH 7.4) was added to 540 μl of urine, and this was syringe-filtered, through a 0.45-μm filter, directly into NMR tubes. NMR experiments were performed on a Bruker Avance II 600-MHz NMR spectrometer equipped with an inverse-detection probe (TXI). 1H spectra (256 scans) were recorded at 298 K with a water suppression pulse sequence using excitation sculpting with gradients (zgesgp). A stem coaxial insert containing a 0.2 mM solution of DSS in D2O was used for both locking and calibration. Spectra were processed using MestreNova (Mestrelab, Santiago de Compostela, Spain). The intensity of the formate peak at 7.4 ppm was referenced to the DSS signal and the formate concentration determined from a standard curve. Vitamin B12 and folate were measured by microbiological assays (19). Hcy (40), S-adenosylmethionine (SAM), and S-adenosylhomocysteine (SAH) (13) and vitamin B6 vitamers (16) were measured by HPLC.
Mathematical modeling of folate-mediated one-carbon metabolism.
The InSilicoMetabolism (ISM) software is a mathematical model of folate-mediated one-carbon and glutathione metabolism (22). The model is based on known metabolic pathways and the reaction kinetics of individual steps in these pathways. The accompanying software enables us to alter a number of parameters and determine the predicted effect on formate and Hcy concentrations. We mimicked the effect of vitamin B12 deficiency by decreasing the velocity of the MS reaction and of vitamin B6 deficiency by decreasing the velocity of the CBS reaction. The model then predicted the expected changes in metabolite concentrations and reaction velocities under the altered conditions.
Statistical analyses.
Data are presented as means ± SD. The experimental and control groups were compared using Student's t-test. All tests were two-tailed, and means were considered significantly different when P < 0.05. GraphPad Prism 5.0 was used for the statistical analyses.
RESULTS
Confirmation of vitamin B12 deficiency.
Table 1 shows that the animals had significantly reduced levels of vitamin B12 in serum, brain, and liver. Furthermore, serum MMA was elevated 28-fold. SAM levels were decreased significantly in both brain and liver, as was the ratio of SAM to SAH. Clearly, these animals were functionally deficient in vitamin B12. In particular, the decreased SAM/SAH ratio points to a defect in remethylation.
Table 1.
Vitamin B12, folate, and related metabolites in serum of B12-deficient rats
| Control | Deficient | P Value | |
|---|---|---|---|
| Serum | |||
| B12, pg/ml | 1,041.33 ± 62.30 | 426.5 ± 77.84* | <0.001 |
| Folate, ng/ml | 65.48 ± 17.35 | 82.25 ± 12.99 | 0.087 |
| Hcy, μM | 6.85 ± 0.72 | 31.07 ± 2.77* | <0.001 |
| MMA, μM | 0.18 ± 0.05 | 5.11 ± 3.24* | 0.004 |
| Brain | |||
| B12, ng/g | 45.71 ± 3.27 | 17.51 ± 1.60* | <0.001 |
| SAM, nmol/g | 29.80 ± 1.44 | 26.22 ± 1.12* | <0.001 |
| SAH, nmol/g | 1.06 ± 0.08 | 1.09 ± 0.13 | 0.643 |
| SAM/SAH | 28.04 ± 1.59 | 24.18 ± 2.99* | 0.019 |
| Liver | |||
| Vitamin B12, ng/g | 38.25 ± 4.44 | 6.07 ± 0.79* | <0.001 |
| SAM, nmol/g | 79.50 ± 23.96 | 55.40 ± 4.66* | 0.036 |
| SAH, nmol/g | 13.24 ± 3.37 | 14.81 ± 0.83 | 0.294 |
| SAM/SAH | 6.27 ± 1.94 | 3.75 ± 0.39* | 0.011 |
Data are given as means ± SD (n = 6). Hcy, homocysteine; MMA, methylmalonic acid; SAM, S-adenosylmethionine; SAH, S-adenosylhomocysteine.
Significant difference (P < 0.05).
Metabolomic analysis of sera from vitamin B12-deficient and control rats.
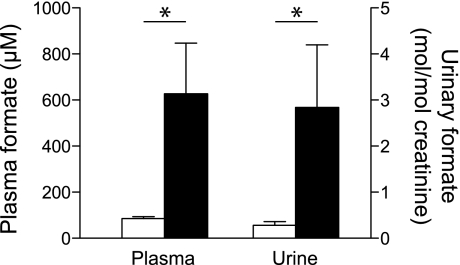
The 1H-NMR metabolomic analysis identified three metabolites that were significantly lower and two that were significantly elevated in the vitamin B12-deficient rats compared with the controls (Table 2). The concentrations of three ketone bodies were significantly lower in the deficient rats. This observation might be due to the sequestration of some of the hepatic coenzyme A pool as methylmalonyl-CoA, which may impair fatty acid oxidation or ketogenesis. We also expected to find increased Hcy, but this metabolite was not detected by NMR. This is probably due to the fact that Hcy tends to form a variety of disulfides not included in the metabolomics library and that it also binds to proteins that are removed by the deproteinization step. Nevertheless, when measured using a specific assay, Hcy was markedly higher in the serum of the deficient rats (Table 1), confirming the vitamin B12 deficiency. The metabolomic analysis showed that serum formate was approximately sixfold elevated in the vitamin B12-deficient rats. We confirmed the increased formate in the deficient animals by means of a specific enzyme assay; this showed an approximately sevenfold increase in formate in the serum of the vitamin B12-deficient rats (Fig. 1). We also measured urinary formate using 1H-NMR. We found that urinary formate was seven- to 10-fold more concentrated than in serum. When normalized to creatinine excretion, urinary formate excretion was ∼10-fold elevated in the vitamin B12-deficient rats compared with the controls (Fig. 1).
Table 2.
Metabolites displaying more or less than twice the control concentration in the serum of B12-deficient rats, as measured by 1H-NMR metabolomic analysis
| Concentration, μM |
|||
|---|---|---|---|
| Metabolite | Control | Deficient | Fold Change |
| Methylmalonate | ND | 84.5 | ∞ |
| Formate | 64.3 | 401.9 | 6.25 |
| Acetoacetate | 82.9 | 33.8 | 0.41 |
| 3-Hydroxybutyrate | 289.9 | 99.3 | 0.34 |
| Acetone | 29.7 | 7.3 | 0.25 |
ND, not detectable.
Fig. 1.
Plasma and urinary formate in control (open bars) and vitamin B12-deficient rats (black bars). Each bar is the mean ± SD; n = 6. *Significant difference (P < 0.05).
The origin of formate during vitamin B12 deficiency.
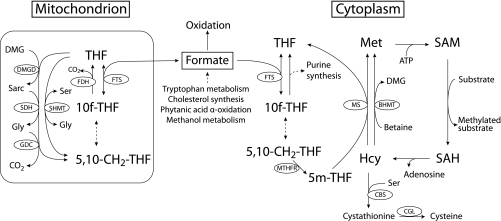
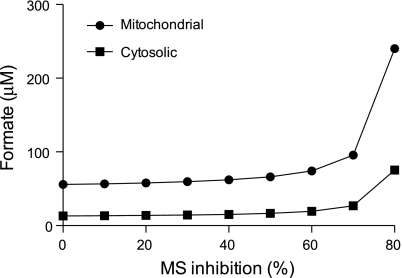
The finding that formate is elevated in the vitamin B12-deficient animals is of considerable interest. Formate is normally incorporated into the folate one-carbon pool as 10-formyl-THF (Fig. 2) by the action of 10-formyl-THF synthetase. 10-Formyl-THF provides formyl groups for purine synthesis. Some 10-formyl-THF may also be reduced to 5-methyl-THF by the successive actions of 5,10-methylenetetrahydrofolate cyclohydrolase, 5,10-methylenetetrahydrofolate dehydrogenase, and methylenetetrahydrofolate reductase. We examined the effect of decreased MS activity by means of the ISM mathematical model of folate metabolism. This model predicted that a decrease in the velocity of MS would increase formate concentration in both the mitochondrial and cytoplasmic compartments. At 80% inhibition of MS, the formate concentrations were predicted to increase by 476 and 330% in the cytosol and mitochondria, respectively (Fig. 3). The model also predicted that the cytosolic concentration of 5-methyl-THF would increase to 126% of the normal value, whereas the THF concentration would decrease to 15 and 90% of normal in the cytosol and mitochondria, respectively. These model predictions suggest that there may be two mutually nonexclusive mechanisms whereby vitamin B12 deficiency causes elevated formate. On the one hand, decreased cytosolic [THF] brought about via the methyl trap would decrease the assimilation of formate into the folate one-carbon pool. Secondly, one would expect that such 10-formyl-THF, as would be produced, would not be efficiently reduced to 5-methyl-THF and used in remethylation due to the decreased activity of methionine synthase.
Fig. 2.
Production and metabolism of formate. THF, tetrahydrofolate; BHMT, betaine-homocysteine S-methyltransferase; CBS, cystathionine-β-synthase; CGL, cystathionine-γ-lyase; DMG, dimethylglycine; DMGD, dimethylglycine dehydrogenase; FDH, 10-formyltetrahydrofolate dehydrogenase; FTS, 10-formyltetrahydrofolate synthase; GDC, glycine decarboxylase; MS, methionine synthase; MTHFR, methylenetetrahydrofolate reductase; SDH, sarcosine dehydrogenase; SHMT, serine hydroxymethyltransferase.
Fig. 3.
Simulation, via the InSilicoMetabolism (ISM) model of one-carbon metabolism, of the effects of decreasing methionine synthase activity on formate concentrations.
Formate accumulation during folate deficiency.
The accumulation of formate in vitamin B12-deficient rats suggested that this would also occur in folate deficiency; indeed, urinary formate is known to increase in folate-deficient rats (26). Table 3 provides data from rats made folate deficient for 4 wk. Plasma, brain, and liver folate concentrations were decreased significantly. Interestingly, brain folate, although decreased, was relatively protected compared with that in plasma and liver. SAM was also decreased significantly, and SAH was increased in the brains of the folate-deficient rats; the SAM/SAH ratio was decreased significantly. In the liver, there was a very marked decrease in SAM, a doubling of SAH levels, and a very large decrease in the SAM/SAH ratio, consistent with what has been found previously (2). The decreased SAM/SAH ratios in the brains and livers of folate-deficient animals are consistent with impaired remethylation. Plasma total Hcy(tHcy) was increased almost 10-fold compared with that of control animals (Table 3).
Table 3.
Folate and related metabolites in serum, urine, brain, and liver of folate-deficient rats
| Control | Deficient | P Value | |
|---|---|---|---|
| Plasma | |||
| Folate, ng/ml | 32.32 ± 3.33 | <4.0 | <0.001 |
| Hcy, μM | 2.05 ± 0.38 | 19.47 ± 3.53* | <0.001 |
| Formate, μM | 61.66 ± 9.64 | 346.33 ± 95.09* | <0.001 |
| Urine | |||
| Formate, mol/mol creatinine | 0.55 ± 0.32 | 5.82 ± 1.18* | <0.001 |
| Brain | |||
| Folate, ng/g | 0.124 ± 0.018 | 0.073 ± 0.012* | <0.001 |
| B12, ng/g | 41.2 ± 4.18 | 35.1 ± 3.35* | 0.019 |
| SAM, nmol/g | 33.69 ± 2.86 | 29.84 ± 3.23 | 0.054 |
| SAH, nmol/g | 0.9 ± 0.13 | 1.82 ± 0.24* | <0.001 |
| SAM/SAH | 37.76 ± 3.58 | 16.5 ± 2.31* | <0.001 |
| Liver | |||
| Folate, ng/g | 6.928 ± 0.238 | 0.748 ± 0.039* | <0.001 |
| B12, ng/g | 28.8 ± 3.4 | 32.36 ± 3.57 | 0.107 |
| SAM, nmol/g | 82.46 ± 15.25 | 23.99 ± 2.95* | <0.001 |
| SAH, nmol/g | 10.41 ± 3.11 | 36.64 ± 14.26* | <0.001 |
| SAM/SAH | 8.36 ± 2.5 | 0.73 ± 0.25* | <0.001 |
Data are given as means ± SD (n = 6).
Significant difference (P < 0.05).
We confirmed the 1958 finding that urinary formate is increased in folate-deficient rats (26) and extend this finding to plasma formate. To our knowledge, this is the first time that elevated plasma formate has been found in folate-deficient rats.
Is the concentration of formate altered during vitamin B6 deficiency?
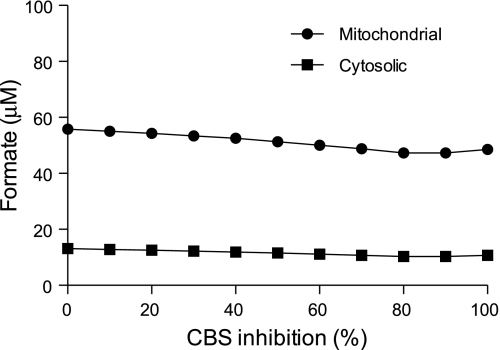
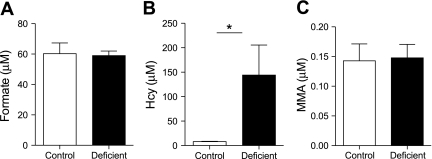
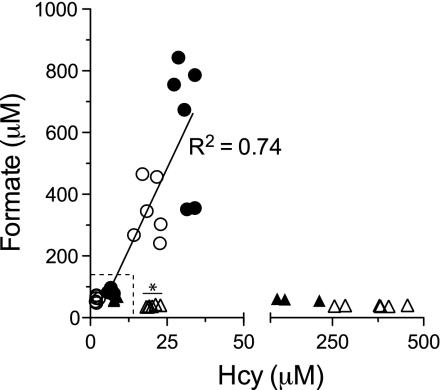
In addition to deficiencies of folate and cobalamin, a deficiency of pyridoxal also increases tHcy; this is particularly evident after a methionine load (30). This is due to an impairment in the conversion of Hcy to cysteine via the transsulfuration pathway, since the two enzymes of this pathway employ pyridoxal 5′-phosphate as cofactors. Therefore, we determined whether pyridoxal deficiency would affect formate levels. We first used the ISM mathematical model to simulate the effects of an impaired transsulfuration pathway. Decreasing CBS activity predicted a progressive increase in Hcy concentration, beginning when CBS is <50% of normal; however, no changes in formate concentrations (either mitochondrial or cytosolic) were predicted (Fig. 4). To address this issue experimentally, we fed rats a vitamin B6-deficient diet for 6 wk. To achieve a broad range of Hcy concentrations, we gave a methionine load to some of the vitamin B6-deficient rats (n = 6); we also gave a methionine load to vitamin B6-replete rats. The vitamin B6-deficient rats had plasma PLP concentrations only 3.4% that of rats fed the control diet (15.7 ± 4.8 vs. 458 ± 98 nmol/l, P < 0.001) and plasma pyridoxal concentrations 8.1% that of the control animals (24 ± 7.6 vs. 289 ± 52 nmol/l, P < 0.001). The deficient animals had plasma Hcy concentrations that were ∼18-fold elevated compared with the controls, and these were further doubled by the methionine load. The methionine load increased Hcy ∼2.5-fold in the replete animals. Figure 5A gives the results from the nonloaded vitamin B6-replete and vitamin B6-deficient rats. Vitamin B6 deficiency was without an effect on plasma formate or MMA (Fig. 5, A and C) despite the marked increase in Hcy (Fig. 5B). The methionine load increased Hcy in both the vitamin B6-replete and -deficient rats, without any effect on formate (Fig. 6). Thus, blood and urinary formate concentrations are elevated in both folate-deficient and vitamin B12-deficient rats, but not during vitamin B6 deficiency.
Fig. 4.
Simulation, via the ISM model of one-carbon metabolism, of the effects of decreasing CBS activity on formate concentrations.
Fig. 5.
Formate (A), homocysteine (Hcy; B), and methylmalonic acid (MMA; C) in plasma of rats fed a vitamin B6-deficient diet for 4 wk compared with rats fed a vitamin B6-replete diet. Data are means + SD; n = 3. *Significant difference (P < 0.05).
Fig. 6.
Plasma formate concentration in relation to Hcy in rats fed the vitamin B12- (■), folate- (□), and vitamin B6-deficient diets, with (△) and without (▲) methionine loading. Data points in the dotted box are control rats for the three diets. *Vitamin B6-replete rats given a methionine load.
Is elevated formate as sensitive as elevated Hcy to detect folate deficiency?
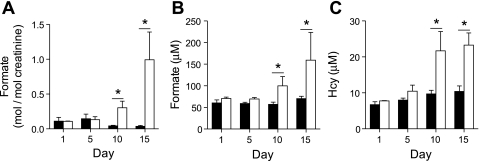
Our experiments suggest that formate may be a useful biomarker for the detection of defective remethylation. Therefore, it was of interest to compare its accumulation to that of Hcy. We did this by feeding rats a folate-deficient diet for ≤15 days. Urinary and plasma formate concentration increased as the deficiency progressed, becoming significantly different from control from day 10 onward (Fig. 7, A and B). The plasma concentration of Hcy also increased in the deficient animals and was significantly different from control from day 10 onward (Fig. 7C). Thus, plasma formate concentration and urinary formate excretion are equally sensitive indicators of folate deficiency, as is plasma Hcy.
Fig. 7.
Time course of formate excretion in urine (normalized to creatinine; A), plasma formate (B), and plasma Hcy (C) in rats fed a folate-deficient (open bars) or control diet (black bars). The rats were placed on the diet at ≈70 g of body wt. Each data point represents the mean ± SD; n = 3. *Significant difference between control and deficient diet (P < 0.05).
DISCUSSION
The principal finding of this study is that formate levels in plasma or urine can be used to discriminate between defects in one-carbon metabolism that affect remethylation (both Hcy and formate are elevated) and transsulfuration (Hcy is elevated, but formate is unchanged). Furthermore, if MMA is also measured, it is possible to discriminate between defective remethylation due to folate and vitamin B12 deficiency (Table 4). The accumulation of formate recalls the impaired incorporation of [14C]formate into methionine by cultured fibroblasts that is used as a clinical diagnostic of remethylation defects (9).
Table 4.
Formate, Hcy, and MMA levels permit discrimination between metabolic defects in the transsulfuration and remethylation pathways, including discrimination between defects brought about by folate or vitamin B12 deficiencies
| Pathway | Metabolite |
||
|---|---|---|---|
| Hcy | Formate | MMA | |
| Transsulfuration | + | − | − |
| Remethylation (folate deficiency) | + | + | − |
| Remethylation (B12 deficiency) | + | + | + |
+ and −, Concentration above and within normal values, respectively.
Plasma and urinary formate concentrations increase during vitamin B12 deficiency. Such formate accumulation is also observed during vitamin B12 inactivation using N2O (7). Formate, as an indicator of impaired one-carbon metabolism, has not been exploited, in contrast with the many studies on Hcy. However, we suggest that formate analysis may provide a unique insight into the mechanisms of hyperhomocysteinemia, as examined in large population studies such as the Hordaland study (27), in specific clinical situations, as in patients with end-stage renal disease (29) and those who have suffered a previous cardiovascular event (23). In addition, we show that increased formate in either urine or plasma is as sensitive as increased plasma Hcy levels in identifying impairments of one-carbon metabolism. Analysis of urinary formate may be particularly useful in situations (e.g., in neonates) where blood sampling needs to be kept to a minimum. We suggest that measurement of formate may also be useful for the detection of defects in formate assimilation into the one-carbon pool, such as those caused by a defect in 10-formyl-THF synthetase. In this situation, one would anticipate elevated formate but would not expect any change in Hcy; indeed, when the velocity of the cytosolic 10-formyl-THF synthetase is decreased, the ISM model predicts an increase in formate concentration with no change in Hcy (data not shown). We suggest that formate analysis should be included as a uniquely informative biomarker in the investigation of impairments of remethylation and transsulfuration pathways.
Metabolic origin of formate.
Our knowledge of formate metabolism is fairly rudimentary. The relationship between formate and folate metabolism was first noted by Plaut et al. (25) in 1950. Formate may arise from both mitochondrial and cytosolic reactions. Tibbetts and Appling (37) have shown that mitochondrial 5,10-methylene-THF may be oxidized to 10-formyl-THF, from which formate may be produced via the reversible formyltetrahydrofolate synthase (FTS; Fig. 2). 5,10-Methylene-THF may be produced in mitochondria from the metabolism of dimethylglycine (which arises during choline metabolism), sarcosine (which arises both from choline and methionine metabolism), glycine (via the glycine cleavage enzyme), and serine (via serine-hydroxymethyltransferase). Mitochondrial formate, once formed by FTS, is then released to the cytosol (3). Formate may be produced in the cytosol during the catabolism of tryptophan (20). In the cytoplasm, formate is produced during the recycling of methylthioadenosine, which is produced during polyamine biosynthesis, and also as a result of the oxidation of formaldehyde generated during cytochrome P450-catalyzed N- and O-demethylation reactions (15). Of course formate is produced by the oxidation of methanol (via the combined action of alcohol dehydrogenase and acetaldehyde dehydrogenase), whether taken exogenously or arising endogenously [methanol is present in human blood at a concentration of ≈1 mg/l (24)]. The metabolic acidosis resulting from methanol poisoning is caused by the accumulation of formic acid (formate plus hydrogen ions) (17). Finally, formate is also produced in the endoplasmic reticulum during cholesterol synthesis (during the conversion of lanosterol to cholesterol) (28) and in peroxisomes during the α-oxidation of phytanic acid (39) and 2-hydroxy fatty acids (8). We are unaware of any study that has attempted to quantify the different sources of formate. Similarly, we are aware of only one study of whole body formate kinetics; this reported an entry rate of formate into blood plasma in sheep of ∼4.6 mg (=100 μmol)·kg−1·h−1 (1).
Our knowledge of formate catabolism in higher vertebrates is also limited. It appears that the major catabolic pathway is oxidation to CO2 via folate-mediated one-carbon metabolism catalyzed by 10-FTS dehydrogenase. This pathway is distinct from other folate-dependent pathways in that the one-carbon unit is not used for biosynthetic purposes but instead represents an escape of 1-C units as CO2 (36). Bacteria, yeasts, and plants possess an enzyme (formate dehydrogenase) that can directly oxidize formate to CO2, but this enzyme is not found in animals (36). Formate has also been reported to be catabolized by catalase (5).
Possible toxicity of formate.
Could elevated formate exert pathological effects? During methanol poisoning, the toxicity has been attributed to the acidosis rather than to formate. Recently, 1 mM formate has been shown to increase the rate of cell death in rat hippocampal slices cultured for 72 h. This effect was greatly diminished by the addition of folic acid to the culture medium (14). Finally, formate is an inhibitor of cytochrome c oxidase (20, 21); however, the concentrations required for inhibition of this key enzyme are very high. We suggest that further work on possible pathological actions of formate is warranted.
Formate and lipid metabolism.
As shown in Fig. 2, cholesterol synthesis can give rise to formate. Therefore, it is possible that statins, which affect cholesterol synthesis and are currently used by more than 25 million individuals worldwide, may reduce formate levels. However, there is at present no information on in vivo formate kinetics that would permit us to determine the contribution of cholesterol synthesis to formate. Stover and Field (35) have suggested that formate derived from the mitochondria may be a major source of one-carbon units. Since formyl-THF may be reduced to methyl-THF, and this methyl group may ultimately be incorporated into SAM, impaired assimilation of formate may ultimately affect methylation reactions, including the methylation of phosphatidylethanolamine to phosphatidylcholine, catalyzed by phosphatidylethanolamine methyltransferase.
Comparison of the ISM model and the animal data.
The ISM model of one-carbon metabolism accurately predicts the effects of simulated vitamin B12 and B6 deficiencies on formate concentration. However, it predicts a decrease of formate levels upon folate depletion, whereas formate actually increased. We attribute this discrepancy between the model and the experimental situation to the fact that the model's source of formate is restricted to mitochondrial, folate-dependent sources. This discrepancy may indicate that the extramitochondrial sources of formate may be significant.
GRANTS
The development of the software was funded by National Cancer Institute Grant RO1-CA-105437 (principal investigator: C. Ulrich) and National Science Foundation Grant DM-S0109872 (principal investigator: M. Reed). This project was funded by Canadian Institutes of Health Research (CIHR) Grants to J. T. Brosnan and M. E. Brosnan (MOP-97851) and to B. D. Sykes (MOP-37769). The Canadian National High Field NMR Center is funded by CIHR, the Natural Science and Engineering Research Council of Canada, and the University of Alberta. S. G. Lamarre received a postdoctoral fellowship from the CIHR Regional Partnership Program. S. N. Reinke was funded by an Alberta Heritage Foundation for Medical Research Full-Time Studentship Award.
DISCLOSURES
No conflicts of interest, financial or otherwise, are declared by the authors.
AUTHOR CONTRIBUTIONS
S.G.L., M.E.B., and J.T.B. did the conception and design of the research; S.G.L., A.M.M., S.N.R., and B.D.S. performed the experiments; S.G.L., A.M.M., S.N.R., B.D.S., M.E.B., and J.T.B. analyzed the data; S.G.L., M.E.B., and J.T.B. interpreted the results of the experiments; S.G.L. prepared the figures; S.G.L. drafted the manuscript; S.G.L., M.E.B., and J.T.B. edited and revised the manuscript; S.G.L., A.M.M., S.N.R., B.D.S., M.E.B., and J.T.B. approved the final version of the manuscript.
ACKNOWLEDGMENTS
We thank Dr. Céline Schneider for assistance with the 1H-NMR analysis of urinary formate as well as Kathy Clow and Benoit Phelan for technical assistance and animal husbandry, respectively. The Insilico model was developed by Dr. Cornelia Ulrich of the Fred Hutchinson Cancer Research Center, Dr. Fred Nijhout, and Dr. Mike Reed of Duke University.
REFERENCES
- 1. Annison EF, White RR. Formate metabolism in sheep. Biochem J 84: 552–557, 1962 [DOI] [PMC free article] [PubMed] [Google Scholar]
- 2. Balaghi M, Horne DW, Wagner C. Hepatic one-carbon metabolism in early folate deficiency in rats. Biochem J 291: 145–149, 1993 [DOI] [PMC free article] [PubMed] [Google Scholar]
- 3. Barlowe CK, Appling DR. In vitro evidence for the involvement of mitochondrial folate metabolism in the supply of cytoplasmic one-carbon units. Biofactors 1: 171–176, 1988 [PubMed] [Google Scholar]
- 4. Bills ND, Koury MJ, Clifford AJ, Dessypris EN. Ineffective hematopoiesis in folate-deficient mice. Blood 79: 2273–2280, 1992 [PubMed] [Google Scholar]
- 5. Chance B. The primary and secondary compounds of catalase and methyl or ethyl hydrogen peroxide; reactions with hydrogen peroxide. J Biol Chem 180: 947–959, 1949 [PubMed] [Google Scholar]
- 6. Choi SW, Friso S, Ghandour H, Bagley PJ, Selhub J, Mason JB. Vitamin B-12 deficiency induces anomalies of base substitution and methylation in the DNA of rat colonic epithelium. J Nutr 134: 750–755, 2004 [DOI] [PubMed] [Google Scholar]
- 7. Deacon R, Perry J, Lumb M, Chanarin I. Formate metabolism in the cobalamin-inactivated rat. Br J Haematol 74: 354–359, 1990 [DOI] [PubMed] [Google Scholar]
- 8. Foulon V, Sniekers M, Huysmans E, Asselberghs S, Mahieu V, Mannaerts GP, Van Veldhoven PP, Casteels M. Breakdown of 2-hydroxylated straight chain fatty acids via peroxisomal 2-hydroxyphytanoyl-CoA lyase: a revised pathway for the alpha-oxidation of straight chain fatty acids. J Biol Chem 280: 9802–9812, 2005 [DOI] [PubMed] [Google Scholar]
- 9. Fowler B, Jakobs C. Post- and prenatal diagnostic methods for the homocystinurias. Eur J Pediatr 157, Suppl 2: S88–S93, 1998 [DOI] [PubMed] [Google Scholar]
- 10. Grady S, Osterloh J. Improved enzymic assay for serum formate with colorimetric endpoint. J Anal Toxicol 10: 1–5, 1986 [DOI] [PubMed] [Google Scholar]
- 11. Hempen C, Wanschers H, van der Sluijs Veer G. A fast liquid chromatographic tandem mass spectrometric method for the simultaneous determination of total homocysteine and methylmalonic acid. Anal Bioanal Chem 391: 263–270, 2008 [DOI] [PubMed] [Google Scholar]
- 12. Herbert V, Zalusky R. Interrelations of vitamin B12 and folic acid metabolism: folic acid clearance studies. J Clin Invest 41: 1263–1276, 1962 [DOI] [PMC free article] [PubMed] [Google Scholar]
- 13. Jacobs RL, Stead LM, Brosnan ME, Brosnan JT. Hyperglucagonemia in rats results in decreased plasma homocysteine and increased flux through the transsulfuration pathway in liver. J Biol Chem 276: 43740–43747, 2001 [DOI] [PubMed] [Google Scholar]
- 14. Kapur BM, Vandenbroucke AC, Adamchik Y, Lehotay DC, Carlen PL. Formic acid, a novel metabolite of chronic ethanol abuse, causes neurotoxicity, which is prevented by folic acid. Alcohol Clin Exp Res 31: 2114–2120, 2007 [DOI] [PubMed] [Google Scholar]
- 15. Keefer LK, Streeter AJ, Leung LY, Perry WC, Hu HS, Baillie TA. Pharmacokinetic and deuterium isotope effect studies on the metabolism of formaldehyde and formate to carbon dioxide in rats in vivo. Drug Metab Dispos 15: 300–304, 1987 [PubMed] [Google Scholar]
- 16. Kimura M, Kanehira K, Yokoi K. Highly sensitive and simple liquid chromatographic determination in plasma of B6 vitamers, especially pyridoxal 5′-phosphate. J Chromatogr A 722: 295–301, 1996 [DOI] [PubMed] [Google Scholar]
- 17. McMartin KE, Makar AB, Martin G, Palese M, Tephly TR. Methanol poisoning. I. The role of formic acid in the development of metabolic acidosis in the monkey and the reversal by 4-methylpyrazole. Biochem Med 13: 319–333, 1975 [DOI] [PubMed] [Google Scholar]
- 18. Miller JW, Nadeau MR, Smith D, Selhub J. Vitamin B-6 deficiency vs folate deficiency: comparison of responses to methionine loading in rats. Am J Clin Nutr 59: 1033–1039, 1994 [DOI] [PubMed] [Google Scholar]
- 19. Molloy AM, Scott JM. Microbiological assay for serum, plasma, and red cell folate using cryopreserved, microtiter plate method. Methods Enzymol 281: 43–53, 1997 [DOI] [PubMed] [Google Scholar]
- 20. Nicholls P. The effect of formate on cytochrome aa3 and on electron transport in the intact respiratory chain. Biochim Biophys Acta 430: 13–29, 1976 [DOI] [PubMed] [Google Scholar]
- 21. Nicholls P. Formate as an inhibitor of cytochrome c oxidase. Biochem Biophys Res Commun 67: 610–616, 1975 [DOI] [PubMed] [Google Scholar]
- 22. Nijhout HF, Reed MC, Ulrich CM. Mathematical models of folate-mediated one-carbon metabolism. Vitam Horm 79: 45–82, 2008 [DOI] [PubMed] [Google Scholar]
- 23. Nygård O, Nordrehaug JE, Refsum H, Ueland PM, Farstad M, Vollset SE. Plasma homocysteine levels and mortality in patients with coronary artery disease. N Engl J Med 337: 230–236, 1997 [DOI] [PubMed] [Google Scholar]
- 24. Osterloh JD, D'Alessandro A, Chuwers P, Mogadeddi H, Kelly TJ. Serum concentrations of methanol after inhalation at 200 ppm. J Occup Environ Med 38: 571–576, 1996 [DOI] [PubMed] [Google Scholar]
- 25. Plaut GW, Betheil JJ, Lardy HA. The relationship of folic acid to formate metabolism in the rat. J Biol Chem 184: 795–805, 1950 [PubMed] [Google Scholar]
- 26. Rabinowitz JC, Tabor H. The urinary excretion of formic acid and formiminoglutamic acid in folic acid deficiency. J Biol Chem 233: 252–255, 1958 [PubMed] [Google Scholar]
- 27. Refsum H, Nurk E, Smith AD, Ueland PM, Gjesdal CG, Bjelland I, Tverdal A, Tell GS, Nygård O, Vollset SE. The Hordaland Homocysteine Study: a community-based study of homocysteine, its determinants, and associations with disease. J Nutr 136: 1731S–1740S, 2006 [DOI] [PubMed] [Google Scholar]
- 28. Risley J. Cholesterol biosynthesis: Lanosterol to cholesterol. J Chem Educ 79: 377–384, 2002 [Google Scholar]
- 29. Robinson K, Gupta A, Dennis V, Arheart K, Chaudhary D, Green R, Vigo P, Mayer EL, Selhub J, Kutner M, Jacobsen DW. Hyperhomocysteinemia confers an independent increased risk of atherosclerosis in end-stage renal disease and is closely linked to plasma folate and pyridoxine concentrations. Circulation 94: 2743–2748, 1996 [DOI] [PubMed] [Google Scholar]
- 30. Sardharwalla IB, Fowler B, Robins AJ, Komrower GM. Detection of heterozygotes for homocystinuria. Study of sulphur-containing amino acids in plasma and urine after l-methionine loading. Arch Dis Child 49: 553–559, 1974 [DOI] [PMC free article] [PubMed] [Google Scholar]
- 31. Scott JM. Folate and vitamin B12. Proc Nutr Soc 58: 441–448, 1999 [DOI] [PubMed] [Google Scholar]
- 32. Scott JM, Weir DG. The methyl folate trap. A physiological response in man to prevent methyl group deficiency in kwashiorkor (methionine deficiency) and an explanation for folic-acid induced exacerbation of subacute combined degeneration in pernicious anaemia. Lancet 2: 337–340, 1981 [DOI] [PubMed] [Google Scholar]
- 33. Stabler SP, Allen RH, Savage DG, Lindenbaum J. Clinical spectrum and diagnosis of cobalamin deficiency. Blood 76: 871–881, 1990 [PubMed] [Google Scholar]
- 34. Stabler SP, Marcell PD, Podell ER, Allen RH, Savage DG, Lindenbaum J. Elevation of total homocysteine in the serum of patients with cobalamin or folate deficiency detected by capillary gas chromatography-mass spectrometry. J Clin Invest 81: 466–474, 1988 [DOI] [PMC free article] [PubMed] [Google Scholar]
- 35. Stover PJ, Field MS. Trafficking of intracellular folates. Adv Nutr 2: 325–331, 2011 [DOI] [PMC free article] [PubMed] [Google Scholar]
- 36. Strickland KC, Holmes RS, Oleinik NV, Krupenko NI, Krupenko SA. Phylogeny and evolution of aldehyde dehydrogenase-homologous folate enzymes. Chem Biol Interact 191: 122–128, 2011 [DOI] [PMC free article] [PubMed] [Google Scholar]
- 37. Tibbetts AS, Appling DR. Compartmentalization of Mammalian folate-mediated one-carbon metabolism. Annu Rev Nutr 30: 57–81, 2010 [DOI] [PubMed] [Google Scholar]
- 38. Tiziani S, Emwas AH, Lodi A, Ludwig C, Bunce CM, Viant MR, Gunther UL. Optimized metabolite extraction from blood serum for 1H nuclear magnetic resonance spectroscopy. Anal Biochem 377: 16–23, 2008 [DOI] [PubMed] [Google Scholar]
- 39. Verhoeven NM, Schor DS, Previs SF, Brunengraber H, Jakobs C. Stable isotope studies of phytanic acid alpha-oxidation: in vivo production of formic acid. Eur J Pediatr 156, Suppl 1: S83–S87, 1997 [DOI] [PubMed] [Google Scholar]
- 40. Vester B, Rasmussen K. High performance liquid chromatography method for rapid and accurate determination of homocysteine in plasma and serum. Eur J Clin Chem Clin Biochem 29: 549–554, 1991 [DOI] [PubMed] [Google Scholar]
- 41. Weljie AM, Newton J, Mercier P, Carlson E, Slupsky CM. Targeted profiling: quantitative analysis of 1H NMR metabolomics data. Anal Chem 78: 4430–4442, 2006 [DOI] [PubMed] [Google Scholar]


