

Abstract
A hallmark of certain cardiac diseases such as familial hypertrophic cardiomyopathy is focal myofiber disarray. Regional ventricular dysfunction occurs in human subjects with hypertrophic cardiomyopathy; however, no direct evidence exists to correlate regional dysfunction with myofiber disarray. We used a transgenic mouse, which exhibits regional myofiber disarray via ventricular expression of the human oncogene ras, to investigate the relationship between myofiber disarray and septal surface strain. An isolated ejecting mouse heart preparation was used to record deformation of markers on the septal surface and to determine nonhomogeneous septal surface strain maps. Myofiber disarray made in histological tissue sections was correlated with gradients in surface systolic shortening. Significantly smaller maximum principal shortening was associated with disarray located near the right ventricle (RV) septal surface. There was also significantly smaller surface shear strain associated with disarray located either near the RV surface or at the midwall. Because surface shear is a local indicator of torsion, we conclude that myofiber disarray is associated with reduced septal torsion and reduced surface shortening.
Keywords: hypertrophic cardiomyopathy, fiber angle, surface strain, ventricular torsion
The characteristic organization of muscle fibers in ventricular myocardium is hierarchical and nonuniform (24, 27). The transmural distribution of fiber orientations generates ventricular torsion during systole and diastole (1), contributes to the development of substantial cross-fiber shortening and wall thickening (23), and is thought to distribute wall stress and sarcomere shortening more uniformly (2, 4). Disruption of this ordered arrangement of myofibers is likely to alter normal cardiac mechanical function.
Several cardiac diseases are associated with regional myofiber disorganization and disarray (31), including dilated cardiomyopathy and familial hypertrophic cardiomyopathy (5). Recently, tagged magnetic resonance (MR) imaging has been used to investigate ventricular mechanics in human hypertrophic cardiomyopathy. Betocchi et al. (3) observed hyperkinesia in the free wall and relatively normal wall motion in the septum, whereas Kramer et al. (15) found reduced circumferential myocardial segment shortening in the septum and some portions of the free wall. Young et al. (35) reported reduced circumferential and longitudinal strain in the septum and increased torsion of the left ventricle (LV) as a whole compared with normal, healthy subjects. Dong et al. (7) described reduced systolic wall thickening and reduced circumferential shortening in regions of abnormally thickened myocardium. These studies highlight the altered mechanical behavior of the myopathic heart, but MR tagging is presently limited in spatial resolution and regional dysfunction can only be related with gross structural abnormalities such as increased wall thickness. No direct relation could be made between regional dysfunction and the presence of local myofiber disarray.
Genetically engineered mouse models have been developed with similar genotypes to human hypertrophic cardiomyopathy (8, 30, 34) and with similar phenotypes (13). The model developed by Hunter et al. (13) expresses the human oncogene p21ras under control of the ventricle-specific MLC-2v promoter. The ras oncogene is implicated in the hypertrophy pathway, and cardiac expression of ras results in ventricular hypertrophy and causes focal myofiber disarray similar to human hypertrophic cardiomyopathy. Although the ras gene is not a known gene for familial hypertrophic cardiomyopathy and overexpression of ras is not considered a model of the human disease (13), the myofiber disarray in this mouse model is indistinguishable from that of hypertrophic cardiomyopathy in humans, and hence this may be a useful model for studying the effects of fiber disorganization on regional myocardial function.
The objective of this study was to investigate the relationship between regional myofiber disarray and impairment of regional ventricular contractile function. Our hypothesis was that disruption of the normal myofiber architecture would result in reduced regional systolic shortening and torsion. Regional strain was measured in isolated ejecting mouse hearts by imaging markers on the right ventricle (RV) septum (11, 22). Quantitative histological measurements of regional myofiber disarray were correlated with regional surface dysfunction. There was a strong relationship between measured strain gradients and myofiber disarray found in the septal wall, particularly the maximum principal strain and shear strain. The reduced shear strain indicates that disarray may interfere with the ability of the ventricle to twist during systole. These results may be applicable to human diseases such as hypertrophic cardiomyopathy in which fiber disarray is a prominent feature.
METHODS
Isolated ejecting heart preparation
All animals were used in compliance with the American Association for the Accreditation of Laboratory Animal Care and with approval of the University of California San Diego Animal Subjects Committee. An isolated ejecting mouse heart preparation similar to that used by Grupp et al. (9) was used to measure regional surface deformation. To verify the presence of a hypertrophic phenotype in the transgenic hearts (with cardiac-specific expression of ras), the hearts were imaged with transthoracic echocardiography (29), and only mice with significant increases in interventricular septal wall thickness [based on previously described criteria (29)] were used in the present study. Hearts from transgenic mice (n = 7) and age- and weight-matched control mice [National Institutes of Health (NIH) Swiss white, n = 7] were rapidly removed under ketamine-xylazine anesthesia and immediately plunged into an iced, hyperkalemic cardioplegic solution to arrest the hearts. Under a dissecting microscope, the aorta was cannulated using a flanged glass cannula 1.0 mm in diameter. The remaining tissue surrounding the aorta was tied closed using 5-0 suture to seal all vasculature to the heart. The heart was mounted on a retrograde Langendorff perfusion apparatus (Radnoti), and a small outlet was cut into the RV. Perfusion was initiated using a modified Krebs-Henseleit solution (KHS), containing (in mmol/l) 118 NaCl, 4.7 KCl, 1.2 MgS04, 25.0 NaHCO3, 1.2 KH2PO4, 2.5 CaCl2, 5.5 dextrose, and 0.5 Na2-EDTA, recommended by Grupp et al. (9). Additionally 30 mmol butanedione monoxime (BDM) was added to prevent the heart from contracting and protect against additional cutting injury (26). The buffer was constantly bubbled with a 95% O2-5% CO2 gas mixture and maintained at a pressure between 70 and 80 mmHg during retrograde perfusion. The RV free wall was removed. To apply an array of surface markers to the septum, titanium dioxide powder (Sigma) was mixed with water to form a thin liquid paste, and a small paint brush with short bristles was dipped in the paste. The paste was allowed to dry on the brush, and then the markers were applied to the surface of the moist heart by flicking the paint brush against a fingertip. Application could be repeated until a uniform distribution of markers was applied. Nonadherent markers were washed away when the heart was submerged in warm buffer solution. The marker diameter ranged from 0.01 to 0.05 mm, with an average intermarker spacing of ~0.13–0.16 mm. Figure 1 shows a schematic of the ejecting heart apparatus, and Fig. 2 shows an image of a heart with the titanium dioxide markers.
Fig. 1.
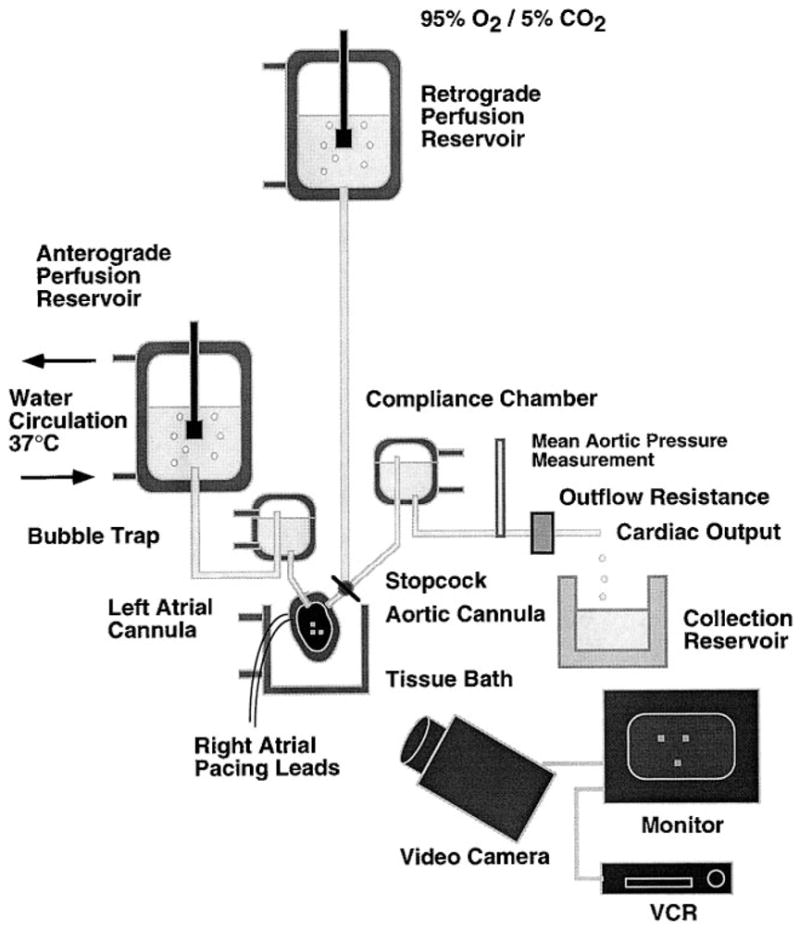
Schematic of ejecting heart apparatus.
Fig. 2.
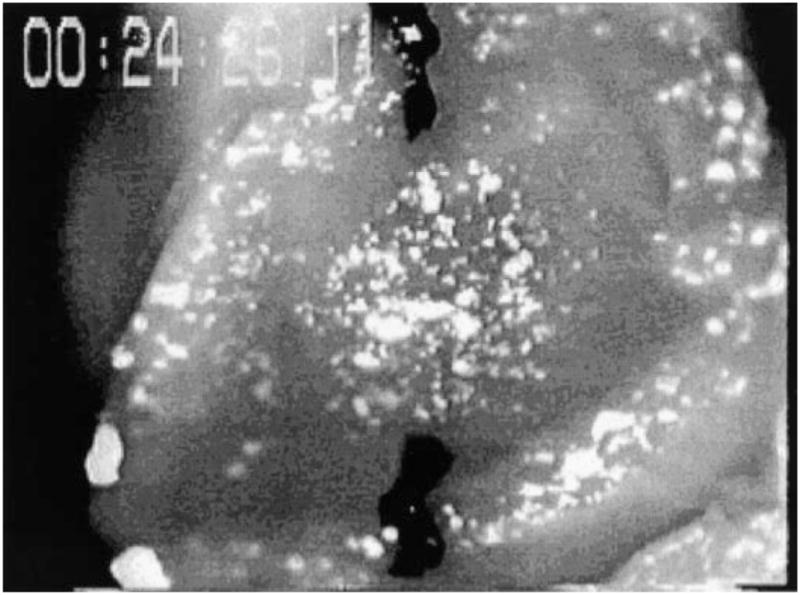
Sample video frame showing transgenic heart with septum removed and titanium dioxide marker array applied to right ventricle septal surface. Black sutures are used to determine local 2-dimensional cardiac coordinate system.
A 1.5-mm glass cannula was inserted into the RV and tied using 5-0 suture. Anterograde perfusion was initiated using KHS without BDM at ~15 mmHg. After the BDM was washed out, the heart began to contract spontaneously. The heart contracted against a resistive-compliant network consisting of a chamber with an air bubble and a flexible tube with an adjustable clamp. The heart was kept immersed in warm (37°C) KHS throughout the experiment except when marker deformation was being videotaped. The pressure in the aortic outflow line was monitored using a transducer (Millar Instruments, Houston, TX). Stainless steel wires were placed on the right atrium to pace the heart at 360 beats/min. After a 15-min equilibration period, marker displacements were recorded to videotape using an analog charged coupled device (CCD) camera (COHU). The video sync signal was digitized along with the pressure, stimulation sync signal, and a data acquisition signal, which was used to synchronize digitized signals with video signals.
Nonhomogeneous strain analysis
Video frames were captured using a Macintosh Q950 computer with video capture board (Radius) using Adobe Premiere software and split into video fields to increase temporal resolution to 60 Hz at the expense of spatial resolution (640 × 240 pixels/field), using NIH Image software. The average marker diameter was 2–4 pixels (0.02–0.04 mm). The average scale magnification was 80–90 pixels/mm, and thus the spatial resolution of the centroid of a marker would be ~0.01 mm. Three markers were digitized (using NIH Image software) through several heart cycles, and homogeneous strain was calculated using the displacements of these markers (21). The field nearest end diastole was selected for use as a reference field, and the field nearest end systole was selected to compute systolic strains.
For nonhomogeneous strain calculation, between 80 and 150 markers were digitized in the end-diastolic and end-systolic fields. A single bicubic Hermite finite element was defined to surround the markers, and a least-squares finite element fit of the marker displacements was used to estimate the nonhomogeneous strain field within the element as described previously (11, 32). Validation of the method has been performed recently (18). Strains (a quantitative measure of deformation) were computed with respect to principal and cardiac axes. The cardiac coordinate system was defined with a line drawn between the apex and base as the longitudinal axis (X2 direction), and a circumferential axis was defined perpendicular to the longitudinal axis (X1 direction). Strain components in this coordinate system are E11, circumferential; E22, longitudinal; and E12, circumferential-longitudinal shear. The first principal value of the two-dimensional strain (maximum shortening) is denoted as E1, and the second principal strain is orthogonal to the first. When noted as %strain, the principal strain is given as the percent change in segment length in the principal direction.
Sensitivity of strain analysis: needle injury
To determine the sensitivity of the nonhomogeneous strain analysis to localized regional dysfunction, a group of normal hearts were locally injured by insertion of a 25-gauge needle through the septal wall. India ink was injected through the needle to mark the injured area and remained visible after histological processing of the tissue. After 1 h of continued perfusion, the heart tissue was stained using triphenyltetrazolium chloride (TTC), which stains viable myocardium deep red, leaving necrotic tissue unstained (6, 17).
Quantitative histology
Each heart was immersion fixed using Telly’s fluid (formaldehyde-glacial acetic acid-ethanol fixative) for at least 24 h. The apex and base were removed and the LV was infiltrated using JB-4 glycol methacrylate resin for at least 48 h. Tissue was embedded using fresh JB-4 and sectioned using an automatic microtome (LKB) at 10 μm, through the septal wall in the plane tangent to the RV septal wall. The hearts were carefully mounted on blocks to cut sections tangent to the area of the septum where surface marker deformation was recorded.
Nine sections were chosen to span the septal wall evenly. Images of each whole section were taken with a ×2 microscope objective on a Nikon Diaphot upright microscope, using a Sony CCD camera (model DXC-151) and Macintosh Q900 computer with capture board (Data Translation) and NIH Image software. The surface section (closest to the RV) was hand registered to the diastolic video image, allowing for scaling, two-dimensional rotation, and translation. Sutures tied to the RV flaps and the cut edges of the RV were used as fiducial landmarks. The same scale factor was applied to the remaining eight tissue sections, and these sections were automatically registered to the surface section using an image similarity criterion suggested by Vernot et al. (33) allowing only two-dimensional rotation and translation.
Once registered to the video images, four higher magnification (×10) images were taken in each of the nine sections to span the area where septal surface marker deformation was recorded. These images were analyzed using an automated fiber orientation technique described previously (14). This method determines the local mean fiber orientation and standard deviation of fiber angle (local dispersion) in small subregions of tissue (~20 X 20 pixels = ~0.01 mm2). Thus in each tissue section (2 × 2 mm) there are roughly 400–500 of these subregions in which local fiber orientation and standard deviation were measured for comparison with surface strain measurements. Sample images of normal and disarrayed tissue are shown in Fig. 3, together with histograms of regional fiber angle dispersion (standard deviations) in the small subregions. Such histograms together with our previous results in this mouse model of disarray (14) indicate that when local angular dispersion is greater than 20°, these areas were found to correspond well with areas of myofiber disarray. Hence we define subregions at any wall depth with a local angular dispersion of ≥20° as disarrayed regions. Tissue landmarks such as small blood vessels were used to relate measurements made in the higher magnification images to the lower magnification images. Distance between landmarks at each magnification were used to transform locations of angular measurements made at higher magnification.
Fig. 3.

Sample tissue section from normal (A) and ras transgenic heart (B) showing local fiber disarray in transgenic hearts. After automated fiber angle procedure is applied to each section, histograms of fiber angle dispersion show that in normal tissue, dispersion is < 15° in all locations. In transgenic hearts there is wider range of fiber dispersion, and as expected, some tissue without disarray (local deviation <20°).
Correlation and relation of strain with histology
Strains were computed at uniformly spaced locations throughout the finite element. Fiber orientation and angular dispersion were found at the same in-plane locations (at each of 9 wall depths) by averaging measurements surrounding the location of interest. The fraction of wall thickness that contained disarray was determined by adding the number of sections affected by disarray (with local fiber standard deviation greater than 20° at each planar location) and dividing by the total number of sections. The spatial correspondence among surface strain, fiber, and disarray measurements allowed calculation of correlation coefficients and paired comparison testing.
Correlation coefficients were computed between strain components (in cardiac and principal coordinates) and fiber orientation standard deviation (angular dispersion) at each wall depth to determine spatial relationship between angular dispersion and dysfunction (25). Average surface strains were computed for areas overlying disarrayed and normal tissue found near the RV surface, midwall, and LV surface. The average surface strain components were then compared using a two-way repeated measured ANOVA (SuperANOVA, Abacus Concepts) with post hoc comparisons (Tukey-Kramer) performed when significance was found. Values less than 0.05 were considered significant. Similar analysis was performed comparing percentage of wall thickness affected by disarray and surface strain components.
RESULTS
Global hemodynamics and surface strain
Table 1 summarizes hemodynamic and global average strain measurements for both control and transgenic mice. There were no statistical differences in cardiac output or mean aortic pressure between control and transgenic groups. There were no statistical differences in principal strain components, but there was a significantly reduced shear (El2) in transgenic animals compared with controls (P < 0.05). There was also a significant increase in the standard deviation of the principal strain (E1) in transgenic animals compared with controls (P< 0.05), indicative of increased regional heterogeneity of function.
Table 1.
Hemodynamics and global average strains
| Control | Needle | ras | |
|---|---|---|---|
| Hemodynamics | |||
| n | 7 | 6 | 7 |
| Cardiac output, ml/min | 6.3±1.2 | 6.3±1.2 | 7.2± 1.5 |
| Coronary flow, ml/min | 4.8±0.8 | 4.8±0.8 | 5.9 ±0.9 |
| Aortic flow, ml/min | 1.5±0.3 | 1.5±0.3 | 1.3±0.6 |
| Mean pressure, mmHg | 38±4 | 38±5 | 41±4 |
| Strain | |||
| E11 | −0.0059±0.0136 | −0.0235±0.0122 | −0.0083±0.0133 |
| E22 | −0.0518±0.0320 | −0.0242±0.0222 | −0.0369±0.0355 |
| E12 | 0.0499±0.0100 | 0.0482±0.0298 | 0.0118±0.0304 |
| E1 | −0.0975±0.0319 | −0.0873±0.0312 | −0.0838±0.0297 |
| E2 | 0.0393±0.0143 | 0.0245±0.0287 | 0.0387±0.0320 |
| E1 SD | 0.0265±0.0102 | 0.0487±0.0189* | 0.0571±0.0259* |
Values are means ± SD. Strains are in cardiac (Eij) and principal (Ei) coordinates in control, needle-injured, and transgenic (ras) mice. E1 SD, standard deviation of maximum principal strain.
Significantly different from control, P<0.05.
Needle injury
Needle insertion caused a local area of injury to the myocardium as evidenced by failure to stain with TTC, ~0.25 mm2 in area. There was a clear area of reduced maximum principal strain associated with needle injury as shown in a sample strain map in Fig. 4A (E1, from the epicardium of a needle-injured heart). There were no differences between control and needle-injured hemodynamic or averaged strain values as indicated in Table 1. However, there was a significant increase in the standard deviation of E1 in needle-injured hearts compared with controls (P < 0.05), indicative of increased heterogeneity of regional strain.
Fig. 4.

A: sample contour plot of maximum principal strain, E1, from needle-injured heart. Needle injury creates clear area of reduced strain indicated by reduced contour values. B: sample contour plot of maximum principal strain from heart of a control mouse. Distribution of strain is uniform with strain magnitude ranging from ~0.08 to 0.12. C: sample contour plot of maximum principal strain from heart of ras transgenic mouse. Substantial heterogeneity of function is indicated by varied contour pattern.
Comparison of strain in control and transgenic groups
Control mice typically had a more uniform distribution of maximum principal strain, E1, as shown in Fig. 4B. The hearts of transgenic mice had increased heterogeneity of function, as indicated by the contour variability shown in Fig. 4C. Figure 5 shows plots of the two principal strains in control and transgenic hearts, with line segments indicating the magnitude and direction of the principal strain values. Longer line segments indicate greater strain magnitude. The orientation of the lines indicates the principal axes of the maximum and minimum principal strains, E1 and E2.
Fig. 5.

Sample plots of 2 principal strains and principal angles on septal surface of left ventricle. Line segment lengths indicate magnitude of principal strain pairs at each location and line segments are oriented along direction of principal strains. A: control heart. B: ras transgenic heart. Dashed box surrounds actual data points.
Correlation of fiber disarray and mechanical function
Figure 6A shows a map of the maximum principal strain from the heart of a ras transgenic mouse overlaid with fiber angle measurements taken from midwall section. Large circles indicate regions where angular dispersion was greater than 20° (disarrayed). The lengths of the line segments in the figure are proportional to the angular dispersion, with longer segments indicating greater dispersion. The figure shows the strain values, fiber orientation, and dispersion measured at the same locations. These values were used in the correlation analysis. Figure 6B shows a similar map of strain from a different transgenic mouse but overlaid with small circular marks indicating disarray contained in any one of the nine histological sections examined. Each circular mark indicates disarray found at one of the nine depths. A greater density of small circles indicates a greater percentage of the wall thickness was affected by disarray.
Fig. 6.
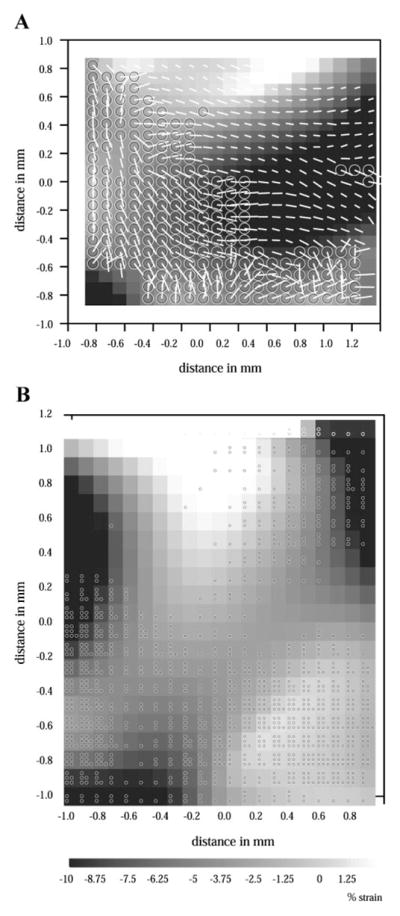
A: map of maximum principal strain overlaid with fiber angle measurements from near epicardium in ras transgenic mouse heart. Large circles indicate areas where local angular deviation is greater than 20°, indicating disarray. Strain magnitudes (gray scale) are given as percent change in segment length in direction of first principal strain. B: map of maximum principal strain overlaid with small circles indicating disarray found at each wall depth from ras transgenic mouse heart. Within each subregion, each circle corresponds to additional layer with disarray.
Positive correlation between maximum principal strain, E1, and angular dispersion was found for each of the nine histological sections. The positive correlation coefficient with E1 indicates a spatial relationship between increased angular dispersion and more positive E1 (reduced shortening). The correlation coefficient (0.45) was significantly greater at the septal surface (closest to the RV) compared with the other depths (P < 0.01), indicating a greater spatial relationship between disarray and dysfunction at the septal surface.
There was a significant reduction in average maximum principal strain, E1, associated with disarrayed tissue found near the septal surface (−0.076 ± 0.009 vs. −0.094 ± 0.008) but not at the midwall or near the LV surface. The reduced surface contractile function (smaller magnitude of average E1) was consistent with the greater correlation between E1 and angular dispersion at the surface. There was also a significant reduction in average surface shear strain, E12, associated with areas of disarrayed tissue near the RV surface or midwall, but not at the LV side of the septum.
There were trends in the principal and shear strains as functions of the percentage of the wall with disarray (Fig. 7). Thus because more of the underlying tissue contains myocyte disarray, the surface function becomes more abnormal. This trend was significant for the shear strain (P = 0.004) but not for the principal strain. For the shear strain, the typical positive shear seen during systole is completely diminished when 40–50% of the wall contains disarray, indicating substantial torsional dysfunction in these regions.
Fig. 7.

A: average RV septal surface E1 (maximum principal strain) associated with varying amounts of underlying wall disarray. B: average RV septal surface E12 (shear strain) associated with varying amounts of septal wall disarray. Very few regions contain >60% disarray, thus last bar is for 50–60% range.
DISCUSSION
Focal myofiber disarray in a transgenic mouse model with overexpression of ras caused significant increases in heterogeneity of regional function. Local surface shearing showed the greatest decrement, although reduced principal surface shortening correlated with areas of fiber disarray. Global function in terms of ventricular pressure and cardiac output were not altered in the hearts with myocyte disarray, and mean surface segment shortening also was not different. This result is consistent with previous findings of inhomogeneity of contractile function in human hypertrophic cardiomyopathy; these MR tagging studies in humans have indicated either normal or hyperkinetic overall function of the diseased heart (3, 7, 35). Thus the changes in overall systolic septal mechanics from these transgenic mice are modest, consisting mostly of reduced septal torsion, but regional variations in function correlate to the underlying structural abnormalities. The effect of disarray alone may be to reduce surface function because previous studies of systolic surface function in a hypertrophy-only model show substantial increases in surface strains (20).
There was a significant decrease in RV septal shear strain in transgenic mice compared with controls. Shear strain can be interpreted as a local indicator of ventricular torsion. The reduced shear in these animals suggests that disarray, which tends to concentrate in the septum, interferes with the ability of the myocardium to twist. Modeling studies on myocardial torsion have concluded that the normal transmural fiber angle distribution is responsible for the ability of the heart to twist (1, 28). The disruption of this ordered arrangement in a heart with focal disarray and the reduced RV septal shear are consistent with this conclusion. A MR study conducted by Young et al. (35) indicated an increase in global ventricular torsion in humans associated with hypertrophic cardiomyopathy. Our results indicate that disarray in the septal wall contributes to reduced torsion in the septum; however, we did not examine the LV free wall for evidence of increased torsion, which might compensate for reduced torsion of the septum.
We tested the sensitivity of our strain analysis system by examining the effect of injury created by needle insertion. Local needle injury caused a reduction in maximum principal strain and an increase in heterogeneity of strain. From video camera images, the reduction in contraction corresponded with the area of the needle insertion. Staining of the tissue using TTC indicated an area of ~0.25 mm2 of necrotic tissue surrounding the needle insertion point. Thus we conclude that our technique is capable of detecting local variations in contractile function occurring on a length scale on the order of 0.25 mm.
Consistent with the finding of significant positive correlation between angular deviation and RV septal maximum principal strain, there was a decrease in E1 associated with areas of disarray compared with normal tissue. This indicates that RV septal function is directly influenced by disarray embedded in the septal wall. There was no significant reduction in overall maximum principal strain in transgenic animals (E1 = −0.10 ± 0.03 control, compared with −0.08 ± 0.03 transgenic). However, there was significantly reduced contractile function in the specific areas overlying disarray in the wall. There was also evidence of depth dependence in this effect as well, with no significant differences between strains associated with normal or disarrayed tissue when disarray was found at the midwall or close to the LV septum.
There was an overall reduction in average shear strain, E12, on the RV septum in transgenic animals compared with control (average E12 = 0.05 ± 0.01 control, compared with 0.01 ± 0.03 transgenic). There is reduced shear associated specifically with disarray and particularly in areas with moderate to severe disarray. This result is consistent with modeling studies that describe the importance of transmural fiber distribution for the development of ventricular torsion during systole (28).
During systolic contraction, the whole heart tends to twist in a left-handed helical fashion (positive twist). This is consistent with the fiber orientation found on the RV septal surface of the heart (fiber angle approximately − 60° with respect to the global circumferential axis). However, the fiber orientation at the LV septal surface is opposite (approximately +60° with respect to the global circumferential axis). According to Taber et al. (28), this is due to the larger mechanical advantage of the superficial fibers as a result of a larger moment arm created by the larger radius. During ejection, the wall thickens and further enhances this mechanical advantage. The findings from the MR tagging study by Young et al. (35), which found increased ventricular torsion, are consistent with this theory of mechanical advantage because the wall is thickened in human hypertrophic cardiomyopathy (this theory would predict increased torsion in any hypertrophic heart). Our results indicate the shear strain is reduced overall on the RV septal surface and particularly in areas overlying disarray. This is most likely due to the disruption of the transmural distribution of fiber orientation. Because disarray tends to concentrate in the septum in both human hypertrophic cardiomyopathy and the ras overexpression model, there may be a reduced tendency to twist in the septum, whereas hypertrophy of the LV may result in larger twist overall.
This study presents a method for measuring two-dimensional nonhomogeneous deformation in the isolated ejecting mouse heart. Our hemodynamic measurements are similar to those reported from other isolated ejecting mouse heart preparations (9, 12, 16, 19). Our results describe the first measurement of regional nonhomogeneous strain in the mouse heart and offers a sensitive method for examining regional function in the mouse heart that may have use in other transgenic mouse models of disease. It would also be of interest to examine changes in diastolic regional function in this model, because diseases such as hypertrophic cardiomyopathy are associated with prolonged ventricular relaxation. This would best be done either with an arrested heart preparation or with high-speed imaging during diastole in a contracting heart because the time resolution of the current system is limited to 60 fields/s.
The potential impact of other structural alterations besides myocyte disarray on regional function have not been addressed in this study. For example, myocyte hypertrophy, interstitial fibrosis, and altered myocardial architecture could influence local function. Similarly, myocyte contractile properties could be altered and would influence local strain measures in addition to effects of altered myocyte orientations. Structural alterations may be prevalent beyond the interventricular septum and may affect global mechanics and function; we did not examine myocardium outside of the central septal region. Another limitation of the present study was the use of non-wild-type littermates for control hearts. We chose to use “normal” weight-matched mice (Swiss) for control. We performed disarray analysis on three C57/B16 control mice in addition to the Swiss mice. We found the average dispersion of fiber angle to be very similar to that of Swiss mice (13.2 ± 0.8° in C57/B16 vs. 12.6 ± 0.6° in Swiss). The correlation results in this study do not involve any of the normal Swiss mice. We also did not quantitatively assess cardiac hypertrophy in the individual animals, thus variations in the hypertrophic response could increase the variations seen at the function level.
We conclude that nonhomogeneous strain analysis is a sensitive indicator of regional dysfunction in the mouse heart. Myofiber disarray found in the septal wall in transgenic mice with ventricular expression of ras causes local dysfunction. The most striking alteration in regional mechanics due to fiber disarray was the decrease in septal torsion. Torsion occurs due to shortening of muscle fibers arranged in a three-dimensional helical pattern, and in these transgenic hearts regions of fibers are disoriented. Because the principal strains were not affected as much as shear strains, there may be an uncoupling of the strain components due to fiber disarray. Hansen et al. (10) suggest that LV torsion is a sensitive indicator of contractile mechanics. Additionally, modeling studies suggest that ventricular twist is very sensitive to alterations in transmural fiber angle distribution (28) and crossover of fibers from epicardium to endocardium (4). Alterations in ventricular torsion in situations with regional fiber disarray such as human hypertrophic cardiomyopathy may be caused directly by the disarray and a lack of normal torsional deformation may have implications for local stress and oxygen consumption of the tissue.
Acknowledgments
This work was supported by the National Heart, Lung, and Blood Institute Grants HL-07444 and HL-54686, and American Heart Association Grant-In-Aid AHACA96-275.
References
- 1.Arts T, Meerbaum S, Reneman RS, Corday E. Torsion of the canine left ventricle during the ejection phase in the intact dog. Cardiovasc Res. 1984;18:183–193. doi: 10.1093/cvr/18.3.183. [DOI] [PubMed] [Google Scholar]
- 2.Arts T, Reneman RS, Veenstra PC. A model of the mechanics of the left ventricle. Ann Biomed Eng. 1979;7:299–318. doi: 10.1007/BF02364118. [DOI] [PubMed] [Google Scholar]
- 3.Betocchi S, Hess OM, Losi MA, Nonogi H, Krayenbuehl HP. Regional left ventricular mechanics in hypertrophic cardiomyopathy. Circulation. 1993;88:2206–2214. doi: 10.1161/01.cir.88.5.2206. [DOI] [PubMed] [Google Scholar]
- 4.Bonvendeerd PHM, Huyghe JM, Arts T, van Campen DH, Reneman RS. Influence of endocardial-epicardial crossover of muscle fibers on left ventricular wall mechanics. J Biomech. 1994;27:941–951. doi: 10.1016/0021-9290(94)90266-6. [DOI] [PubMed] [Google Scholar]
- 5.Braunwald E. Heart Disease. Philadelphia, PA: Saunders; 1988. [Google Scholar]
- 6.Currie RW, Tanguay RM, Kingma JG. Heat-shock response and limitation of tissue necrosis during occlusion/reperfusion in rabbit hearts. Circulation. 1993;87:963–971. doi: 10.1161/01.cir.87.3.963. [DOI] [PubMed] [Google Scholar]
- 7.Dong SJ, MacGregor JH, Crawley AP, McVeigh E, Belenkie I, Smith ER, Tyberg JV, Beyar R. Left ventricular wall thickness and regional systolic function in patients with hypertrophic cardiomyopathy. A three-dimensional tagged magnetic resonance imaging study. Circulation. 1994;90:1200–1209. doi: 10.1161/01.cir.90.3.1200. [DOI] [PMC free article] [PubMed] [Google Scholar]
- 8.Geisterfer-Lowrance AAT, Christe M, Conner DA, Ingwall JS, Schown FJ, Seidman CE, Seidman JG. A mouse model of familial hypertrophic cardimyopathy. Science. 1996;272:731–734. doi: 10.1126/science.272.5262.731. [DOI] [PubMed] [Google Scholar]
- 9.Grupp IL, Subramaniam A, Hewett TE, Robins J, Grupp G. Comparison of normal, hypodynamic, and hyperdynamic mouse hearts using isolated work-performing heart preparations. Am J Physiol Heart Circ Physiol. 1993;265:H1401–H1410. doi: 10.1152/ajpheart.1993.265.4.H1401. [DOI] [PubMed] [Google Scholar]
- 10.Hansen DE, Daughters GT, Alderman EL, Ingels NB, Stinson EB, Miller DC. Effect of volume loading, pressure loading, and inotropic stimulation on left ventricular torsion in humans. Circulation. 1991;83:1315–1326. doi: 10.1161/01.cir.83.4.1315. [DOI] [PubMed] [Google Scholar]
- 11.Hashima AR, Waldman LK, Young AA, McCulloch AD. Nonhomogeneous analysis of epicardial strain distributions during acute myocardial ischemia in the dog. J Biomech. 1993;26:19–35. doi: 10.1016/0021-9290(93)90610-q. [DOI] [PubMed] [Google Scholar]
- 12.Hewett TE, I, Grupp L, Grupp G, Robbins J. Alpha-skeletal actin is associated with increased contractility in the mouse heart. Circ Res. 1994;74:740–746. doi: 10.1161/01.res.74.4.740. [DOI] [PubMed] [Google Scholar]
- 13.Hunter JJ, Tanaka N, Rockman HA, Ross J, Jr, Chien KR. Ventricular expression of a MLC-2v-ras fusion gene induces cardiac hypertrophic and selective diastolic dysfunction in transgenic mice. J Biol Chem. 1995;270:23173–23178. doi: 10.1074/jbc.270.39.23173. [DOI] [PubMed] [Google Scholar]
- 14.Karlon WJ, Covell JW, McCulloch AD, Omens JH. Automated measurement of myofiber disarray in a transgenic mice with ventricular expression of. ras Anat Rec. 1998;252:612–625. doi: 10.1002/(SICI)1097-0185(199812)252:4<612::AID-AR12>3.0.CO;2-1. [DOI] [PubMed] [Google Scholar]
- 15.Kramer CM, Reichek N, Ferrari VA, Theobald T, Dawson J, Axel L. Regional heterogeneity of function in hypertrophic cardiomyopathy. Circulation. 1994;90:186–194. doi: 10.1161/01.cir.90.1.186. [DOI] [PubMed] [Google Scholar]
- 16.Luo W, I, Grupp L, Harrer J, Ponniah S, Grupp G, Duffy JJ, Doetschman T, Kranias EG. Targeted ablation of the phospholamban gene is associated with markedly enhanced myocardial contractility and loss of beta-agonist stimulation. Circ Res. 1994;75:401–409. doi: 10.1161/01.res.75.3.401. [DOI] [PubMed] [Google Scholar]
- 17.Marber MS, Mestril R, Chi SH, Sayen MR, Yellon DM, Dillmann WH. Overexpression of the rat inducible 70-kD heat stress protein in a transgenic mouse increases the resistance of the heart to ischemic injury. J Clin Invest. 1995;95:1446–1456. doi: 10.1172/JCI117815. [DOI] [PMC free article] [PubMed] [Google Scholar]
- 18.Mazhari R, Omens JH, Waldman LK, McCulloch AD. Regional myocardial perfusion and mechanics: a model-based method of analysis. Ann Biomed Eng. 1998;26:743–755. doi: 10.1114/1.74. [DOI] [PubMed] [Google Scholar]
- 19.Ng WA, I, Grupp L, Subramaniam A, Robbins J. Cardiac myosin heavy chain mRNA expression and myocardial function in the mouse heart. Circ Res. 1991;68:1741–1750. doi: 10.1161/01.res.68.6.1742. [DOI] [PubMed] [Google Scholar]
- 20.Omens JH, Covell JW. Transmural distribution of myocardial tissue growth induced by volume overload hypertrophy in the dog. Circulation. 1991;84:1235–1245. doi: 10.1161/01.cir.84.3.1235. [DOI] [PubMed] [Google Scholar]
- 21.Omens JH, MacKenna DA, McCulloch AD. Measurement of strain and analysis of stress in resting rat left ventricular myocardium. J Biomech. 1993;26:665–676. doi: 10.1016/0021-9290(93)90030-i. [DOI] [PubMed] [Google Scholar]
- 22.Prinzen TT, Arts T, Prinzen FW, Reneman RS. Mapping of epicardial deformation using a video processing technique. J Biomech. 1986;19:263–273. doi: 10.1016/0021-9290(86)90001-1. [DOI] [PubMed] [Google Scholar]
- 23.Rademakers FE, Rogers WJ, Guier WH, Hutchins GM, Siu CO, Weisfeldt ML, Weiss JL, Shapiro EP. Relation of regional cross-fiber shortening to wall thickening in the intact heart: three-dimensional strain analysis by NMR tagging. Circulation. 1994;89:1174–1182. doi: 10.1161/01.cir.89.3.1174. [DOI] [PubMed] [Google Scholar]
- 24.Ross J, Jr, Streeter DD., Jr Nonuniform subendocardial fiber orientation in the normal macaque left ventricle. Eur J Cardiol. 1975;3:229–247. [PubMed] [Google Scholar]
- 25.Snedecor GW, Cochran WG. Statistical Methods. Ames, Iowa: Iowa State University Press; 1989. [Google Scholar]
- 26.Stowe DF, Boban M, Graf BM, Kampine JP, Bosnjak ZJ. Contraction uncoupling with butanedione monoxime versus low calcium or high potassium solutions on flow and contractile function of isolated hearts after prolonged hypothermic perfusion. Circulation. 1994;89:2412–2420. doi: 10.1161/01.cir.89.5.2412. [DOI] [PubMed] [Google Scholar]
- 27.Streeter DD, Jr, Bassett DL. An engineering analysis of myocardial fiber orientation in pig’s left ventricle in systole. Anat Rec. 1966;155:503–512. [Google Scholar]
- 28.Taber LA, Yang M, Podszus WW. Mechanics of ventricular torsion. J Biomech. 1996;29:745–752. doi: 10.1016/0021-9290(95)00129-8. [DOI] [PubMed] [Google Scholar]
- 29.Tanaka N, Dalton N, Mao L, Rockman HA, Peterson KL, Gottshall KR, Hunter JJ, Chien KR, Ross J., Jr Transthoracic echocardiography in models of cardiac disease in the mouse. Circulation. 1996;94:1109–1117. doi: 10.1161/01.cir.94.5.1109. [DOI] [PubMed] [Google Scholar]
- 30.Tardiff J, Factor S, Tompkins B, Hewett T, Palmer B, Moore R, Schwartz S, Robbins J, Leinwand L. A truncated cardiac troponin T molecule in transgenic mice suggests multiple cellular mechanisms for familial hypertrophic cardiomyopathy. J Clin Invest. 1998;101:2800–2811. doi: 10.1172/JCI2389. [DOI] [PMC free article] [PubMed] [Google Scholar]
- 31.van der Bel-Kahn J. Muscle fiber disarray in common heart diseases. Am J Cardiol. 1977;40:355–364. doi: 10.1016/0002-9149(77)90157-6. [DOI] [PubMed] [Google Scholar]
- 32.Van Leuven SL, Waldman LK, McCulloch AD, Covell JW. Gradients of epicardial strain across the perfusion boundary during acute myocardial ischemia. Am J Physiol Heart Circ Physiol. 1994;267:H2348–H2362. doi: 10.1152/ajpheart.1994.267.6.H2348. [DOI] [PubMed] [Google Scholar]
- 33.Vernot A, Devaux JY, Herbin M, Lebruchec JF, Dubertret L, Raulo Y, Roucayrol JC. An automated system for the registration and comparison of photographic images in medicine. IEEE Trans Med Imaging. 1988;7:298–303. doi: 10.1109/42.14512. [DOI] [PubMed] [Google Scholar]
- 34.Yang Q, Sanbe A, Osinska H, Hewett TE, Klevitsky R, Robbins J. A mouse model of myosin binding protein C human familial hypertrophic cardiomyopathy. J Clin Invest. 1998;102:1292–1300. doi: 10.1172/JCI3880. [DOI] [PMC free article] [PubMed] [Google Scholar]
- 35.Young AA, Kramer CM, Ferrari VA, Axel L, Reichek N. Three-dimensional left ventricular deformation in hypertrophic cardiomyopathy. Circulation. 1994;90:854–867. doi: 10.1161/01.cir.90.2.854. [DOI] [PubMed] [Google Scholar]