Abstract
Both spatiotemporal analyses of adhesion signalling and the development of pharmacological inhibitors of integrin adhesion receptors currently suffer from the lack of an assay to measure integrin-effector binding and the response of these interactions to agonists. Here, we have expressed integrin-GFP and effector-mRFP pairs in living cells and quantified their association using FLIM to measure FRET. Talin-β1 and paxillin-α4 association was both ligand- and receptor activation state-dependent, and sensitive to inhibition with small molecule RGD and LDV mimetics, respectively. An adaptation of the assay revealed the agonistic activity of these small molecules and provides a new, quantitative assay for the screening of activity of small molecule integrin inhibitors.
Results and discussion
Integrins are cell adhesion receptors that provide physical support for tissues and enable directed migration during development and tissue homeostasis (1,2). At the cellular level, integrins spatially compartmentalise signalling events by tethering the contractile cytoskeleton to the plasma membrane and indirectly modulating multiple signalling networks. In mammals, 18 α and 8 β integrin genes encode polypeptides that combine to form 24 heterodimeric receptors (3), 12 of which contain the β1 subunit. Both subunits are non-covalently associated, type I transmembrane proteins with large extracellular and mostly short cytoplasmic domains. In recent years, substantial progress has been made towards defining the conformational changes that underpin integrin affinity regulation and identifying the effector proteins that initiate integrin signalling (4,5). Transmembrane/cytoplasmic domain separation, triggered either by the binding of FERM domain-containing cytoplasmic proteins (such as talin and myosin X; 6,7,8) or extracellular ligands, is currently thought to be the mechanism for the bidirectional transmembrane signal transduction that regulates adhesion (9).
In patients with inflammatory and neoplastic diseases, aberrant integrin function perturbs cellular trafficking and causes dysregulation of cellular differentiation (10). Within the last decade, the first generation of anti-integrin drugs has been approved for human therapy (11). Some of these agents are small molecule mimetics of the acidic peptide active sites found in most integrin ligands (e.g. RGD and LDV). Although these agents are potent, competitive inhibitors of integrin-ligand binding in vitro and in vivo, it is now evident that they frequently retain the agonistic properties of their parent ligands. This activity can lead to biological side-effects, such as platelet dysfunction, and can consequently impair the drug development process (12). As a result, there has been a pressing need for a reporter assay to measure the agonistic activity of integrin-binding ligands and small molecules in situ. Here, we present such a system, which employs fluorescence resonance energy transfer (FRET) to measure direct integrin-effector binding in intact cells. This assay also has the potential to detect and quantitate integrin signalling during normal biological processes, such as migration and differentiation.
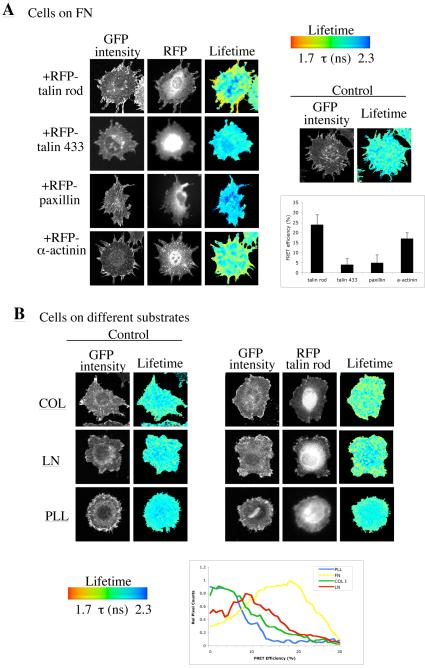
Initially, a full-length human β1 integrin construct was C-terminally tagged with green fluorescent protein (GFP). Although other β integrin-GFPs have been described (13), the ubiquitous distribution and high endogenous expression of β1 in most cells makes it difficult to express. This construct was therefore stably expressed to endogenous levels in immortalised β1 integrin-null mouse embryonic fibroblasts (MEFs) and its functional activity tested by a combination of confocal microscopy (to confirm presence in adhesion complexes) and cell attachment and spreading assays (Suppl. Fig. 1). To identify effectors that might undergo FRET with β1 integrin, four different candidate adhesion complex components were tested, each of which has been reported to bind directly to β integrins: the talin head domain (residues 1-433; 8), talin rod domain (residues 1984-2344; 14), α-actinin (15) and paxillin (16). β1-GFP MEFs were transfected with mRFP conjugates of each protein, plated onto a fibronectin substrate and integrin-effector binding analysed using fluorescence lifetime imaging microscopy (FLIM) to measure FRET. Specific interactions between β1 and the talin rod domain and α-actinin were detected, but no interaction was observed for the talin head domain or paxillin (Fig. 1A). The substrate dependence of the interaction between the talin rod domain and β1 integrin was examined. As shown in Fig. 1B, a modest interaction was detected on both collagen and laminin substrates, but binding was most prominent on fibronectin, where FRET was localised to focal adhesion structures (Fig. 1A). No FRET was detected between the integrin and any of the acceptors in cells plated on a non-integrin-binding poly-L-lysine substrate (PLL; Fig. 1B and data not shown). Although not the primary focus of this study, these data add significantly to our understanding of integrin effectors. Despite some controversy in the literature, it is apparent that the talin rod and α-actinin are able to interact directly with β1. From other studies, the ability of the talin head to associate with β1 is unequivocal (8), but we failed to detect the association by FRET-FLIM. We speculate that the functional role of the head domain may be transient, and restricted to early adhesion complexes, or that the construct is a potent dominant-negative inhibitor of adhesion complex formation.
Figure 1.
β1 integrin-GFP:talin rod-RFP interaction by FRET. A. β1 integrin-GFP fibroblasts were transfected with plasmids encoding mRFP conjugates of the N-terminal 433 amino acids of talin (termed talin 433), the C-terminal rod domain of talin (termed talin rod), paxillin or α-actinin, and plated onto fibronectin. Images show the GFP multiphoton intensity image and (where appropriate) corresponding widefield CCD camera image of the RFP expression. Control (GFP integrin alone) image demonstrates a normal GFP lifetime in the absence of acceptor. Lifetime images mapping spatial FRET across the cells are depicted using a pseudocolour scale (blue = normal lifetime, red = FRET). The bar graph represents average FRET efficiency of 7 cells over 3 independent experiments. Error bars are +-/SEM. B. β1 integrin-GFP fibroblasts were transfected with talin rod-mRFP. Cells were plated onto coverslips coated with poly-L-lysine (PLL), collagen I (COL), or laminin-1 (LN) and allowed to attach and spread for 2 hours. Control (untransfected) cells or co-transfected cells were then imaged by FLIM to detect FRET. Lifetime measurements were acquired and depicted as in (A). Histogram analysis of the spread of relative FRET efficiency is an average of >8 cells from 3 different experiments.
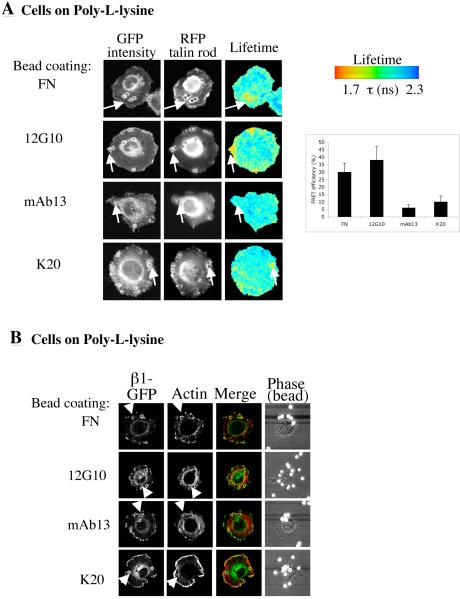
Having established that β1-GFP associates with talin rod-mRFP, the activation state dependence of the interaction was examined. In order to constrain the location of the clustered integrin for analysis, β1-GFP MEFs expressing talin rod-mRFP were plated onto PLL and incubated with 4.2μm beads coated with fibronectin ligand or the monoclonal antibodies 12G10 (which detects the high affinity or primed state and stimulates ligand binding (17,18)), mAb13 (which detects non-ligand-occupied integrin and which blocks ligand binding (19)) or K20 (which is non-function-altering and detects all conformational states). As shown in Figure 2A, an interaction between integrin and talin rod was only observed with fibronectin- or 12G10-coated beads. Confocal analysis of these cells also revealed actin recruitment to the bead structures in those cases where FRET was detected (Fig. 2B). These data suggest that controlling integrin conformation and therefore the activation of the extracellular domain of the integrin, either by native ligand or antibodies alone, can drive recruitment of both talin and actin to the integrin cytoplasmic domain.
Figure 2.
Ligand regulation of β1 integrin-talin rod binding. A. β1 integrin-GFP fibroblasts were transfected with talin rod-mRFP. Cells were plated onto coverslips coated with poly-L-lysine (PLL), and allowed to attach and spread for 2 hours. Cells were then incubated with 4.2μm beads coated with FN or anti-β1 antibodies (12G10, mAb13 or K20) for 30 minutes and subsequently imaged using FLIM as in Fig 1. Bar graph represents average FRET efficiency of a total of 16 cells per ligand. Efficiency was calculated using a mask of constant area around each bead region for local analysis of FRET. Error bars are +/-SEM. B. Cells were prepared as in (A), and following incubation with beads, samples were fixed, permeabilised and stained with phalloidin-Alexa568 to detect F-actin. Cells were then imaged by confocal microscopy.
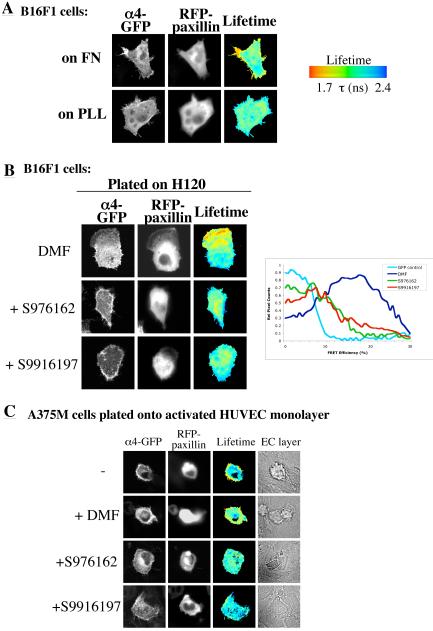
To exemplify further the use of FRET-FLIM for detecting integrin-effector binding, and to generate an assay that might be used to test small molecule inhibitors of integrin function, the previously characterised association between α4 integrin and paxillin (20,21) was selected. FLIM was employed to analyse FRET between α4-GFP and paxillin-mRFP in both mouse B16F1 and human A375SM melanoma cells. A localised interaction between integrin and paxillin was detected in B16F1 cells plated on fibronectin or an α4-binding fragment of fibronectin (H/120), but not on PLL (Fig. 3A/3B), confirming the results of the previous biochemical analyses. This interaction was also detected in cells plated on VCAM-1 (data not shown). FRET was significantly decreased when two small molecule, LDV ligand mimetic inhibitors of α4β1 (S976162 and S9916197 (22) see Suppl. Table 1 and Suppl. Fig. 2 for characterisation) were added to pre-spread cells (Fig. 3B). Interestingly, the remaining interacting population demonstrated a spatial shift from the cell periphery to the central basal region (just below the nucleus). A similar reduction in α4:paxillin binding following treatment with these compounds was also seen in live human A375SM melanoma cells plated onto an activated endothelial cell layer (Fig. 3C). These data demonstrate that α4 integrin-paxillin binding, detected by FRET, is both ligand-dependent and sensitive to inhibition with small molecule antagonists.
Figure 3.
Ligand binding to the α4 integrin extracellular domain regulates α4:paxillin association. A. B16F1 mouse melanoma cells were transfected with α4 integrin-GFP and paxillin-mRFP. Cells were then plated onto FN- or PLL-coated coverslips and imaged by multiphoton FLIM as before. B. The same cells were plated onto H120-coated coverslips followed by treatment with DMF vehicle control or stated small molecule inhibitors for 30 minutes and imaged by multiphoton FLIM. Histogram analysis of relative spread of FRET efficiencies is a mean of 18 cells per treatment as compared to GFP-α4 alone control. C. Human A375-SM melanoma cells were transfected with α4 integrin-GFP and paxillin-mRFP and plated onto a monolayer of TNFα-treated activated HUVEC cells. Cells were allowed to adhere for 60 minutes, and were then treated with DMF vehicle control or stated small molecule inhibitors for 30 minutes. Cells were then fixed and imaged using multiphoton FLIM.
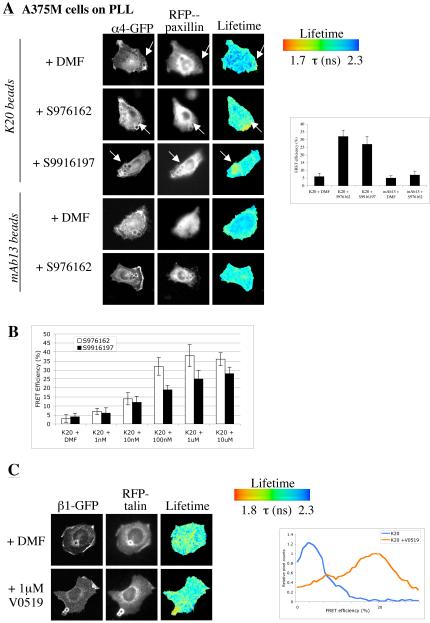
To test if the small molecule α4β1 inhibitors could also act as agonists, α4-GFP:paxillin-RFP-transfected A375SM cells were plated onto PLL and incubated with K20-coated beads. As shown in Fig. 2, these beads cluster, but do not activate integrins. Cells were then treated with vehicle control (DMF) or small molecule α4β1 inhibitors and the interaction between α4 and paxillin assessed by FLIM. Cells treated with either compound demonstrated a significant increase in α4:paxillin binding at the K20 bead interface (Fig. 4A). This effect was not seen with mAb13 beads, which would be expected to retain the β1 in an inactive conformation and prevent ligand binding. Moreover, the effects of the compounds were dose-dependent in a range that paralleled their anti-adhesive activity (Fig. 4B, Suppl. Table 1, Suppl. Fig. 2). We interpret these data to indicate that K20 immobilisation of β1 integrin allows the soluble compounds to act as agonists for α4β1 and trigger an activation response in the form of recruitment of cytoskeletal proteins. To extend these findings, an RGD ligand mimetic small molecule inhibitor of α5β1 and αVβ3 integrins (V0519) was tested for its effect on β1-GFP-talin rod-mRFP binding. β1-GFP cells expressing talin rod-mRFP were plated onto PLL and incubated with K20-coated beads in the presence or absence of V0519. As shown in Fig. 4D, V0519 substantially increased the β1:talin interaction at the bead interface.
Figure 4.
Small molecule inhibitors induce integrin signalling. A. A375-SM cells were transfected with α4 integrin-GFP and paxillin-mRFP and plated onto coverslips coated with PLL. Cells were then incubated with K20 or mAb13 antibody-coated beads for 30 minutes, followed by treatment with DMF or small molecule inhibitor as indicated. Cells were then imaged using multiphoton FLIM. Cumulative FRET efficiency data from a masked pre-set region around the bead in 10 cells per treatment is shown in the histogram. B. Histogram demonstrating FRET efficiency of α4-paxillin association at K20 beads over a dose response range of compounds S976162 or S9916197. C. β1 integrin-GFP fibroblasts were transfected with talin rod-mRFP. Cells were then plated onto coverslips coated with PLL and allowed to attach and spread for 1 hour. Cells were then incubated with beads coated with K20 for 30 minutes, and treated with either vehicle control DMF or V0519 compound, and subsequently imaged using FLIM as before. Cumulative FRET efficiency data from a masked pre-set region around the bead in 12 cells per treatment is shown in the histogram.
In summary, we have established assays to detect integrin-effector binding by FRET-FLIM. The availability of these assays will not only enable spatiotemporal studies of integrin signalling, but they could also form the basis for low and high throughput screening of small molecule inhibitors in the pharmaceutical industry. The application of direct imaging techniques to study small molecule compound effectors in situ may provide an excellent platform for future identification of therapeutic compounds that either possess or lack agonistic activity.
Supplementary Material
Summary.
This study uses FRET to image intracellular protein interactions with integrins in live cells and reports on the effect of integrin antagonists on these binding events.
Acknowledgements
The authors would like to thank Simon Ameer-Beg, Boris Vojnovic and Paul Barber for their continued support and development of the multiphoton FLIM system. The authors are also grateful to Sanofi-Aventis (Frankfurt) for providing the inhibitor compounds. This work was supported by a Royal Society University Research Fellowship (to MP) and grants 045225 and 074941 from the Wellcome Trust (to MJH).
References
- 1.van der Neut R, Krimpenfort P, Calafat J, Niessen CM, Sonnenberg A. Nat.Genet. 1996;13:366–369. doi: 10.1038/ng0796-366. [DOI] [PubMed] [Google Scholar]
- 2.Wagner N, Lohler J, Kunkel EJ, Ley K, Leung E, Krissansen G, Rajewsky K, Muller W. Nature. 1996;382:366–370. doi: 10.1038/382366a0. [DOI] [PubMed] [Google Scholar]
- 3.Hynes RO. Cell. 2002;110:673–687. doi: 10.1016/s0092-8674(02)00971-6. [DOI] [PubMed] [Google Scholar]
- 4.Luo BH, Carman CV, Springer TA. Annu. Rev. Immunol. 2007 doi: 10.1146/annurev.immunol.25.022106.141618. in press. [DOI] [PMC free article] [PubMed] [Google Scholar]
- 5.Humphries MJ. Integrin structure. Biochem. Soc. Trans. 2000;28:311–339. [PubMed] [Google Scholar]
- 6.Zhang H, Berg JS, Li Z, Wang Y, Lang P, Sousa AD, Bhaskar A, Cheney RE, Stromblad S. Nature Cell Biol. 2004;6:523–531. doi: 10.1038/ncb1136. [DOI] [PubMed] [Google Scholar]
- 7.Tadokoro S, Shattil SJ, Eto K, Tai V, Liddington RC, de Pereda JM, Ginsberg MH, Calderwood DA. Science. 2003;302:103–106. doi: 10.1126/science.1086652. [DOI] [PubMed] [Google Scholar]
- 8.Garcia-Alvarez B, de Pereda JM, Calderwood DA, Ulmer TS, Critchley D, Campbell ID, Ginsberg MH, Liddington RC. Mol. Cell. 2003;11:49–58. doi: 10.1016/s1097-2765(02)00823-7. [DOI] [PubMed] [Google Scholar]
- 9.Kim M, Carman CV, Springer TA. Science. 2003;301:1720–1725. doi: 10.1126/science.1084174. [DOI] [PubMed] [Google Scholar]
- 10.Mousa SA. Curr.Opin.Chem.Biol. 2002;6:534–541. doi: 10.1016/s1367-5931(02)00350-2. [DOI] [PubMed] [Google Scholar]
- 11.Leclerc JR. Crit Care Med. 2002;30:S332–S340. doi: 10.1097/00003246-200205001-00025. [DOI] [PubMed] [Google Scholar]
- 12.Hantgan RR, Stahle MC, Connor JH, Connor RF, Mousa SA. J Thromb Haemost. 2007 Mar;5(3):542–50. doi: 10.1111/j.1538-7836.2007.02351.x. [DOI] [PubMed] [Google Scholar]
- 13.Ballestrem C, Hinz B, Imhof BA, Wehrle-Haller B. J Cell Biol. 2001;155:1319–1332. doi: 10.1083/jcb.200107107. [DOI] [PMC free article] [PubMed] [Google Scholar]
- 14.Xing B, Jedsadayanmata A, Lam SC. J Biol Chem. 2001;276:44373–44378. doi: 10.1074/jbc.M108587200. [DOI] [PubMed] [Google Scholar]
- 15.Otey CA, Pavalko FM, Burridge K. J Cell Biol. 1990;111:721–729. doi: 10.1083/jcb.111.2.721. [DOI] [PMC free article] [PubMed] [Google Scholar]
- 16.Schaller MD, Otey CA, Hildebrand JD, Parsons JT. J Cell Biol. 1995;130:1181–1187. doi: 10.1083/jcb.130.5.1181. [DOI] [PMC free article] [PubMed] [Google Scholar]
- 17.Mould AP, Askari JA, Barton S, Kline AD, McEwan PA, Craig SE, Humphries MJ. J. Biol. Chem. 2002;277:19800–19805. doi: 10.1074/jbc.M201571200. [DOI] [PubMed] [Google Scholar]
- 18.Mould AP, Garratt AN, Askari JA, Akiyama SK, Humphries MJ. FEBS Lett. 1995;363:118–122. doi: 10.1016/0014-5793(95)00301-o. [DOI] [PubMed] [Google Scholar]
- 19.Akiyama SK, Yamada SS, Chen WT, Yamada KM. J. Cell Biol. 1989;109:863–875. doi: 10.1083/jcb.109.2.863. [DOI] [PMC free article] [PubMed] [Google Scholar]
- 20.Liu S, Thomas SM, Woodside DG, Rose DM, Kiosses WB, Pfaff M, Ginsberg MH. Nature. 1999;402:676–681. doi: 10.1038/45264. [DOI] [PubMed] [Google Scholar]
- 21.Goldfinger LE, Han J, Kiosses WB, Howe AK, Ginsberg MH. J Cell Biol. 2003;162:731–741. doi: 10.1083/jcb.200304031. [DOI] [PMC free article] [PubMed] [Google Scholar]
- 22.Gläsner J, Blum H, Wehner V, Stilz HU, Humphries JD, Curley GP, Mould AP, Humphries MJ, Hallmann R, Röllinghoff M, Gessner A. J. Immunol. 2005;175:4724–4734. doi: 10.4049/jimmunol.175.7.4724. [DOI] [PubMed] [Google Scholar]
- 23.Tremuth L, Kreis S, Melchior C, Hoebeke J, Ronde P, Plancon S, Takeda K, Kieffer N. J. Biol. Chem. 2004;279(21):22258–22266. doi: 10.1074/jbc.M400947200. [DOI] [PubMed] [Google Scholar]
- 24.Calderwood DA, Zent R, Grant R, Rees DJ, Hynes RO, Ginsberg MH. J. Biol. Chem. 1999;274(40):28071–28074. doi: 10.1074/jbc.274.40.28071. [DOI] [PubMed] [Google Scholar]
- 25.Jat PS, Noble MD, Ataliotis P, Tanaka Y, Yannoutsos N, Larsen L, Kioussis D. Proc. Natl. Acad. Sci. USA. 1991;88(12):5096–5100. doi: 10.1073/pnas.88.12.5096. [DOI] [PMC free article] [PubMed] [Google Scholar]
- 26.Graus-Porta D, Blaess S, Senften M, Littlewood-Evans A, Damsky C, Huang Z, Orban P, Klein R, Schittny JC, Muller U. Neuron. 2001;31(3):367–79. doi: 10.1016/s0896-6273(01)00374-9. [DOI] [PubMed] [Google Scholar]
- 27.Parsons M, Monypenny J, Ameer-Beg SM, Millard TM, Machesky LM, Peter M, Chernoff J, Zicha D, Vojnovic B, Ng T. Mol Cell Biol. 2005;25(5):1680–95. doi: 10.1128/MCB.25.5.1680-1695.2005. [DOI] [PMC free article] [PubMed] [Google Scholar]
- 28.Peter M, Ameer-Beg SM, Hughes MK, Keppler MD, Prag S, Marsh M, Vojnovic B, Ng T. Biophys J. 2005 Feb;88(2):1224–37. doi: 10.1529/biophysj.104.050153. [DOI] [PMC free article] [PubMed] [Google Scholar]
- 29.Newham P, Craig SE, Clark K, Mould AP, Humphries MJ. J Immunol. 1998 May 1;160(9):4508–17. [PubMed] [Google Scholar]
- 30.Lin K, Ateeq HS, Hsiung SH, Chong LT, Zimmerman CN, Castro A, Lee WC, Hammond CE, Kalkunte S, Chen LL, Pepinsky RB, Leone DR, Sprague AG, Abraham WM, Gill A, Lobb RR, Adams SP. J Med Chem. 1999 Mar 11;42:920–34. doi: 10.1021/jm980673g. [DOI] [PubMed] [Google Scholar]
Associated Data
This section collects any data citations, data availability statements, or supplementary materials included in this article.


