

Abstract
Neural correlates of aging in the medial prefrontal cortex (mPFC) were studied using an operant delayed response task. The task used blocks of trials with memory-guided (delayed alternation) and visually-guided (stimulus-response) responding. Older rats (24 months) performed at a slow pace compared with younger rats (6 months). They wasted time engaged in nonessential behaviors (e.g., licking on spouts beyond the period of reward delivery) and were slow to respond at the end of the delay period. Aged mPFC neurons showed normal spatial processing. They differed from neurons in younger rats by having reduced modulations by imperative stimuli indicating reward availability and reduced activity associated with response latencies for reward collection. Older rats showed reduced sensitivity to imperative stimuli at three levels of neural activity: reduced fractions of neurons with changes in firing rate around the stimulus, reduced correlation over neurons at the time of the stimulus as measured with analysis of population activity, and reduced amplitudes of event-related fluctuations in intracortical field potentials at the time of the imperative stimulus. Our findings suggest that aging alters the encoding of time-sensitive information and impairs the ability of prefrontal networks to keep subjects “on task.”
Introduction
Older subjects often struggle to complete tasks in a timely and consistent manner. For example, Craik and Bialystok (2006) tested younger and older subjects during a virtual “making breakfast” task. Subjects prepared up to six foods that had to finish at the same time. Older participants completed the task slower than younger ones, as they perseverated in setting the table for breakfast when they should have been engaged in cooking activities. These findings might be due to the diminished ability of older subjects to use temporal cues to improve behavioral performance (Zanto et al., 2011). Such processing is likely to depend on the prefrontal cortex (PFC), where lesions lead to increases in behavioral variability (Stuss et al., 2003) that are similar to the reductions in executive control that are found in aging (West et al., 2002).
Studies in experimental animals have established that neurons in medial parts of PFC fire persistently during delay periods in action-timing tasks (Niki and Watanabe, 1979; Narayanan and Laubach, 2006) and exert control over the motor cortex to minimize temporally inappropriate responding (Narayanan and Laubach, 2006). Changes in the functional properties of PFC neurons have been found over the lifespan, including reduced dendritic integrity (Grill and Riddle, 2002; Peters et al., 2008), altered electrophysiological properties (Chang et al., 2005; Disterhoft and Oh, 2006), and changes in second messengers systems (Ramos et al., 2003; Brennan et al., 2009). These changes might alter how PFC networks maintain behaviorally relevant information in working memory (Arnsten et al., 2010). In support of this view, Wang et al. (2011) found that neurons in the aged dorsolateral PFC show reduced delay period activity in an ocular delayed response task. Based on these findings, we hypothesized that aging-related alterations in the medial PFC might lead to changes in the ability of older subjects to exert temporal control over action.
To test this hypothesis, we recorded from ensembles of neurons in the medial prefrontal cortex (mPFC) of younger (6 months) and older (24 months) rats during an operant delayed response task. As in the study by Craik and Bialystok (2006), older rats performed the task accurately but at a slower pace and became “stuck” in transitional moments of the task (e.g., excessive time taken to collect rewards at the end of the delay period). Neural responses to imperative task stimuli were diminished and there was reduced encoding of response latencies to those stimuli during the delay period. Despite performing the task at a slower pace, the older subjects were able to perform as accurately as the younger subjects. Importantly, the same neural ensembles from aged rats that showed reduced sensitivity to temporal aspects of performance also showed normal levels of spatial encoding. Based on these findings, we suggest that aging reduces the ability of older subjects to stay on task and that this effect arises from a reduced capacity of the aged PFC to process time-sensitive information.
Materials and Methods
All experimental procedures were approved by the Animal Care and Use Committee at The John B. Pierce Laboratory and conform to guidelines for the Ethical Treatment of Animals (National Institutes of Health).
Subjects.
Six younger (6 months old) and four older (24 months old) male Brown Norway rats (Harlan) were individually housed in a temperature- and humidity-controlled animal room, and kept on a 12 h light/dark cycle with lights on at 7:00 A.M. They were handled daily and had ad libitum access to food and water for 1 week upon arrival in the laboratory. Thereafter, they were maintained with unlimited access to water and regulated access to food and kept at ∼80% of their free-feeding body weight until the beginning of behavioral training.
Brown Norway rats were chosen for this study because they age in a healthy manner, maintaining a stable body weight over adulthood (not becoming obese like other strains) and with reduced development of skin tumors (Lipman et al., 1996). They are pigmented and appear to have good vision (as evidenced by the high levels of performance accuracy in the stimulus-guided delayed response task described below). Average (and SD) body weights at the beginning of training were 228 g (±18 g) and 316 g (±15 g) for younger and older rats, respectively. Therefore, we do not believe that any of the results reported in this paper were due to systematic discrepancies in visual acuity, health, or weight.
Behavioral training.
All rats were trained in an operant box that was housed within a sound-attenuating chamber (ENV-008; Med Associates). The box was equipped with a custom-made lever (The John B. Pierce Laboratory Instruments Shop) located between two barriers on one of the walls, which controlled for rats' posture during bar pressing (see Fig. 2A). Two head-entry apertures (referred to as “reward ports”) were located on the opposite wall and had spouts that delivered liquid sucrose. The reward ports were also equipped with infrared beams (ENV-114BM; Med Associates) placed immediately in front of the spouts, which recorded times of head entries and licks to the spouts. Light stimuli (ENV-215M; Med Associates) located above the lever and reward ports indicated the location of the next assignment in the tasks. They were used as the Go stimulus (indicating the need to transition to the next component of the tasks) and were rated to illuminate the entire chamber >200 lux at a distance of 3 inches.
Figure 2.

Training apparatus and behavioral procedures. A, The left diagram shows the experimental box with a rat at the lever at the time of the Go stimulus in the memory-guided task. The lever was used to control the durations of the delay period. Head-entry responses were made at the two reward ports, which contained spouts for sucrose delivery. Performance of a correct trial in the memory-guided task is shown in the center plot (the rat alternated between the left and right reward ports between trials). The right diagram shows a rat in the visually-guided task, in which a light inside one of the reward ports indicated the location for a correct head entry after the delay period. B, Percentage correct trials as a function of trial duration (time between the last head entry in trial ‘a’ until the first head entry in trial ‘a+1′) in the memory- (top) and visually-guided (bottom) tasks. Error bars indicate SEM. Percentage correct was a function of trial duration only in the memory-guided task, and younger (black bars) and older (gray bars) rats performed equally well in both tasks. C, Effect of age on temporal aspects of task performance in an intermediate session of training (left plot) and during neural recording sessions (right plot). Older rats took longer to complete trials (left y-axis of left plot) and spent extra time at the lever after the delay period had ended (right y-axis of left plot). A diagram illustrating time spent in each behavioral component of memory-guided trials during recording sessions is shown on the right. Older rats showed inflated times in all components (size of arrows and circles is proportional to time). D, Boxplots summarizing the video analysis of time spent at the lever after the onset of the Go stimulus. Older rats took longer than younger rats to initiate the turn, turn their bodies toward the reward ports, and reach the reward ports.
Memory-guided task.
Rats were trained to alternate head-entry responses between the left and right reward ports across trials, which were mediated by a lever press-initiated variable interval schedule. A successful trial in the memory-guided task went as follows (Fig. 2A, center schematic). After a head entry into the left reward port, the light above the lever was turned on. The rat turned to the lever (Fig. 2A, arrow 1) and the first lever press initiated a variable interval 0–20 s (which will be referred to as the “delay period”). During the delay period, lever presses were recorded but had no consequence. The first lever press after the variable interval elapsed turned off the light above the lever and turned on the light above the reward ports (i.e., Go stimulus), indicating that the rat had to retract from the lever, turn toward the reward ports, and make a head-entry response into one of the reward ports. If the rat chose the correct (alternate) reward port, i.e., in this example the right port (Fig. 2A, arrow 2), the light above the reward ports was turned off, the light above the lever was turned on, and ∼0.05 ml of 20% sucrose solution was delivered from the spout inside the correct port. The rat, then, had to turn back to the lever to continue on to the next trial (Fig. 2A, arrow 3). Alternatively, if the incorrect reward port was chosen (i.e., the same port chosen in the previous trial), the light above the reward ports was turned off and the light above the lever was turned on, but no sucrose was delivered (incorrect trial). After incorrect trials, the same reward port assignment was kept for the next trial (correction trial). Rats were trained in 60 min daily sessions (excluding weekends).
To learn the memory-guided task, all rats were first trained to lever press in the operant box (standard fixed-ratio 1 schedule of reinforcement). Then, upon a lever press they were required to retract from the lever and make a head entry into one of the reward ports to collect reward (∼0.05 ml of 20% sucrose solution, which was delivered inside the chosen reward port). At this point, the rats were trained to alternate head-entry responses between the two reward ports across trials. The requirement of lever presses between trials was gradually increased from a fixed-ratio 1 to a fixed-ratio 8 schedule, after which the lever press-initiated variable interval schedule was introduced (final stage of training). This training sequence took ∼4 months, at which time their performance was stable at >75% correct trials in the shorter delays (Fig. 2B, top). At this point, training on the visually-guided task took place in alternate sessions.
Visually-guided task.
All aspects of the visually-guided task were similar to that described for the memory-guided procedure, with the important difference that the Go stimulus was presented inside the left or right reward port, and its location defined the assigned correct port for a head entry in each trial (Fig. 2A, right schematic). A head entry into the illuminated reward port turned off the light inside the reward port, turned on the light above the lever, and delivered sucrose (correct trial), while a head entry into the dark reward port terminated the light inside the reward port and turned on the light above the lever, but did not deliver sucrose (incorrect trial). The location of the Go stimulus (left or right reward port) was determined randomly in each trial without taking into account whether the previous trial was correct or incorrect (i.e., there were no correction trials). This can be seen as a control procedure in which, during the delay period, the rats do not need to remember the location previously visited to maximize their rewards. In fact, when training on the visually guided task began, the rats had to break from the extensively trained “alternation mode” and “track the stimulus” to receive the reward. After 20 interspersed memory- and visually-guided sessions (10 sessions each), the animals were rested and implanted with arrays of electrodes.
Surgeries.
Upon completion of training on both tasks, rats were given 1 week of full access to food before being implanted unilaterally or bilaterally with microwire arrays into mPFC. Microwire arrays were composed of 16 50 μm stainless steel wires, arranged in 2 × 8 configurations, spaced ∼200 μm apart, and impedance range 200–300 ohms (Neurolinc). After initial anesthesia with ∼4% isoflurane, intraperitoneal injections of ketamine (80–100 mg/kg) and diazepam (8–10 mg/kg) or ketamine and xylazine (10 mg/kg) were administered. Supplements (one-third of the initial dose) of the two drugs initially administered were given approximately every 60 min. The scalp was shaved and the rat was placed in a stereotaxic apparatus using blunt 45° ear bars to prevent eardrum rupture. Eyes were covered with ophthalmic antibiotic ointment to prevent desiccation. The scalp was disinfected with iodine, injected subcutaneously with lidocaine (0.3 ml), and incised and retracted to expose the skull surface. Lambda and bregma were leveled and unilateral or bilateral craniotomies were made for implantation of multi-electrode arrays. Two skull screws were inserted posterior to the craniotomies, and one was inserted anterior to one of the craniotomies. The microwire arrays were then placed in mPFC (anteroposterior, +3.2; mediolateral, ±1.4; dorsoventral, −2.8 to −3.6 at 12° from the midline).
After electrode placement, the craniotomy was sealed with cyanoacrylate (Slo-Zap) and cyanoacrylate accelerator (Zip Kicker). The skull was covered with methyl methacrylate (AM Systems). Wound margins were daubed with antibiotic ointment. Rats were given enrofloxacin (an antibiotic) and carprofen (a nonsteroidal anti-inflammatory drug) via the drinking water for a week (3 ml of 100 mg/kg enrofloxacin and 0.5 ml of 50 mg/ml carprofen diluted in 500 ml of water). After surgery, rats had full access to food for at least 1 week.
Electrophysiological recordings.
After recovery from surgery, rats were food regulated and transferred to a neural recording box. The neural recording box was similar to the training box but modified for electrical recordings (custom built by The John B. Pierce Laboratory Instruments Shop). All walls, floor, and behavioral devices were made of acrylic plastic, and the barriers sloped diagonally outward to prevent the rats from hitting their implanted connectors during locomotion to and from the lever. The neural recording box was positioned on a steel plate within a copper wire Faraday cage. Behavior was monitored using an infrared camera and videotaped for off-line video analysis.
Before each recording session, rats were briefly anesthetized with 4% isoflurane to connect cables to the implanted connectors. Rats completely recovered spontaneous motor activity within a few minutes, were placed in the neural recording box, and connected to a 32 channel slip contact commutator (Plexon) mounted in the center of the ceiling of the chamber. This device connected cables from the implanted probes to the recording system and allowed relatively free movement. During the first few minutes in the box, spike sorting was performed and spontaneous recordings of neural activity were made. Neural recordings were made using a Many Neuron Acquisition Program (Plexon). Single neuronal units were identified on-line using an oscilloscope and audio monitor amplified at an average gain of 12,000 and off-line using the Plexon off-line sorter. On-line sorting was done with the “boxes” feature in the Plexon software, in which waveforms were manually selected based on their amplitude and deviation from background firing. Artifacts due to cable noise and behavioral devices during the behavioral tasks were removed during off-line sorting. Single units were identified as having (1) consistent waveform shape, (2) average amplitude estimated at least three times larger than background activity, and (3) a consistent refractory period of at least 2 ms in interspike-interval histograms. Electrode recording sites were localized using standard methods, and are shown in Figure 1C. Wideband potentials were recorded before each session, with filtering between 0.5 and 5.9 kHz and sampling at 10 kHz, for all channels with isolated single units. Field potentials were recorded during each behavioral session for all electrodes, with filtering as above for the wideband recordings and sampling at 1 kHz.
Figure 1.

A, An example of a wideband signal (bottom trace), and recorded spikes (upper ticks) of a single unit from an older rat. B, Waveform for the same unit shown in A (top), showing a clear distinction between the recorded unit and the background, and the interspike-interval (ISI) distribution for this unit (bottom). C, Horizontal section with locations of electrode tips for younger (blue circles) and older (red circles) rats (top plot; FrA, frontal association cortex; PrL, prelimbic cortex; Cg2, cingulate cortex, area 2). Bottom left plot, Sagittal representation of the depth of the implants (the straight line represents the horizontal section shown above). Bottom right plot, Coordinates used during surgery.
The same tasks used during training were used during recordings, except that instead of a variable interval 0–20 s, the delay period consisted of a lever press-initiated fixed interval 4 s (i.e., the minimum interval between the first press and last press—the delay period—was fixed at 4 s). This was done to maximize the number of trials recorded from all rats (given that there was no difference in percentage correct trials between younger and older rats as a function of trial duration in the memory-guided task; see Results and Fig. 2B, top), while ensuring a minimum delay between head-entry responses that kept performance at 80–90% correct. Each recording session started with memory-guided trials for ∼60 min, immediately followed by visually-guided trials for another ∼60 min. In the next recording session, the order of the two blocks was reversed. Two recording sessions from each rat were used in the analyses that are described below.
Data analysis.
We used a combination of NeuroExplorer (Nex Technologies), MATLAB (MathWorks), and R for the data analysis in this manuscript. For the analyses of neural sensitivities to the behavioral events, spike counts were binned around the times of relevant events (reward port entry and first lever press) in each trial (±0.5 s) for each neuron. During the behavioral events chosen, the rats were relatively stationary in the box. Neurons were analyzed if they fired at a rate >0.1 spikes per second. Extensive analysis was done on spike waveforms to ensure that only single units were included in the analyses (Fig. 1), and that significant effects were not due to changes in unit isolation over the memory- and visually-guided blocks or due to differences in recordings from younger and older rats. A square root transform of the data was used (variance stabilization) and regression analysis (using linear models) was used to estimate if spike counts varied in relation to the behavioral variables (location, time since last trial, time since last reward, latency to enter the reward port after the Go stimulus). Terms in the regression models were assessed using ANOVA. Significance was assessed using a permutation approach, i.e., empirical p values were estimated from the distribution of F statistics that were obtained from 1000 repetitions on trial-shuffled data (i.e., shuffling of the classification of left vs right trials or upcoming latencies to enter the reward ports) and the cells were considered to be sensitive to the task events if the F statistic from the ANOVA run for the observed data was less than the F statistics obtained from the trial-shuffled data for no more than 5% of the shuffled datasets (i.e., p < 0.05). About 10% of neurons were sensitive to nonspatial aspects of the task (time since last trial and time since last reward) and these fractions did not differ by age. For these reasons, we chose to focus on spatial effects (see Results). Fractions of cells that were sensitive to the various behavioral events were compared by age using a proportions test.
Stimulus-related modulations of spike activity were assessed using signed rank tests. Spike counts over all trials were compared for data windows centered over a 0.5 s epoch before and after the Go stimulus. Subsequent changes in firing rate during the response to the stimulus or during the initiation of locomotion were evaluated using change-point methods from the strucchange library for R (Zeileis et al., 2003), as in Kimchi et al. (2009). Evidence for structural change was estimated using a recursive estimates model (comparing the observed fluctuations to a drift-diffusion process).
Principal component analysis (PCA) was performed using the same methods as in Narayanan and Laubach (2009). Average spike density functions (from 1 s before to 2 s after the time of the Go stimulus, 0.015 s bins) were collected for all neurons from the younger or older rats and placed in a matrix, called X (see Fig. 7A). The columns of the matrix represented time around the stimulus and the rows represented each neuron. Each row of the matrix was normalized to have a mean of zero and variance of 1. Then, PCA was done for N leading components in MATLAB as follows: [u,s,v] = svd(X′,0); U = u(:,1:N); l = diag(s).∧2/(J−1); Z = X * U. Here, U is the eigenvectors (or coefficients) for each bin, l is the eigenvalues (or variance explained), and Z is the matrix of scores (or loadings) for the neurons onto each principal component. The transpose is used (e.g., X′) to account for variability over bins, not neurons. The number of components that accounted for relatively large portions of temporal covariance over the neural ensembles was evaluated for each data matrix using scree plots.
Figure 7.

A, Characterization of population activity using principal component analysis based on a data matrix comprised of the average spike density functions for all neurons recorded from both younger and older rats. (PC, principal component). B, The top plot shows the variance-weighted population averages for the two leading components around the time of the Go stimulus for the younger rats. The first component, PC1, accounted for >20% of variance in firing rates and showed continuous modulation from the time of the Go stimulus through the period of fluid consumption (>2 s). The second component, PC2, accounted for ∼16% of variance and showed a clear modulation around the presentation of the Go stimulus. The bottom plot shows the same PCs for the older rats, with a significantly reduced modulation of PC2 around the Go stimulus. C, Variance accounted for by the first 20 PCs for younger (left plot) and older rats (right plot). There was only one PC with a large variance in the matrix based on neurons from the older rats compared with two PCs with large variance in the matrix based on neurons from younger rats. D, Examples of neurons with large loadings on PC 1 (top) and PC 2 (bottom) from younger (left) and older rats (right). Both correct and incorrect trials are used, and rasters are sorted by time to reach the reward ports. Although younger and older neurons with large loadings on PC1 fired similarly, firing patterns for PC2-related neurons from older rats were dramatically reduced, and none of the aged neurons showed increased firing to the Go stimulus.
Spectral analysis of local field potentials (LFPs) was done using custom written routines and methods from the EEGLAB toolbox for MATLAB (Delorme and Makeig, 2004). For the event-related spectral analysis (ERSP) in Figure 8, we created a peri-event matrix (LFPmat) for the LFPs around the Go stimulus, ±4 s and 0.001 ms bins. Then, we used a function called newtimef from EEGLAB to do the ERSP: [ERSP, ∼, ∼, times, freqs] = newtimef(LFPmat(:), 8000, [−4000 4000], 1000, 0, ‘plotitc’, ‘off’, ‘maxfreq’, 100, ‘baseline’, NaN, ‘erspmax’, 0). Bootstrapping was used to assess significance of power fluctuations by adding an additional item to the function call above: ‘alpha’, 0.01. Power between 1 and 5 Hz was extracted from the ERSP matrix by modifying the call to newtimef to run for single trial data. Results from each run were saved in a new variable and the mean and confidence interval were calculated for individual LFP recordings or for the collection of average spectrograms recorded over all electrodes in the younger and older rats (as shown in Fig. 8D) using the bootci function from the MATLAB Statistics Toolbox.
Figure 8.

A, Examples of LFPs from one younger (left plot) and one older rat (right plot) during the time of the Go stimulus. LFPs for 10 consecutive trials are shown. The first magenta dotted line represents the time of the Go stimulus, and the second line represents the average time at which the rats reached the reward ports. Clear oscillations around the time of the Go stimulus are observed for the younger rat, while oscillations seem to track movement toward the reward ports for the older rat. B, Power spectral density distributions of the traces shown in A for the younger (top plot) and older rat (bottom plot). C, Event-related spectral analysis of the LFPs from A for the period around the Go stimulus (ERSP, event-related spectrum perturbation). Cold to warm colors indicate lower to higher power. Event-related power was most prominent at the onset of the Go stimulus in the LFP from the younger rat. By contrast, power was most prominent during movement toward the reward ports for the older rat. D, Grand averages for all LFPs recorded in each rat for the same task epoch, showing a consistent modulation of LFPs around the Go stimulus for the younger rats, and around movement toward the rewards ports for the older rats.
Results
Performance on the memory- and visually-guided tasks during training
Younger and older rats performed similarly well in the behavioral tasks. Figure 2B shows percentage correct trials as a function of trial duration for the 20 sessions of alternations between the memory- and visually-guided tasks (10 sessions each, in alternate days). Trial duration was defined as the time from the last head entry into one of the reward ports in trial ‘a’ to the time of the first head entry into a reward port in trial ‘a+1’ (i.e., empirical delay between head entries experienced by the rats). Performance was a function of trial duration in the memory-guided task for both groups (which suggests that this task is appropriate to investigate working memory), but younger and older rats performed similarly in terms of accuracy at the different durations (Fig. 2B, top). A repeated-measures ANOVA revealed a significant effect of duration (F(5,40) = 17.99; p ≪ 0.01), no effect of age (F(1,40) = 0.44; p = 0.527), and no duration versus age interaction (F(5,40) = 0.51, p = 0.766).
When performance was stable in the memory-guided task, all rats were trained in the new visually-guided procedure in alternate days. Older rats had the propensity to continue to alternate in the first few sessions of the visually-guided procedure (data not shown), taking longer to learn the new task. After 10 sessions of training in the novel trials, all rats in both groups had reached a learning criterion for the visually-guided procedure (90% correct performance over a block of 10 consecutive trials) and performed equally well (Fig. 2B, bottom; repeated-measures ANOVA, no effect of duration, F(5,40) = 0.17; p = 0.973; no effect of age, F(1,40) = 3.57; p = 0.094; and no duration vs age interaction, F(5,40) = 1.22, p = 0.318).
Despite the similarity in percentage correct trials, younger and older rats performed the memory- and visually-guided tasks at different paces both during training and at asymptote. Performance in an intermediate session of training (fixed-ratio 4) in the memory-guided task (when the delay period was relatively constant for younger and older rats and percentage correct trials was similar — 69 ± 5% and 69 ± 5% correct trials, respectively; two-sample t test, t(8) = 0.05, p = 0.963) was analyzed for pace. Figure 2C, left plot, shows the “mean of medians” for time to complete one trial and extra time at the lever after the Go stimulus was presented (i.e., median times were calculated for each rat, and the group means and SEM are shown). Older rats were slower than younger rats to complete one trial (Fig. 2C, left plot; 36 ± 5 s and 20 ± 2 s, respectively; t(8) = 3.45, p < 0.01). Moreover, older rats kept on pressing the lever longer than the younger rats after the presentation of the imperative stimulus (Go stimulus), indicating that they should travel across the box and make a head-entry response into one of the reward ports (2 ± 0.6 s and 0.6 ± 0.3 s for older and younger rats, respectively; t(8) = 2.63, p < 0.05; Fig. 2C, left plot, “extra time spent at lever”). The fact that older rats spent more time than younger rats at the lever after the Go stimulus at this early stage in training suggests that differences in time spent at the different components of the task later in training cannot be simply accounted for by the effect of earlier schedules of training.
Behavioral performance during neural recordings
Percentage correct trials did not differ between younger and older rats in the visually-guided trials (91 and 96%, respectively; two-sample t test, t(4) = 0.7, p = 0.521). In the memory-guided trials, there was a trend for better performance by the younger rats compared with the older rats (77 and 61%, respectively; two-sample t test, t(4) = 2.56, p = 0.063), but with a small magnitude of the difference (∼15%). What was prominent, however, was the difference in time spent at the different components of the task, similarly to what was observed at the end of training (Fig. 2C, right plot). In Figure 2C, the average time spent on each component was calculated from times of lever presses and head entries into the reward ports that were recorded automatically. The size of the circles and thickness of the arrows are proportional to time spent in each part of the task, and show the inflated times among older rats compared with younger rats.
Video recordings of rats performing the memory-guided task were analyzed for sessions with neural recordings (first 30 trials of each session) to determine whether (1) older rats took longer to stop lever pressing and start turning toward the reward ports, (2) whether they turned slower from facing the lever to facing the reward ports, and (3) whether or not older rats moved more slowly to the reward ports. The onset of movement toward the reward ports was measured from the moment in which the rats were first oriented toward the ports and ended when they broke the photo beam inside one of the ports. Older rats wasted time pressing the lever after the Go stimulus (Fig. 2D; “Initiate turn”), took longer than younger rats to orient their bodies toward the reward ports (“Turn”), and moved more slowly (an average 33% increase in time) to the reward ports (“Move”). In contrast, younger rats immediately started the moving sequence toward the reward ports when the Go stimulus was presented.
In summary, younger and older rats performed the two behavioral tasks with a similar success rate in general (similar percentage correct trials), but older rats took longer to complete each trial and transition between the different requirements in the tasks. They performed at a slower pace, perseverating on pressing the lever after the Go stimulus and licking on dry spouts long after fluid delivery.
Neural recordings
Single neurons from mPFC were recorded in three younger and three older rats (recording sites are shown in Fig. 1C). Neural data were analyzed for two sessions from each rat, giving a database with 106 neurons (63 from younger rats and 43 from older rats; 4–12 clearly resolved single units recorded per rat per session). In general, average firing rate (median firing rate: younger rats, 3.9 spikes/s; older rats, 1.9 spikes/s; rank sum test: p < 0.02) but not variability (median coefficient of variation: younger rats, 1.3; older rats, 1.4; rank sum test: p > 0.14) was reduced in older rats compared with younger rats. However, we did not observe the same difference in a separate cohort of younger and older rats trained in a simple reaction time procedure, even though mPFC neurons from younger and older rats showed clear modulation to the task events in that procedure (M. S. Caetano and M. Laubach, unpublished observations).
Neural sensitivity to spatial and temporal aspects of the delayed response tasks
First, sensitivity of neural activity was examined for effects of space (left vs right reward port entry; Fig. 3A) at the reward ports using a regression analysis. A similar fraction of neurons from younger and older rats was sensitive to the spatial location around the time of a reward-port entry (Fig. 3B). Between 20 and 40% of all recorded cells in both groups fired differently around the time of port entry depending on whether the rats entered the left or right reward ports. Figure 3C shows the F statistic for the spatially sensitive neurons. The similarity in the curves between younger and older rats suggest that, in addition to the fraction of cells, the magnitude of the change in neural activity as a function of space was also similar between groups. Figure 3D shows examples of a neuron from a younger (top) and an older rat (bottom) that were sensitive to space. Raster plots and peri-event histograms are plotted around the time of entry into the left or right reward ports. The time during which fluid was delivered is represented by the gray lines below the rasters. These space-sensitive neurons fired more when the rat entered the right port compared with the left port.
Figure 3.
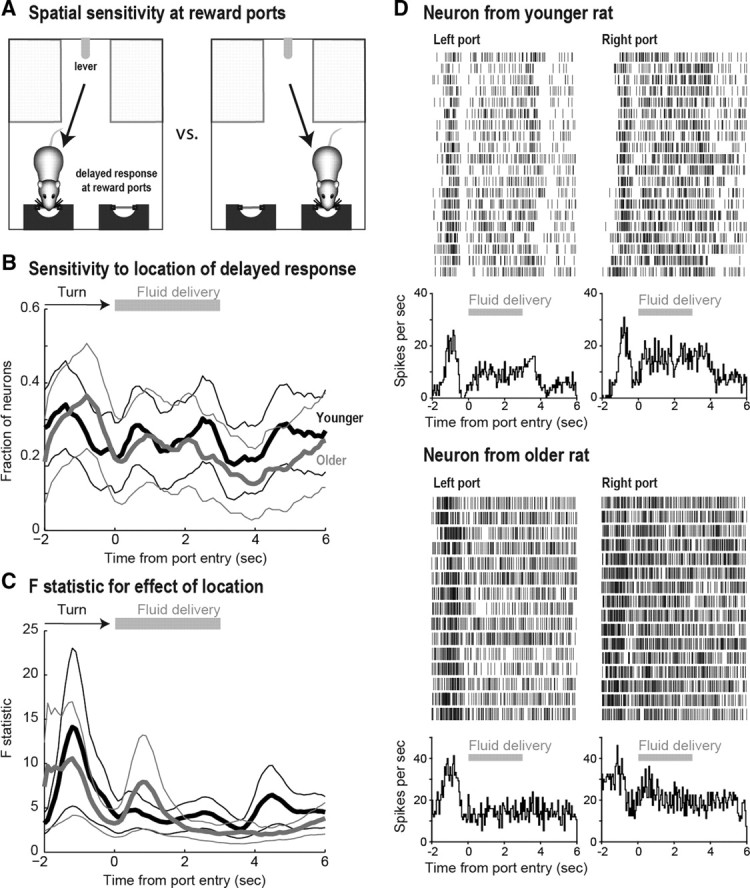
A, A sensitivity analysis was performed to identify changes in firing rate as a function of left versus right reward port entry. B, A similar fraction of neurons were sensitive to the location of the head-entry response in younger (black lines) and older (gray lines) rats around the time of port entry (thinner lines are 95% confidence intervals). The period in which the rat turns toward the ports and fluid delivery are represented at the top of the figure. C, The F statistic for the effect of spatial location on firing rate around the time of port entry is shown for younger (black lines) and older (gray lines) rats. This statistic represents the magnitude of the change in firing rates, which was similar between groups. D, Examples of space-sensitive neurons for a younger (top) and older (bottom) rat at the reward ports. These cells fired more when the rats entered the right port compared with the left port.
Although a large fraction of neurons were space-sensitive at the reward ports, for most neurons spatial information was not maintained during the delay period when rats were at the lever (Fig. 4A). Space at the lever was defined as travel from the left versus right reward port, so any sensitivity to space at the lever suggests lasting effects of spatial information over the delay period. The fraction of space-sensitive neurons decreased equally for younger and older rats from an average of ∼25% at the reward ports (Fig. 4B, dotted lines) to ∼10% at the lever (Fig. 4B, solid lines). Moreover, the magnitude of the changes in neural activity of those spatially sensitive neurons (Fig. 4C) was greatly reduced compared with the changes observed around entry into the reward ports (Fig. 3C), as exemplified by the modest changes in two spatially sensitive neurons depicted in Figure 4D, one from a younger rat (top) and one from an older rat (bottom). The interval comprising the delay period is represented by the gray lines below the rasters.
Figure 4.

A, Sensitivity analysis for spatial location (from left vs from right) at the lever during the delay period. B, Although a similar fraction of neurons were sensitive to the previous location of the head-entry response in younger (black lines) and older (gray lines) rats around the delay period, the overall fraction of space-sensitive cells decreased during the delay period compared with the moment at which the rats were at the reward ports (dotted lines). C, The magnitude of the effect of previous location on firing rate is shown for younger (black lines) and older (gray lines) rats. The magnitude of the already lower fractions of space-sensitive cells was greatly reduced compared with the analysis around port entry (Fig. 3C). D, Examples of space-sensitive neurons for a younger (top) and older (bottom) rat at the lever. The top cell fired less when the rat approached the lever from the left reward port than from the right reward port, while the bottom cell showed the opposite pattern.
Neural sensitivity to the Go stimulus
At the end of the delay period, a lever press terminated the light above the lever and turned on a light above the reward ports (i.e., Go stimulus) (Fig. 5A,B). As this imperative stimulus should have maintained rapid responding at the reward ports, we expected to find many neurons in mPFC that were modulated by the stimulus. Indeed, >55% of the recorded neurons from younger rats showed significant changes in firing rate around the Go stimulus (assessed using a signed rank test of spike counts in 0.5 s windows before and after the stimulus). However, only 25% of neurons from older rats were modulated by the Go stimulus (Fig. 5C, left plot). Examples of two stimulus-modulated neurons from younger rats are shown on the right in Figure 5C. The first neuron increased its firing rate at the stimulus, while the second neuron showed the opposite pattern. Figure 5D shows changes in firing rate around the Go stimulus for each single unit recorded from younger (top) and older rats (bottom). Trial-averaged firing rates, based on spike density functions with an effective bin of 50 ms, are shown with firing rate represented using false color. Firing rates are centered on the time of the Go stimulus and sorted by peak latencies in firing rate during the period after the stimulus (from 0 to 1 s). As summarized in Figure 5C, more neurons from younger rats showed changes in firing rate around the stimulus compared with the neurons from older rats, and the difference in firing rates around the stimulus was larger for cells from younger animals (5.85 ± 0.98 spikes per second, mean ± SEM) compared with cells from older animals (2.63 ± 0.51 spikes per second).
Figure 5.

A, Responses to the Go stimulus were analyzed to examine the hypothesis that neurons in older rats lacked responses to the stimuli that indicated the need to “get on with the task.” B, Behavioral data during performance in memory-guided trials. Blue ticks indicate lever presses, red ticks indicate pump activations, and black ticks indicate licks to the spout. Trials (rows) are sorted by latency to reach one of the reward ports. The gray band denotes the period (±0.5 s around the Go stimulus) used in the signed rank test for changes in firing rate. C, A larger fraction of neurons from younger rats showed significant changes in firing rates around the time of the Go stimulus compared with cells from older rats (0.55 and 0.25, respectively; left plot). Two examples of neurons that showed modulation by the Go stimulus are shown on the right plots. The first cell increased its firing rate immediately after the Go stimulus (center plot), while the second cell showed the opposite pattern (right plot). The gray bands denote the period of firing rate analysis. D, Firing rates (Z-scores) of each recorded neuron from younger (top) and older rats (bottom) around the time of the Go stimulus. Units are sorted by the time of firing rate change from a change point analysis. Neurons from younger rats showed a clear change in firing rate around the Go stimulus, while neurons from older rats showed diminished modulations by the stimulus.
Figure 6A shows the fraction (top) and magnitude of change (bottom) of space-sensitive neurons around the time of the Go stimulus for younger (black lines) and older (gray lines) rats. All recorded neurons from younger and older rats were evaluated for spatial sensitivity. A similar fraction of neurons were space-sensitive between groups, and the magnitude of the change (F statistic) in neural activity around the Go stimulus as a function of space was comparable across cells from younger and older rats.
Figure 6.

A, Similar sensitivity to spatial location (from left reward port vs from right reward port) among all recorded neurons from younger (black lines) and older rats (gray lines) around the time of the Go stimulus. The top panel shows the fraction of spatially sensitive neurons, and the bottom panel shows the magnitude of the modulation in those cells. B, Effects of the upcoming latency between the Go stimulus and the first head entry into a reward port on firing rate of neurons from younger (black lines) and older rats (gray lines). Although a similar fraction of latency-sensitive neurons was observed between younger and older rats (top), the magnitude of the modulation by neurons from older rats was greatly diminished compared with cells from younger rats (bottom). C, The left raster and peri-event histogram shows a latency-sensitive neuron from a younger rat. It shows a clear change in firing rate around the time of the Go stimulus. The right plot shows activity of the neuron with the largest F statistic across all older rats for the change in firing rate around the Go stimulus.
Figure 6B shows the fraction (top) and magnitude of change (bottom) of cells that were sensitive to the upcoming latency between the Go stimulus and the first entry into a reward port. Approximately 20% of the recorded cells fired differently as a function of the upcoming latency in younger and older rats. However, the magnitude of the change in neural activity as a function of latency around the Go stimulus was higher in neurons from younger rats compared with older rats.
Raster plots and peri-event histograms for two neurons that showed modulation in firing rate after the Go stimulus are shown in Figure 6C. Trials are sorted by latency to reach the reward ports (gray ticks). Although the neuron from the older rat shown on the right plot is the one with the highest F statistic for changes in firing rate around the Go stimulus, the magnitude of the change is much smaller compared with the neuron from a younger rat shown on the left. Interestingly, although many neurons were modulated by the Go stimulus, we found no neurons with clear evoked responses by the extinguishing of the light above the reward ports and illumination of the light above the lever, which indicated that the rats should leave the reward ports and move toward the lever.
Given those effects associated with the Go stimulus at the single unit level, we assessed possible effects of the imperative stimulus at the level of population activity and with regard to fluctuations in ongoing and evoked field potentials, as described below.
Aging-related effects on population activity in mPFC
We used PCA, as in Narayanan and Laubach (2009), to examine population activity associated with the Go stimulus and locomotion to the reward ports for neurons from younger and older rats. Populations of neurons from older rats were less sensitive to the Go stimulus compared with neurons from younger rats. The analysis was based on a data matrix comprised of the average spike density functions for all neurons recorded from both younger and older rats (Fig. 7A). The top plot in Figure 7B shows the two leading modes of temporal variation found in neurons from younger rats using PCA. The first component, PC1, accounted for 21.1% of the variance in firing rates and showed modulation after the Go stimulus through the period of sucrose consumption (2–4 s later). The second component, PC2, accounted for 16.7% of variance and showed a modulation immediately after the presentation of the Go stimulus, with a timing similar to the change in firing rates shown in Figure 5D. This stimulus-related component was reduced for PC2 from the older rats (Fig. 7B, bottom plot). This finding suggests that the stimulus-responsive component was a major determining factor for shaping neural activity in the mPFC of the younger, but not the older animals. Moreover, when the variance accounted for by each of the first 20 PCs was plotted for neurons from younger and older rats, there was only one PC with a large variance in the matrix for the older rats, as opposed to two large PCs in the matrix for the younger rats (Fig. 7C).
Examples of neurons with the largest loadings onto PCs 1 and 2 are shown in Figure 7D. Younger and older neurons that were related to PC1 fired in similar patterns (top plots). However, firing patterns for neurons from older rats that were related to PC2 (which showed a transient response to the Go stimulus) were dramatically reduced (bottom plots). In fact, no neuron from an older rat showed a large increase in firing rate around the time of the Go stimulus, as observed in neurons from younger rats (Fig. 7D, bottom, left plot).
Aging-related effects on network activity in mPFC
Further evidence for the reduced modulation of neurons from older rats to the instructive Go stimulus was found in recordings of LFPs. Figure 8A shows LFP recordings from 10 consecutive trials for an electrode in the mPFC of one younger (left plot) and one older (right plot) rat. LFPs are shown around the period of the Go stimulus. The LFPs from the younger rat show clear modulations around the onset of the stimulus, while the LFPs from the older rat show, instead, modulations around the time of travel to the reward ports (1–3 s after the Go stimulus). Power spectral densities for younger and older rats, during the same 10 trials, are shown in Figure 8B. Both groups show prominent oscillations in the 4–8 Hz range, but at different times, as shown in Figure 8A.
The lack of LFP modulation by the Go stimulus was also observed in ERSPs (Fig. 8C). In younger rats, the event-related power was most prominent at the onset of the Go stimulus, while for the older rats it was most prominent during travel to the reward ports. This finding was apparent in single LFP recordings (Fig. 8C) and also in grand averages for all LFPs recorded in each rat (Fig. 8D). The magenta lines indicate, from left to right, the time of the Go stimulus, the average time in which the younger rats reached the reward ports, and the average time in which the older rats arrived at the reward ports.
Discussion
The goal of this study was to address changes in the functional properties of neurons in the mPFC of aged animals that could explain behavioral findings in human and animal studies of cognitive aging. Our initial hypothesis was that there would be a reduction in the ability of mPFC ensembles to maintain spatial information in working memory, and for this reason older rats would require more time to deliberate over spatial responding in our operant delayed alternation task. This expectation was based on a report of maintained spatial encoding in the rodent mPFC during the delay period in a maze-based delayed response task (Poucet, 1997; Jung et al., 1998; Chang et al., 2002; Baeg et al., 2003; Euston and McNaughton, 2006). However, we found no evidence for differences in the spatial coding properties of mPFC neurons in our younger and older animals. Notably, we found that only a few neurons showed evidence for the maintenance of spatial information during the delay period in our task (Fig. 4), a result that is congruent with Jung et al. (1998).
Our study revealed major changes in the time taken for older rats to complete trials in the delayed response task, without any evidence of problems in spatial processing. Our older animals performed the task at a slower pace by taking longer to transition between the different components of the task and by perseverating in nonessential behaviors, such as licking on spouts beyond the period of reward delivery and pressing on the lever despite the presence of an imperative stimulus indicating availability of potential rewards. This result was reminiscent of a study of human aging by Craik and Bialystok (2006). These behavioral changes were associated with reductions in modulations in the firing rates of mPFC neurons around the imperative Go stimulus (Figs. 5–8) and reduced encoding of response latency information during the delay period (Fig. 6). Our older rats showed reduced sensitivity to the Go stimulus at three levels of neural activity: reduced fractions of neurons with changes in firing rate around the stimulus (Fig. 5), reduced correlation over neurons at the time of the stimulus as measured with population activity analysis (PCA) (Fig. 7), and reduced amplitudes of event-related fluctuations in intracortical field potentials at the time of the stimulus (Fig. 8).
While we found many neurons with clear modulations due to the Go stimulus (which instructed rats to travel from the lever to the reward ports), we found no neurons with responses that were evoked by extinguishing of the light above the reward ports or illumination of the light above the lever. This period, however, was confounded with the consumption of the liquid sucrose, which was the primary focus of the rats when the Go stimulus turned off and when the lever-related stimulus was presented.
Our older rats became “stuck” in specific components of the tasks (Fig. 2), and were relatively insensitive to an imperative cue that indicated the need to move to the next behavioral component, which is similar to what is found when mPFC is reversibly inactivated during the performance of an operant delayed response task. Horst and Laubach (2009) found that injections of muscimol into the mPFC of young rats resulted in alterations in behavioral pace and a slowing of reward collection. Moreover, studies in monkeys (Chen et al., 1995; Thaler et al., 1995) and humans (Stuss et al., 2003) have also found alterations in pace following damage in mPFC, and the control of action timing is known to be reduced in normal human aging (West et al., 2002). These findings, together with the neural recording data reported in the present manuscript, suggest that aging reduces the ability of older subjects to stay on task and leads to a reduced capacity of the aged PFC to process time-sensitive information.
One potential interpretation for our finding of reduced neural responding to the visual Go stimulus is that the older rats had impaired vision. We do not think that this explanation is sufficient to explain the full set of results reported in this study. First, we found no issues with the ability of the aged rats to respond in the visually-guided blocks of trials. They performed as well as the younger animals, and were able to respond at the correct locations and correct impending errors in memory-guided trials. Second, we found a lack of neural activity associated with rats' response latencies from a period preceding the Go stimulus. This effect appears to be typical of preparatory signals commonly found in PFC and is not simply explained by an impairment in visual processing. Third, the rats also spent too much time engaged in licking the reward spouts, continuing to lick for many seconds after fluid delivery termination. This behavior added to the time taken for the rats to complete each trial and, as in the case of the effect of the Go stimulus, likely also involved a reduction in the temporal control of action. This finding is hard to reconcile with the view that behavioral slowing in the delayed response task is due to impairments in visual processing.
Another potential alternative interpretation for our findings is that the older rats had motor impairments that resulted in their slower pace in the task. Several of our findings do not support this interpretation. First, video analysis of movement data showed that excessive time between trials was mostly due to animals remaining engaged in lever pressing and licking on the spouts and not to major differences in the time taken for rats to move from one side of the box to the other (Fig. 2). Second, the main neural differences between the younger and older rats were associated with the presentation of the Go stimulus and activity that preceded the stimulus and varied with the subsequent response latency. These findings suggest issues with the ability of the stimulus to bring about a change in behavior and not with motor processing per se.
A final potential alternative interpretation for our findings is that older rats struggled with maintaining task performance and had to exert more effort than younger rats to continuously perform the task. This is an important issue as effort-based decision making has been shown to depend on mPFC activity (Walton et al., 2006). However, as in the case of the motor interpretation discussed above, it is difficult to reconcile a purely effort-based interpretation with our main findings. There is no clear rationale from an effort-based perspective for how effort would alter neural responses to the Go stimulus (Figs. 5–8) or reduce the encoding of forthcoming response latencies during the later stages of the delay period (Fig. 6).
A more likely explanation is that these aging-related changes were due to abnormal “gating” of control signals (Braver and Barch, 2002), possibly received from ascending modulatory systems. There is evidence for aging-related reductions in monoaminergic control of several key neuromodulatory systems that influence the mPFC. For example, there is an aging-related reduction in the innervations of locus coeruleus neurons by terminals from orexin neurons in the hypothalamus (Downs et al., 2007), and both groups of these cells also project to mPFC. As a result, the aged mPFC could lack the ability to control levels of behavioral activation and/or arousal, which can be modulated by stimulation of α-2 adrenergic receptors (Carlson et al., 1992; Sirviö et al., 1994). Also, dopamine signaling could contribute to aging-related slowing, as levels of dopamine are reduced with normal aging (Goldman-Rakic and Brown, 1981; Wenk et al., 1989; Volkow et al., 1998) and are correlated with deficits in performance in spatial tasks (Luine et al., 1990; Lee et al., 1994) and speeded motor performance (Emborg et al., 1998; van Dyck et al., 2008).
The hippocampus is another brain system that could contribute to the processing of temporal information by mPFC. There are massive projections from the hippocampus to mPFC, especially from the ventral portion of the hippocampus (Jay et al., 1989). Moreover, neurons in mPFC are phase-locked to hippocampal theta oscillations during spatial behavior (Hyman et al., 2005; Jones and Wilson, 2005; Siapas et al., 2005) and hippocampal ensembles are sensitive to temporal information during spatial memory performance (Dragoi and Buzsáki, 2006) and during configural learning (DeVito and Eichenbaum, 2010). Most relevant, hippocampal networks in aged animals lack sensitivity to external stimuli during learning (Rosenzweig et al., 2003) and lack recurrent processing (“replay”) of recent experiences (Gerrard et al., 2008).These replay events are also found in mPFC (Euston et al., 2007) and reflect precisely timed interactions between pyramidal cells and interneurons in mPFC (Fujisawa et al., 2008; Benchenane et al., 2010). The lack of normal replay events in the mPFC of older animals during the performance of our delayed response task might explain aging-related slowing of task performance as perhaps without a normal replay activity system it could be harder for the rats to retrieve the next behavioral component of the task.
Footnotes
This work was supported by Public Health Service Grant PO1AG030004 from the National Institute on Aging (A.F.T.A. and M.L.) and by AFAR/Ellison Medical Foundation Postdoctoral Fellowship (M.S.C.).
References
- Arnsten et al., 2010.Arnsten AF, Paspalas CD, Gamo NJ, Yang Y, Wang M. Dynamic network connectivity: a new form of neuroplasticity. Trends Cogn Sci. 2010;14:365–375. doi: 10.1016/j.tics.2010.05.003. [DOI] [PMC free article] [PubMed] [Google Scholar]
- Baeg et al., 2003.Baeg EH, Kim YB, Huh K, Mook-Jung I, Kim HT, Jung MW. Dynamics of population code for working memory in the prefrontal cortex. Neuron. 2003;40:177–188. doi: 10.1016/s0896-6273(03)00597-x. [DOI] [PubMed] [Google Scholar]
- Benchenane et al., 2010.Benchenane K, Peyrache A, Khamassi M, Tierney PL, Gioanni Y, Battaglia FP, Wiener SI. Coherent theta oscillations and reorganization of spike timing in the hippocampal- prefrontal network upon learning. Neuron. 2010;66:921–936. doi: 10.1016/j.neuron.2010.05.013. [DOI] [PubMed] [Google Scholar]
- Braver and Barch, 2002.Braver TS, Barch DM. A theory of cognitive control, aging cognition, and neuromodulation. Neurosci Biobehav Rev. 2002;26:809–817. doi: 10.1016/s0149-7634(02)00067-2. [DOI] [PubMed] [Google Scholar]
- Brennan and Conigrave, 2009.Brennan SC, Conigrave AD. Regulation of cellular signal transduction pathways by the extracellular calcium-sensing receptor. Curr Pharm Biotechnol. 2009;10:270–281. doi: 10.2174/138920109787847484. [DOI] [PubMed] [Google Scholar]
- Carlson et al., 1992.Carlson S, Tanila H, Räma P, Mecke E, Pertovaara A. Effects of medetomidine, an alpha-2 adrenoceptor agonist, and atipamezole, an alpha-2 antagonist, on spatial memory performance in adult and aged rats. Behav Neural Biol. 1992;58:113–119. doi: 10.1016/0163-1047(92)90327-z. [DOI] [PubMed] [Google Scholar]
- Chang et al., 2002.Chang JY, Chen L, Luo F, Shi LH, Woodward DJ. Neuronal responses in the frontal cortico-basal ganglia system during delayed matching-to-sample task: ensemble recording in freely moving rats. Exp Brain Res. 2002;142:67–80. doi: 10.1007/s00221-001-0918-3. [DOI] [PubMed] [Google Scholar]
- Chang et al., 2005.Chang YM, Rosene DL, Killiany RJ, Mangiamele LA, Luebke JI. Increased action potential firing rates of layer 2/3 pyramidal cells in the prefrontal cortex are significantly related to cognitive performance in aged monkeys. Cereb Cortex. 2005;15:409–418. doi: 10.1093/cercor/bhh144. [DOI] [PubMed] [Google Scholar]
- Chen et al., 1995.Chen YC, Thaler D, Nixon PD, Stern CE, Passingham RE. The functions of the medial premotor cortex. II. The timing and selection of learned movements. Exp Brain Res. 1995;102:461–473. doi: 10.1007/BF00230650. [DOI] [PubMed] [Google Scholar]
- Craik and Bialystok, 2006.Craik FI, Bialystok E. Planning and task management in older adults: cooking breakfast. Mem Cognit. 2006;34:1236–1249. doi: 10.3758/bf03193268. [DOI] [PubMed] [Google Scholar]
- Delorme and Makeig, 2004.Delorme A, Makeig S. EEGLAB: an open source toolbox for analysis of single-trial EEG dynamics. J Neurosci Methods. 2004;134:9–21. doi: 10.1016/j.jneumeth.2003.10.009. [DOI] [PubMed] [Google Scholar]
- DeVito and Eichenbaum, 2010.DeVito LM, Eichenbaum H. Distinct contributions of the hippocampus and medial prefrontal cortex to the “what-where-when” components of episodic-like memory in mice. Behav Brain Res. 2010;215:318–325. doi: 10.1016/j.bbr.2009.09.014. [DOI] [PMC free article] [PubMed] [Google Scholar]
- Disterhoft and Oh, 2006.Disterhoft JF, Oh MM. Learning, aging and intrinsic neuronal plasticity. Trends Neurosci. 2006;29:587–599. doi: 10.1016/j.tins.2006.08.005. [DOI] [PubMed] [Google Scholar]
- Downs et al., 2007.Downs JL, Dunn MR, Borok E, Shanabrough M, Horvath TL, Kohama SG, Urbanski HF. Orexin neuronal changes in the locus coeruleus of the aging rhesus macaque. Neurobiol Aging. 2007;28:1286–1295. doi: 10.1016/j.neurobiolaging.2006.05.025. [DOI] [PubMed] [Google Scholar]
- Dragoi and Buzsáki, 2006.Dragoi G, Buzsáki G. Temporal encoding of place sequences by hippocampal cell assemblies. Neuron. 2006;50:145–157. doi: 10.1016/j.neuron.2006.02.023. [DOI] [PubMed] [Google Scholar]
- Emborg et al., 1998.Emborg ME, Ma SY, Mufson EJ, Levey AI, Taylor MD, Brown WD, Holden JE, Kordower JH. Age-related declines in nigral neuronal function correlate with motor impairments in rhesus monkeys. J Comp Neurol. 1998;401:253–265. [PubMed] [Google Scholar]
- Euston and McNaughton, 2006.Euston DR, McNaughton BL. Apparent encoding of sequential context in rat medial prefrontal cortex is accounted for by behavioral variability. J Neurosci. 2006;26:13143–13155. doi: 10.1523/JNEUROSCI.3803-06.2006. [DOI] [PMC free article] [PubMed] [Google Scholar]
- Euston et al., 2007.Euston DR, Tatsuno M, McNaughton BL. Fast-forward playback of recent memory sequences in prefrontal cortex during sleep. Science. 2007;318:1147–1150. doi: 10.1126/science.1148979. [DOI] [PubMed] [Google Scholar]
- Fujisawa et al., 2008.Fujisawa S, Amarasingham A, Harrison MT, Buzsáki G. Behavior-dependent short-term assembly dynamics in the medial prefrontal cortex. Nat Neurosci. 2008;11:823–833. doi: 10.1038/nn.2134. [DOI] [PMC free article] [PubMed] [Google Scholar]
- Gerrard et al., 2008.Gerrard JL, Burke SN, McNaughton BL, Barnes CA. Sequence reactivation in the hippocampus is impaired in aged rats. J Neurosci. 2008;28:7883–7890. doi: 10.1523/JNEUROSCI.1265-08.2008. [DOI] [PMC free article] [PubMed] [Google Scholar]
- Goldman-Rakic and Brown, 1981.Goldman-Rakic PS, Brown RM. Regional changes of monoamines in cerebral cortex and subcortical structures of aging rhesus monkeys. Neuroscience. 1981;6:177–187. doi: 10.1016/0306-4522(81)90053-1. [DOI] [PubMed] [Google Scholar]
- Grill and Riddle, 2002.Grill JD, Riddle DR. Age-related and laminar-specific dendritic changes in the medial frontal cortex of the rat. Brain Res. 2002;937:8–21. doi: 10.1016/s0006-8993(02)02457-5. [DOI] [PubMed] [Google Scholar]
- Horst and Laubach, 2009.Horst NK, Laubach M. The role of rat dorsomedial prefrontal cortex in spatial working memory. Neuroscience. 2009;164:444–456. doi: 10.1016/j.neuroscience.2009.08.004. [DOI] [PMC free article] [PubMed] [Google Scholar]
- Hyman et al., 2005.Hyman JM, Zilli EA, Paley AM, Hasselmo ME. Medial prefrontal cortex cells show dynamic modulation with the hippocampal theta rhythm dependent on behavior. Hippocampus. 2005;15:739–749. doi: 10.1002/hipo.20106. [DOI] [PubMed] [Google Scholar]
- Jay et al., 1989.Jay TM, Glowinski J, Thierry AM. Selectivity of the hippocampal projection to the prelimbic area of the prefrontal cortex in the rat. Brain Res. 1989;505:337–340. doi: 10.1016/0006-8993(89)91464-9. [DOI] [PubMed] [Google Scholar]
- Jones and Wilson, 2005.Jones MW, Wilson MA. Phase precession of medial prefrontal cortical activity relative to the hippocampal theta rhythm. Hippocampus. 2005;15:867–873. doi: 10.1002/hipo.20119. [DOI] [PubMed] [Google Scholar]
- Jung et al., 1998.Jung MW, Qin Y, McNaughton BL, Barnes CA. Firing characteristics of deep layer neurons in prefrontal cortex in rats performing spatial working memory tasks. Cereb Cortex. 1998;8:437–450. doi: 10.1093/cercor/8.5.437. [DOI] [PubMed] [Google Scholar]
- Kimchi et al., 2009.Kimchi EY, Torregrossa MM, Taylor JR, Laubach M. Neuronal correlates of instrumental learning in the dorsal striatum. J Neurophysiol. 2009;102:475–489. doi: 10.1152/jn.00262.2009. [DOI] [PMC free article] [PubMed] [Google Scholar]
- Lee et al., 1994.Lee JM, Ross ER, Gower A, Paris JM, Martensson R, Lorens SA. Spatial learning deficits in the aged rat: neuroanatomical and neurochemical correlates. Brain Res Bull. 1994;33:489–500. doi: 10.1016/0361-9230(94)90073-6. [DOI] [PubMed] [Google Scholar]
- Lipman et al., 1996.Lipman RD, Chrisp CE, Hazzard DG, Bronson RT. Pathologic characterization of Brown Norway, Brown Norway x Fischer 344, and Fischer 344 x Brown Norway rats with relation to age. J Gerontol (A Biol Sci Med Sci) 1996;51:B54–B59. doi: 10.1093/gerona/51A.1.B54. [DOI] [PMC free article] [PubMed] [Google Scholar]
- Luine et al., 1990.Luine V, Bowling D, Hearns M. Spatial memory deficits in aged rats: contributions of monoaminergic systems. Brain Res. 1990;537:271–278. doi: 10.1016/0006-8993(90)90368-l. [DOI] [PubMed] [Google Scholar]
- Narayanan and Laubach, 2006.Narayanan NS, Laubach M. Top-down control of motor cortex ensembles by dorsomedial prefrontal cortex. Neuron. 2006;52:921–931. doi: 10.1016/j.neuron.2006.10.021. [DOI] [PMC free article] [PubMed] [Google Scholar]
- Narayanan and Laubach, 2009.Narayanan NS, Laubach M. Delay activity in rodent frontal cortex during a simple reaction time task. J Neurophysiol. 2009;101:2859–2871. doi: 10.1152/jn.90615.2008. [DOI] [PMC free article] [PubMed] [Google Scholar]
- Niki and Watanabe, 1979.Niki H, Watanabe M. Prefrontal and cingulate unit activity during timing behavior in the monkey. Brain Res. 1979;171:213–224. doi: 10.1016/0006-8993(79)90328-7. [DOI] [PubMed] [Google Scholar]
- Peters et al., 2008.Peters A, Sethares C, Luebke JI. Synapses are lost during aging in the primate prefrontal cortex. Neuroscience. 2008;152:970–981. doi: 10.1016/j.neuroscience.2007.07.014. [DOI] [PMC free article] [PubMed] [Google Scholar]
- Poucet, 1997.Poucet B. Searching for spatial unit firing in the prelimbic area of the rat medial prefrontal cortex. Behav Brain Res. 1997;84:151–159. doi: 10.1016/s0166-4328(96)00144-1. [DOI] [PubMed] [Google Scholar]
- Ramos et al., 2003.Ramos BP, Birnbaum SG, Lindenmayer I, Newton SS, Duman RS, Arnsten AF. Dysregulation of protein kinase a signaling in the aged prefrontal cortex: new strategy for treating age-related cognitive decline. Neuron. 2003;40:835–845. doi: 10.1016/s0896-6273(03)00694-9. [DOI] [PubMed] [Google Scholar]
- Rosenzweig et al., 2003.Rosenzweig ES, Redish AD, McNaughton BL, Barnes CA. Hippocampal map realignment and spatial learning. Nat Neurosci. 2003;6:609–615. doi: 10.1038/nn1053. [DOI] [PubMed] [Google Scholar]
- Siapas et al., 2005.Siapas AG, Lubenov EV, Wilson MA. Prefrontal phase locking to hippocampal theta oscillations. Neuron. 2005;46:141–151. doi: 10.1016/j.neuron.2005.02.028. [DOI] [PubMed] [Google Scholar]
- Sirviö et al., 1994.Sirviö J, Lahtinen H, Riekkinen P, Jr, Riekkinen PJ. Spatial learning and noradrenaline content in the brain and periphery of young and aged rabbits. Exp Neurol. 1994;125:312–315. doi: 10.1006/exnr.1994.1035. [DOI] [PubMed] [Google Scholar]
- Stuss et al., 2003.Stuss DT, Murphy KJ, Binns MA, Alexander MP. Staying on the job: the frontal lobes control individual performance variability. Brain. 2003;126:2363–2380. doi: 10.1093/brain/awg237. [DOI] [PubMed] [Google Scholar]
- Thaler et al., 1995.Thaler D, Chen YC, Nixon PD, Stern CE, Passingham RE. The functions of the medial premotor cortex. I. Simple learned movements. Exp Brain Res. 1995;102:445–460. doi: 10.1007/BF00230649. [DOI] [PubMed] [Google Scholar]
- van Dyck et al., 2008.van Dyck CH, Avery RA, MacAvoy MG, Marek KL, Quinlan DM, Baldwin RM, Seibyl JP, Innis RB, Arnsten AF. Striatal dopamine transporters correlate with simple reaction time in elderly subjects. Neurobiol Aging. 2008;29:1237–1246. doi: 10.1016/j.neurobiolaging.2007.02.012. [DOI] [PMC free article] [PubMed] [Google Scholar]
- Volkow et al., 1998.Volkow ND, Wang GJ, Fowler JS, Ding YS, Gur RC, Gatley J, Logan J, Moberg PJ, Hitzemann R, Smith G, Pappas N. Parallel loss of presynaptic and postsynaptic dopamine markers in normal aging. Ann Neurol. 1998;44:143–147. doi: 10.1002/ana.410440125. [DOI] [PubMed] [Google Scholar]
- Walton et al., 2006.Walton ME, Kennerley SW, Bannerman DM, Phillips PE, Rushworth MF. Weighing up the benefits of work: behavioral and neural analyses of effort-related decision making. Neural Netw. 2006;19:1302–1314. doi: 10.1016/j.neunet.2006.03.005. [DOI] [PMC free article] [PubMed] [Google Scholar]
- Wang et al., 2011.Wang M, Gamo NJ, Yang Y, Jin LE, Wang XJ, Laubach M, Mazer JA, Lee D, Arnsten AF. Neuronal basis of age-related working memory decline. Nature. 2011;476:210–214. doi: 10.1038/nature10243. [DOI] [PMC free article] [PubMed] [Google Scholar]
- Wenk et al., 1989.Wenk GL, Pierce DJ, Struble RG, Price DL, Cork LC. Age-related changes in multiple neurotransmitter systems in the monkey brain. Neurobiol Aging. 1989;10:11–19. doi: 10.1016/s0197-4580(89)80005-3. [DOI] [PubMed] [Google Scholar]
- West et al., 2002.West R, Murphy KJ, Armilio ML, Craik FI, Stuss DT. Lapses of intention and performance variability reveal age-related increases in fluctuations of executive control. Brain Cogn. 2002;49:402–419. doi: 10.1006/brcg.2001.1507. [DOI] [PubMed] [Google Scholar]
- Zanto et al., 2011.Zanto TP, Pan P, Liu H, Bollinger J, Nobre AC, Gazzaley A. Age-related changes in orienting attention in time. J Neurosci. 2011;31:12461–12470. doi: 10.1523/JNEUROSCI.1149-11.2011. [DOI] [PMC free article] [PubMed] [Google Scholar]
- Zeileis et al., 2003.Zeileis A, Kleiber C, Krämer W, Hornik K. Testing and dating of structural changes in practice. Comput Stat Data An. 2003;44:109–123. [Google Scholar]