Abstract
Residual dipolar couplings (RDCs) give orientational dependent NMR restraints that improve the resolution of NMR conformational ensembles and define the relative orientation of multidomain proteins and protein complexes. The interpretation of RDCs is complicated by protein dynamics and the intrinsic degeneracy of solutions that lead to ill-defined orientations of the structural domains (ghost orientations). Here, we illustrate how paramagnetic-based restraints can remove the orientational ambiguity of multidomain membrane proteins solubilized in detergent micelles. We tested this approach for the monomeric form of phospholamban (PLN), a 52-residue membrane protein, which is composed of two helical domains connected by a relatively flexible loop. We show that the combination of classical solution NMR restraints (NOEs and dihedral angles) with RDCs and PREs resolve topological ambiguities, improving the convergence of the PLN structural ensemble and giving the depth of insertion of the protein within the micelle. This combined approach will be necessary for membrane proteins, whose three-dimensional structure is strongly influenced by interactions with the membrane-mimicking environment rather than compact tertiary folds common in soluble proteins.
Keywords: Structure Determination, NMR, Membrane Protein Topology, Paramagnetic Relaxation Enhancement, Residual Dipolar Couplings, Detergent Micelles, Phospholamban
INTRODUCTION
Residual dipolar couplings (RDCs) constitute an excellent source of structural and dynamic information 1–4. Their use spans from structural refinement1, 5, 6 to the characterization of unfolded proteins7, 7–11 and excited states of biomolecules12, 13. RDCs are also an invaluable NMR parameter to orient multidomain proteins and protein complexes, where the detection of inter-domain or inter-protein nuclear Overhauser effects (NOEs) are very challenging 4, 14, 15.
However, the inherent degeneracy of RDCs (ghost orientations) complicates the extraction of orientational information16. It was originally thought that the RDC equation resulted in eight-fold degeneracy for peptide plane orientations16, but recently, it was shown that the analytical solution of the RDC equation contains a 16-fold degeneracy 17. This degeneracy is reduced to four if one considers the regular patterns of the dipolar couplings (i.e. dipolar waves) for secondary structure domains 8, 18–22. In favorable cases, this RDC inherent degeneracy is resolved using two or more alignments media23. Nonetheless, local geometry can still be ill-defined17 and further confounded by the presence of conformational dynamics 24–27.
Therefore, a major issue is to eliminate ghost orientations from the true orientations. Bertini and coworkers have proposed the use of paramagnetism-based NMR restraints 28. These authors have developed a new analysis of the paramagnetic-based restraints to give a comprehensive view of the different conformations and dynamics of calmodulin as well as the calmodulin-α-synuclein complex28. A similar approach has been utilized for resolving the solution conformation of the ternary complex of the E. coli Hsp70 chaperone 29.
Membrane proteins solubilized in detergent micelles are not immune to these challenges. Polytopic (integral and/or peripheral) membrane proteins are often organized in multiple domains (independent or partially independent) that facilitate intra- and inter-cellular communication30. Flexibility of protein domains can prevent the formation of compact tertiary structures, which results in the structure being defined by domain interactions with the lipid membrane, i.e. topology31. Several small and medium size membrane proteins involved in regulatory function of ion pumps fall into this category31. While membrane proteins are amenable to modern solution NMR techniques, it is still a challenging task to obtain long-range distance restraints from nuclear Overhauser effect (NOEs) data32, especially for helical membrane proteins. Side chain methyl labeling schemes can help determine the overall fold of membrane proteins, and new protocols have been developed to introduce a variety of different probes on proteins33–35. RDCs constitute a viable alternative to obtaining long-range distance restraints, and accordingly have been an important source of constraints for membrane proteins. To measure RDCs, membrane proteins need to be aligned in an anisotropic media 36–38 or bound to a lanthanide ion either through adventitious sites39 or engineered tags40, 41. In several instances, RDCs were crucial to improving the resolution of the conformational ensemble of membrane proteins solubilized in micelles32, 42, 43.
In this article, we show that the ghost orientations generated after RDC refinement of the detergent solubilized protein phospholamban (PLN) can be eliminated by using paramagnetism-based restraints derived from site-directed spin-labeling using MTSSL (1-oxyl-2,2,5,5-tetramethyl-D3-pyrroline-3-methyl methanethiosulfonate).
MATERIAL AND METHODS
PLN expression, purification, and mutagenesis
The overexpression and purification of AFA-PLN (i.e. cysteine-null monomer, C36A, C41F, C46A) was carried out as described in Buck et al. 44. For the A24C mutant, the plasmid containing fully functional cysteine-null PLN was used as a template to introduce a single point mutation (A24C) by site directed mutagenesis using Quick-change kit (Stratagene, San Diego, CA). PCR was carried out as previously described44. The primers were designed as follows: forward 5′-GCCGCAGCAGTGCCGCCAGAACCTGC-3′, reverse 5′-GCAGGTCTGGCGGCACTGCTGCGGC-3′ (the mutated codon is underlined).
The mutated plasmid was amplified in XL1-blue competent cells (Stratagene, San Diego, CA) and purified using QIAprep Spin kit (Qiagen, Carlsbad, CA). The sequence was confirmed by DNA sequencing (ABI PRISM 3130xl Genetic Analyzer. Biomedical Genomic Center, Minneapolis, MN). BL21(DE3) (Stratagene, San Diego, CA) E. coli cells were transformed with 100 ng of purified plasmid and selected on LB agar plates containing ampicillin (100 mg/mL). The L7C mutant was designed in a similar way. Protein expression and purification were carried out using a combination of affinity chromatography and HPLC 44.
A24C-PLN and L7C-PLN spin-labeling with MTSSL
MTSSL (1-oxyl-2,2,5,5-tetramethyl-D3-pyrroline-3-methyl methanethiosulfonate, Toronto Research Chemicals, North York, ON) spin label reacts with the terminal SH of cysteine residue to form a covalent bond. A stock solution of 200 mM MTSSL in DMF was prepared. The labeling reaction protocol was derived from Kirby et al. 45. One mg of lyophilized A24C-PLN (or L7C-PLN) protein was solubilized in 1 mL of spin labeling buffer (60 mM Tris-HCl at pH 7.0 and 0.2% SDS). The final concentration of PLN was ~0.2 mM. A 10-fold molar excess of MTSSL was added to the reaction mix and incubated overnight at 4 °C in the dark. The unreacted spin label was removed by HPLC with the PLN peak collected and lyophilized after removal of organic solvent. Lyophilized MTSSL spin labeled A24C-PLN (or L7C-PLN) was dissolved in 300 mM DPC, 20 mM phosphate buffer (pH = 6.0, 120 mM NaCl, 0.01% NaN3, and 10% D2O). The final concentration of A24C-PLN was ~0.1 mM.
Sample preparation for RDC measurements
AFA-PLN [U-13C, 15N] was reconstituted into 100 mM deuterated DPC (Cambridge Isotope Laboratories), 25 mM phosphate buffer (pH 6.0), 125 mM NaCl, 10% D2O, and 0.1% NaN3 to give a final protein concentration of ~0.8 mM. The stretched gels were polymerized from a 5.7 mm diameter cylinder under the following conditions: 100 mM Tris-HCl (pH 8.0), 5.1% acrylamide, 1.3% bis-acrylamide, 0.1% ammonium persulfate, and 0.33% TEMED. The gels were thoroughly washed twice with 50 mM NaH2PO4/Na2HPO4 pH 6.5 (8 hr/wash) and then twice with H2O (8 hr/wash) as described previously 46. The protein/detergent mixture was added to the dried polymerized gel and incubated at 37 °C for ~24 hr. After stretching in a 5 mm Shigemi tube, the length of the gel increased by a factor of ~1.7. The stretching apparatus was purchased from New Era Enterprises, Inc. and has been previously described 46.
NMR Spectroscopy
RDC measurements
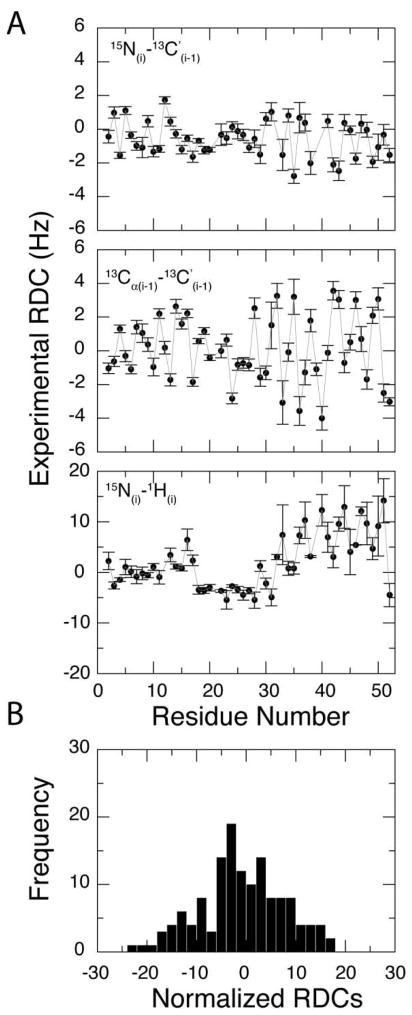
Experiments were carried out at 37 °C using a Varian spectrometer operating at a 1H Larmor frequency of 599.54 MHz. 2D TROSY based (1H, 15N) pulse sequences described by Permi and Annila 47 were performed to measure 13C′-13Cα and 1H-15N one-bond couplings. Each 2D experiment was acquired in the presence and absence of the stretched gel where the difference in splitting allowed for the calculation of the residual dipolar couplings. The total acquisition times in t1 and t2 were 62 and 77 ms with spectral widths of 1300 and 6600 Hz in the 15N and 1H dimensions, respectively. In order to measure the 15N-13C′ one-bond couplings, we performed a 3D uncoupled HNCO experiment in the presence and absence of stretched gel. Experiments utilized 64 scans, spectral widths of 10000 Hz (1H), 1000 Hz (13C) and 1200 Hz (15N) with total acquisition times of 83.2, 40, and 26.7 ms in the 1H, 13C, and 15N dimensions, respectively. Experiments were acquired at 37 °C with a recycle delay of 1.3 s. All data were processed with NMRPipe 48 and viewed using NMRVIEW 49. The 1H-15N, 13C′-15N, and 13C′-13Cα RDCs versus residue are shown Figure 1A.
Figure 1.
RDC versus residue for PLN weakly oriented in stretched gels. (A) Top: 13C′-15N RDCs; middle: 13C′-13Cα RDCs; bottom: 1H-15N RDCs. We reported only the RDC values for well resolved peaks. (B) RDC histogram with all the data in (A) scaled to the 1H-15N RDCs.
PRE measurements
[1H, 15N] heteronuclear single quantum coherence (HSQC) spectra were acquired in the presence of MTSSL (paramagnetic) and the diamagnetic analog at positions 7 and 24 of PLN. The intensity reduction (Iox - diamagnetic, Ired - paramagetic) of the amide resonances were converted into R2sp values and then to distance restraints using Eq. 1 50:
| [1] |
where r is the distance between the nuclear spins and the unpaired electron, τc is the correlation time for the electron/nuclear spin interaction, ωh is the proton Larmor frequency, K is a constant that depends on the gyromagnetic ratio, electronic g factor and the Bohr magneton and is set to 1.23 × 10⁻³² cm6 s−2.
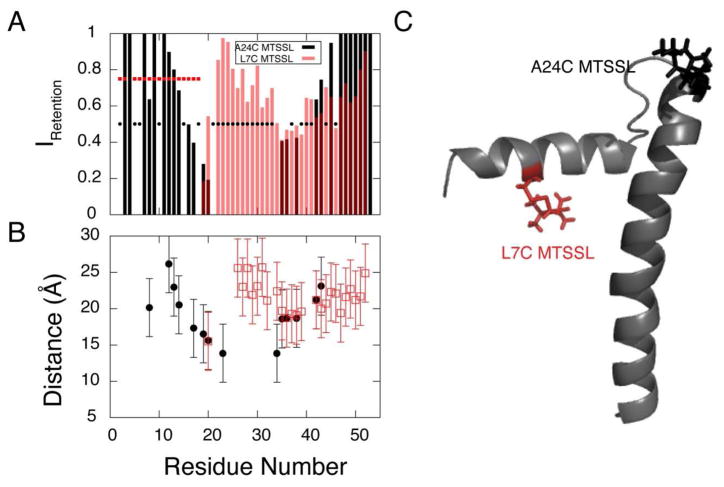
For PLN, we used two different correlation times (τc): 8.2 ns for the cytoplasmic domain and 15.4 ns for the transmembrane domain 51. For peaks with intensity retention greater than 90%, no upper limits were used. For the other peaks, the intensity retentions were converted into distances according to equation [1], and implemented with upper and lower bounds of ± 4 Å 50. The PRE quenching data and the converted distance restraints for PLN are shown in Figure 2.
Figure 2.
PRE data obtained from A24C-PLN (black) and L7C-PLN (red) cross-linked with MTSSL. (A) Intensity retention plot for A24C-PLN and L7C-PLN labeled with MTSSL. Unresolved peaks are not reported and are indicated with points. (B) Distances derived from PREs (see materials and methods). Note: only peaks with intensity retention ratio less than 0.95 were used in the calculations. Also some residues lacking R2 values were omitted. (C) Cartoon representation of PLN with MTSSL label at C24 and C7.
Calculation protocol
We used the standard energy target function that has been implemented in XPLOR-NIH 52:
| [2] |
where Eempirical is the sum of the energy terms of the covalent geometry (bond stretching, bond bending, improper angle vibration) and short-range repulsion (repulsive VDW interaction):
| [3] |
Esolution includes the penalty functions due to distance restraints from NOEs, dihedral angles, RDCs, and PREs:
| [4] |
All of the NOE-derived distance restraints used in the present study are taken from the previously published structure of PLN in DPC micelles53. A total of 373 distances (142 intra-residue and 231 inter-residue) are included. In addition, 58 hydrogen-bonds derived from H/D exchange measurements are used to constraint the helical amide groups (HN-CO [i, i+4]) of PLN. Finally, we have obtained 38 dihedral angle restraints using the program TALOS 54 based on the chemical shifts of Hα, Cα, Cβ, C′, N, and HN55. A summary of all of the restraints used in the calculations is listed in Table 1.
To illustrate the significance of RDC and PRE restraints in the structural refinement of the membrane protein PLN, we used three protocols in the simulated annealing optimization to generate three structural ensembles 56. In the first protocol, we used the restraints derived from typical solution NMR experiments, including NOE-derived distances, dihedral angle restraints generated from chemical shifts (TALOS), and hydrogen-bonding interactions from H/D exchange experiments 53. The second protocol includes the restraints from the first protocol plus RDCs derived from the partial alignment of PLN in stretched gels. Finally, the third protocol was constructed by adding MTSSL distance restraints determined from PRE data to all constraints used in the first two protocols. Details for the calculation are presented in the supporting material.
RESULTS
Structural refinement with NOE and dihedral angle restraints (protocol one)
To test our approach, we used phospholamban (PLN), a 52-residue integral membrane protein in the sarcoplasmic reticulum (SR) that regulates the SR Ca2+-ATPase (SERCA)57. PLN exists as an inactive pentamer in the SR and depolymerizes into active monomers upon encountering SERCA58, 59. To mimic the monomeric state, we mutated the three transmembrane Cys residues (C36A, C41F, C46A) to obtain a stable monomer with activity identical to that of wild type PLN60. The NMR structure of PLN monomer in dodecylphosphocholine micelles has been solved by our group53. For the structure determination, we used distance restraints from 15N-edited NOESY spectra, dihedral restraints from chemical shifts54, and hydrogen bonds derived from exchange factors61. Based on the results of the calculations and subsequent backbone dynamics studies, we identified four dynamic domains: α-helical domain Ia (residues 1–16), α-helical region spanning domains Ib (residues 23–30) and II (residues 31–52), and a loop connecting the two helical regions (residues 17–22)51.
Given the limited amount of distance and angular restraints found between the loop and its adjacent domains, the final structural ensemble resulted in many different conformers with poor convergence for the overall backbone conformation and topology. In our previous paper, we mapped solvent accessibility using Mn2+ ions and the insertion of PLN in the micelles using 5- and 16-DSA, and manually eliminated structures that contradicted the paramagnetic mapping. We concluded that PLN adopts a helical L-shaped conformation with the cytoplasmic amphipathic domain Ia adsorbed on the surface of the micelle. These results were also supported by solid-state NMR experiments carried out in the lipid membrane62. While these studies represent the initial characterization of PLN in membrane mimicking environments, they were limited by two factors: (a) the absence of topological restraints with respect to the micelle (the selection was carried out manually), and (b) the absence of the relative orientation of the two helical domains.
Structural refinement with RDCs plus NOE (protocol two)
Since the publication of our first paper on PLN, several groups have obtained orientationally dependent information utilizing RDC data for both membrane bound and soluble proteins. Therefore, our first step to improve the solution NMR structural ensemble of PLN was to introduce restraints from three sets of RDCs obtained from the partial alignment of PLN in a stressed gel system36, 63. Figure 1 shows three sets of RDCs versus the PLN residue number: 1H-15N, 13C′-15N, and 13C′-13Cα. As expected from the helical secondary structure of PLN, the values of the RDCs oscillate periodically. There is a significant change in the pattern from residues 20 to 30 for the 1H-15N RDCs. These residues belong to domain Ib, a helical region that is more dynamic and solvent exposed than the transmembrane domain II 51. When fitting these dynamically averaged RDCs to an average structure, a pronounced kink is observed between domain Ib and domain II. In fact, CPMG relaxation dispersion measurements obtained from PLN in DPC indicate the presence of chemical exchange (at least two conformations) for domain Ib 51, 64, and for this reason we excluded RDCs from domain Ib during our structural calculation. Dynamic model or ensemble simulations are needed to explain the discontinuity of RDCs patterns in this domain.
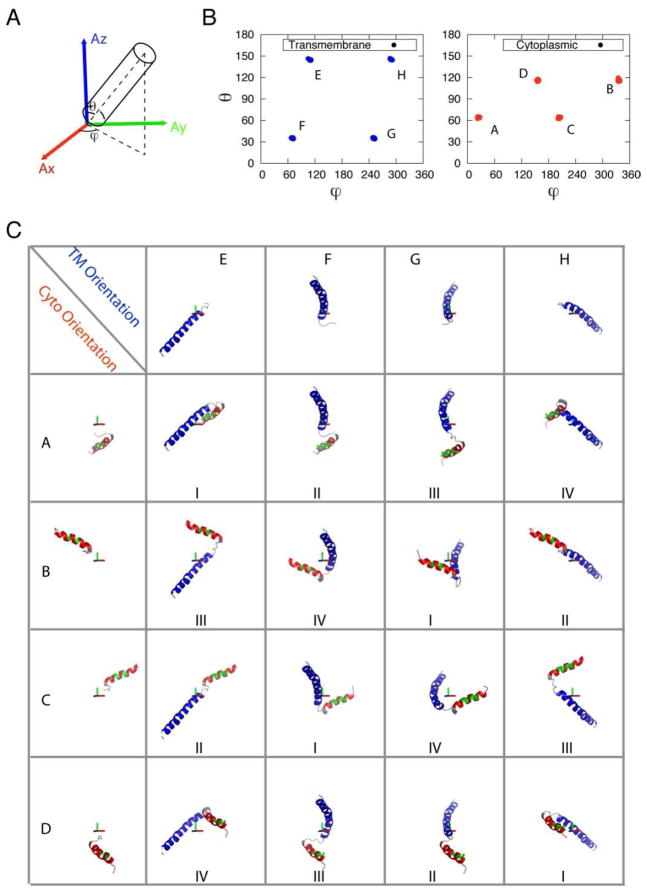
One of the difficulties during structural refinement with RDCs is to accurately determine the axial (Da) and rhombic (R) components of the alignment tensor. Several methods are available to estimate these values such as the maximum likelihood method by Moore and Warren 65 and the histogram method by Bax and co-workers 66. To use these methods, large numbers of RDCs are needed and their reliability is dependent on the accuracy of the experimental measurements. Due to the increased size of the membrane proteins within the detergent micelle, the experimental RDCs have larger errors than their soluble counterparts. Therefore, the errors of heavy atom RDCs such as 13C′-15N and 13C′-13Cα are much larger after scaling to the 15N-1H RDCs. To overcome this, Da and R were allowed to vary in the simulated annealing procedure 6. This introduced two extra parameters into the structural fitting in addition to the tensor orientations. The refined 400 structures are clustered based on two groups of Da and R values (Figure 3). The solutions with Da = −8 Hz and R = 0.667 resulted when RDCs were not properly fitted; these structures were excluded from further analysis. The structures generated from the second group (shown red in Figure 3) were used in the following calculation where Da = 8.6 (± 0.3) and R = 0.52 (± 0.04). The high rhombicity R is consistent with the RDC histogram shown in Figure 1B. Note that all of the RDCs were implemented in the simulated annealing protocol using a flat-well potential52.
Figure 3.
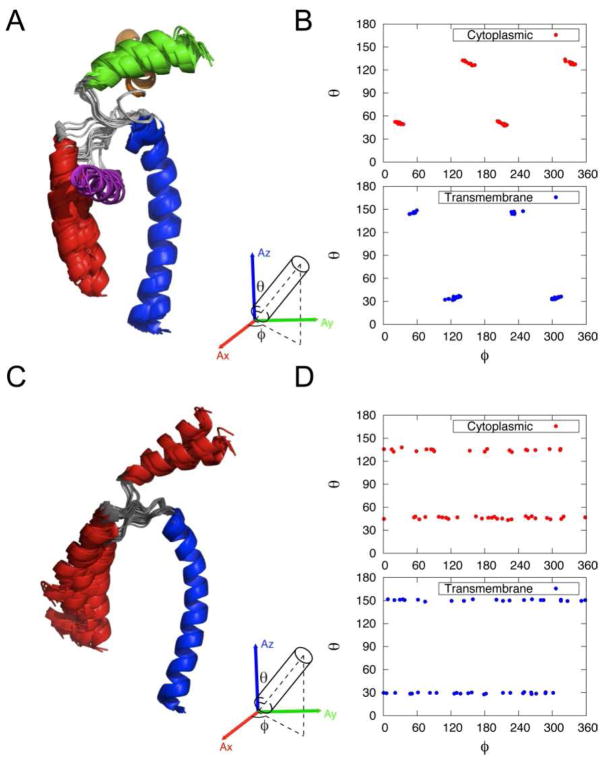
(A) Definition of orientation angles (θ, ϕ) of helical rigid body in the alignment frame. (B) (θ, ϕ) plot of cytoplasmic (Cyto, red) and transmembrane (TM, blue) domain orientations in the alignment frame. (C) Detailed orientation of TM and Cyto with each letter corresponding to (θ, ϕ) in (B). Different combinations of orientations result in different families (labeled in the bottom).
The force constants for RDCs during the structure refinement were determined using the R factor method (RRDC) as described by Clore and co-workers56. In this method, two factors are monitored as a function of the RDC force constant: (1) the R factor for different sets of RDCs and (2) the energy penalties from energy terms other than RDCs. During the force constant ramping, the tensor values Da and R were fixed (determined above to be Da = 8.6 and R = 0.52). We found that the best value for the force constant was 0.5 kcal mol−1 Hz−2 (see Figure S1), which can give reasonable RDC agreement without large penalties from other structural and experimental restraints.
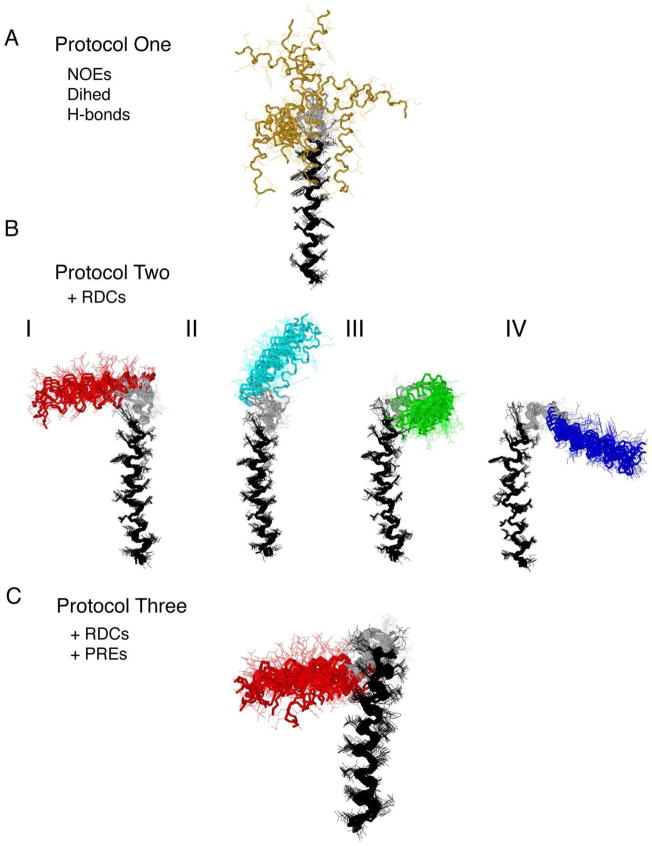
After optimizing Da, R, and the force constants, we generated ~300 structures and selected the lowest 100 structures for further analysis. The resulting structures were clustered into four distinct families (I–IV) when the transmembrane domain II was overlaid. As expected, these structures differ in the relative orientation of the two helical domains giving rise to a four-fold degeneracy (Figure 5B). Each structural ensemble shows a backbone RMSD less than 1.6 Å, with good correlations between experimental and calculated RDC values (Figures S2). When viewed in the alignment tensor frame (Figure 3C), 16 different solutions for two helical domain structures are resolved when only one alignment medium is used. A similar result has been obtained by Bax and co-workers 67 for the monomeric subunit of KcsA solubilized in detergent micelles. For PLN, however, several of these solutions are degenerate, and the reason the structures could be grouped into four unique structural families (I, II, II and IV in Figure 5B).
Figure 5.
Structure overlay of different ensembles AFA-PLN. The overlay is done by overlaying backbone atoms from residues 24–50 using MOLMOL. (A) Protocol one: solution-only ensemble (20 monomers) with NOEs, torsion angles and hydrogen bonds. (B) Protocol two: RDC ensemble (15 monomers) with additional 1H-15N, 13C′-15N and 13C′-13Cα RDCs. Four families of structures result. (C) Protocol three: PRE ensemble (20 monomers) that utilize RDCs and PREs from MTSSL.
The solutions can be distinguished by analyzing the orientation angles (θ, ϕ) for each helical domain in the alignment tensor frame (Figure 3A) as well as the inter-helical angle χ (angle between domains Ia and II). For both the transmembrane (blue) and cytoplasmic (red) helices, the orientations correspond to the following angles: (θ, ϕ), (θ, π+ϕ), (π–θ, π –ϕ), and (π –θ, 2π –ϕ) (Figure 3B). The same solutions were found using theoretical equations by Wang and co-workers 21. The hydrophobic residues of the cytoplasmic domain Ia are approximately oriented toward the transmembrane domain for families I and II and away from it for families III and IV. As for the interhelical angle, family I has a χ angle of ~90°, while families III and IV display χ angles of ~70°. Family II has a nearly anti-parallel orientation between the two helical domains (χ~140°). This orientation is similar to the monomer unit obtained using RDCs for the bellflower model of pentameric PLN by Oxenoid and Chou 68.
Structural refinement with RDCs and PREs (protocol three)
To reduce the degeneracy from the RDC solutions and remove the translational degree of freedom between the two domains, we measured PRE distance restraints. Specifically, we implemented PRE distance restraints from MTSSL-PLN constructs. These restraints were included in the calculations using the convention introduced by Battiste and Wagner 50(see Materials and Methods). To restrict the flexibility of the spin label, we used a dihedral angle potential (sinusoid potential) to restrict the χ1, χ2 and χ3 angles of the spin label, which have been identified to adopt defined values from crystal structures 69.
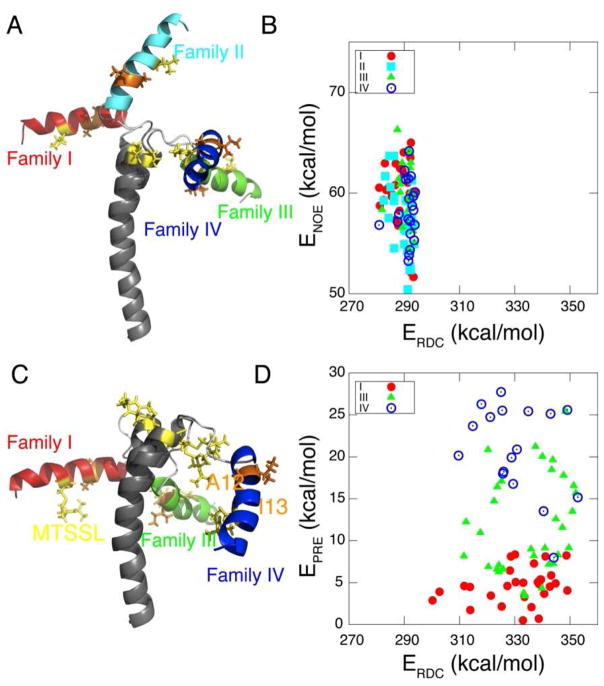
Even with these long-range distances, families I, III and IV remained in the 100 lowest energy structures. However, these three solutions can easily be distinguished based on the PRE energies (EPRE). In protocol two (RDC+NOE refinement), the four families are energetically degenerate (ERDC and ENOE) (Figure 4A, B), while in protocol three, each of the three families clearly have different values of EPRE (Figure 4C,D). The structures within family I display the lowest PRE and NOE energies, and thus was selected as the final structure ensemble (Figure 5C), giving a backbone RMSD of ~ 1.2 Å and good agreement with experimental RDCs (Figures S4) and PREs (Figure S5).
Figure 4.
(A) Comparison between representative structures from each family refined from protocol II. Sidechains of MTSSL label (yellow) and hydrophobic residues (A12 and A13, orange) are shown and labeled. (B) ENOE and ERDC of the four families of structures from protocol II. (C). Similar to (A) except for protocol III. (D) EPRE and ERDC of the three families of structures from protocol III.
The energy differences between families I, III and IV is very small. In fact, this explains why structures blindly selected based on total energy (and not EPRE) cannot adequately decipher between the three families present. PREs were helpful, because the major differences between structural families was in the positioning and facing of the cytoplasmic helix. Only family I had the hydrophobic residues facing toward the transmembrane helix, i.e., facing the micelle interior (Figure 4C). As an attempt to further support our justification of using PRE energies to eliminate families III and IV, we tried to label PLN with MTSSL at a different position. When engineered at position 9 (R9C-PLN), however, the spin label inserts into the hydrophobic core of the micelle (Figure S6C), while the backbone amide of R9C points toward the solvent (Figure S6D, Gd2+ quenching pattern). When the MTSSL is engineered, the long chain of MTSSL cross-linked to Cys 9 inserts in the detergent micelle (see quenching of the resonances in the transmembrane domain in Figure S6C), resulting in an incorrect positioning of the side chain and faulty interpretation of the structural topology of the protein. Therefore, the flexibility and hydrophobic nature of the MTSSL spin label calls for special care when engineering site-specific mutants in membrane proteins when those sites are proximal to the membrane 70.
Application to the PLN Pentamer
The structure of the PLN pentamer heavily relied on the use of RDCs in the structure refinement 68. In fact, monomer structures were built prior to assembly in the symmetric pentamer. In the monomer calculation, the alignment tensors (Da=9.00, R=0.33) were determined from singular value decomposition (SVD)71 using 15N-1H, 13C-15N and 13C′-13Cα RDCs. The alignment tensor was slightly different from the value in our monomer case. A comparison of RDC restraints between the pentamer (Oxenoid and Chou68) and monomer (this paper) showed a good correlation (Figure S7), especially with the N-H RDCs. We then performed the similar structural calculation using their tensor values and data. Similarly we also obtained four degenerate solutions (Figure 6A, B) as in our AFA-PLN monomer calculation. Without help from long-range distance PRE restraints, only one of the families was selected to build the high-resolution pentamer.
Figure 6.
(A) Structure overlay of monomer structures using published RDC data from wt-PLN using non-symmetric tensor. (B) Orientation angles (θ, ϕ) of helical rigid body in the non-sysmmetric alignment frame. (C) Structure overlay of monomer structures using published RDC data from wt-PLN using symmetric tensor. (D) Orientation angles (θ, ϕ) of helical rigid body in the sysmmetric alignment frame.
Aside from the degeneracy issue, the choice of the tensor value is also debatable for a symmetric pentamer (or another symmetric oligomeric protein). It is well-known in the literature 15 that the symmetry axis should coincide with the long axes of the alignment tensor, resulting in R=0 (zero rhombicity). It was argued that non-symmetric tensor values could result from protein dynamics 68, however the dynamic averaging of RDCs needs to be interpreted using a dynamic ensemble rather than fitting data to an average structure. We performed structural calculations of the monomer using RDCs measured by Oxenoid and Chou 68 and implemented a symmetric tensor (R=0), as would be expected from a symmetric pentamer. The Da value was determined to be 6.5 using the methods described earlier (Figure S1). The structure analysis is shown in Figure 6C and D. Note that the φ angle does not have defined minima as in Figure 6B. This is also in agreement with a theoretical study, which showed that an infinite number of solutions existed for cases where R=0 17.
DISCUSSION
To address the challenges of high-resolution structure determination of membrane proteins complexes in micelles, the classical NOE-driven approach has been supplemented with RDCs. However, internal protein dynamics and intrinsic degeneracy of the RDC solutions complicate the data interpretation, resulting in ghost orientations. Here, we show that the degeneracy problem can be addressed by supplementing RDC restraints with PREs from covalent attachment of the MTSSL spin label, which provides a fast and efficient method both for determination of membrane protein structure and its topology.
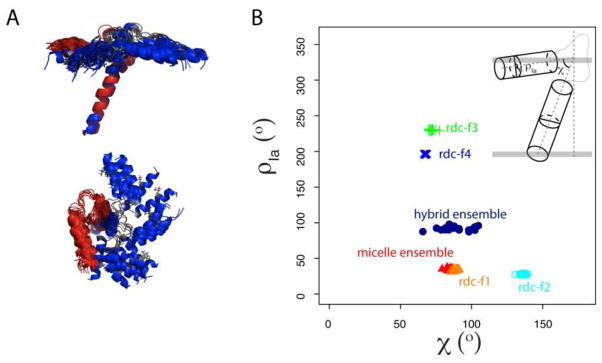
We applied this method to a small multi-domain membrane protein, PLN, which regulates the enzymatic activity of the SR Ca2+-ATPase in cardiac muscle. While structural biologists agree on the secondary structure content of PLN, there is an active debate about the topological arrangement of this protein in the lipid membrane. The structure calculations carried out with NOE based distance restraints do not provide for a high-resolution picture of PLN due to the lack of restraints between the helical domains. The correct orientation of the helical domains of PLN were selected manually based on the PRE data from Mn2+ and doxyl stearic acids 53. The introduction of RDCs improves the resolution of the ensemble, but exemplifies four different solutions, with ghost orientations of the cytoplasmic domain Ia. The combination of paramagnetic-based restraints PREs with RDCs and NOEs enabled us to resolve the orientation that agrees best with all available data. This solution (family I) is similar to the recently determined structural ensemble of monomeric PLN in lipids55, 72. This is not surprising since several recent reports have shown that the structures of membrane proteins in micelles are similar to those determined in lipid bilayers73. The slight discrepancy in the average rotation angles between the hybrid ensemble and that determined by combining NOEs, RDCs, and PREs (Figure 7) has several possible origins. First, there are several approximations used for the determination of the alignment tensor. Second, the cytoplasmic domain of PLN is rather dynamic51, 64 and our data treatment does not take this into account. Third, the non-planar surface of the micelle can cause bends and curvature to malleable domains of membrane proteins and peptides46, 74. Last, RDC provides information of bond orientations with respect to three alignment tensor axes in a non-symmetric tensor. PISEMA only encodes bond orientations with respect to one of the tensor axis (z axis), similar to RDC with a symmetric tensor. Moreover, as with all the NMR parameters, the PREs are affected by protein dynamics75 and our approach does not take into account these effects.
Figure 7.
(A) Overlay of residues 31–52 from the micelle ensemble (Red) with the hybrid ensemble (Blue). (B) Plot of the interhelical angle (χ) with rotation angle of domain Ia (ρ) from the NOE-only ensemble (grey), RDC-degenerated families (f1-red, f2-cyan, f3-green and f4-blue), pre ensemble (Red) and hybrid ensemble (Blue). The definitions of the χ and ρ angles are shown in the inset of panel B.
Since the studies of membrane proteins in detergent micelles are likely to continue to offer insightful information, we conclude that for multidomain membrane proteins the use of RDCs is not sufficient to define their conformational space and topology. Rather, orientational restraints need to be supplemented with long-range paramagnetic restraints from spin labels covalently linked to proteins to uniquely define their topology32, 76.
Finally, we would like to point out that this paper address only the geometric ambiguities derived from RDCs. In fact, intrinsic dynamics complicates the use of both PRE and RDC for structure determination. To overcome these problems, molecular dynamics methods are being developed to for the variability of alignment tensors 77, 78 as well as for the modulations of the PRE effects on long-range interactions75, 79. A more comprehensive approach for flexible domains of membrane proteins would require the combined use of PRE and RDCs using ensemble molecular dynamics methods75.
Supplementary Material
Acknowledgments
This work was supported by grants to G.V. from the National Institutes of Health (GM64742, HL80081, GM072701) and the American Heart Association (0160465). Lei Shi was supported by a Doctoral Dissertation Fellowship from the University of Minnesota graduate school. This work was carried out in part using hardware and/or software provided by the University of Minnesota Supercomputing Institute.
BRIEFS
- PLN
Phospholamban
- RDC
Residual dipolar coupling
- PRE
Paramagnetic relaxation enhancement
- NOE
Nuclear Overhauser effects
- DSA
doxyl-stearic-acid
Footnotes
Supporting Information Available. Additional figures with R factors, Correlation plots with RDCs from different families, RDCs from 13C-edited experiments, correlation plots RDCs and PREs, correlation plots for the PREs with A24C MTSSL and L7C MTSSL, and Table with structural statistics from refinement protocols.
References
- 1.Tjandra N, Bax A. Science. 1997;278:1111–1114. doi: 10.1126/science.278.5340.1111. [DOI] [PubMed] [Google Scholar]
- 2.Bax A, Kontaxis G, Tjandra N. Methods in Enzymology. 2001;339:127–174. doi: 10.1016/s0076-6879(01)39313-8. [DOI] [PubMed] [Google Scholar]
- 3.Prestegard JH. Nature structural biology. 1998;517 doi: 10.1038/756. [DOI] [PubMed] [Google Scholar]
- 4.Prestegard JH, Al-Hashimi HM, Tolman JR. Quarterly review in biophysics. 2000;33:371–424. doi: 10.1017/s0033583500003656. [DOI] [PubMed] [Google Scholar]
- 5.Tjandra N, Marquardt J, Clore MG. Journal of Magnetic Resonance. 2000;142:393–396. doi: 10.1006/jmre.1999.1985. [DOI] [PubMed] [Google Scholar]
- 6.Clore MG, Gronenborn MA, Tjandra N. Journal of Magnetic Resonance. 1998;131:159–162. doi: 10.1006/jmre.1997.1345. [DOI] [PubMed] [Google Scholar]
- 7.Nodet G, Salmon L, Ozenne V, Meier S, Jensen MR, Blackledge M. J Am Chem Soc. 2009;131:17908–17918. doi: 10.1021/ja9069024. [DOI] [PubMed] [Google Scholar]
- 8.Jensen MR, Blackledge M. J Am Chem Soc. 2008;130:11266–11267. doi: 10.1021/ja8039184. [DOI] [PubMed] [Google Scholar]
- 9.Meier S, Blackledge M, Grzesiek S. J Chem Phys. 2008;128:052204. doi: 10.1063/1.2838167. [DOI] [PubMed] [Google Scholar]
- 10.Jha AK, Colubri A, Freed KF, Sosnick TR. Proc Natl Acad Sci U S A. 2005;102:13099–13104. doi: 10.1073/pnas.0506078102. [DOI] [PMC free article] [PubMed] [Google Scholar]
- 11.Marsh JA, Forman-Kay JD. J Mol Biol. 2009;391:359–374. doi: 10.1016/j.jmb.2009.06.001. [DOI] [PubMed] [Google Scholar]
- 12.Vallurupalli P, Hansen DF, Stollar E, Meirovitch E, Kay LE. Proc Natl Acad Sci U S A. 2007;104:18473–18477. doi: 10.1073/pnas.0708296104. [DOI] [PMC free article] [PubMed] [Google Scholar]
- 13.Baldwin AJ, Hansen DF, Vallurupalli P, Kay LE. J Am Chem Soc. 2009;131:11939–11948. doi: 10.1021/ja903896p. [DOI] [PubMed] [Google Scholar]
- 14.Fischer MWF, Losonczi JA, Weaver JL, Prestegard JH. Biochemistry. 1999;38:9013–9022. doi: 10.1021/bi9905213. [DOI] [PubMed] [Google Scholar]
- 15.Al-Hashimi HM, Bolon PJ, Prestegard JH. J Magn Reson. 2000;142:153–158. doi: 10.1006/jmre.1999.1937. [DOI] [PubMed] [Google Scholar]
- 16.Mueller GA, Choy WY, Yang D, Forman-Kay JD, Venters RA, Kay LE. J Mol Biol. 2000;300:197–212. doi: 10.1006/jmbi.2000.3842. [DOI] [PubMed] [Google Scholar]
- 17.Hus JC, Salmon L, Bouvignies G, Lotze J, Blackledge M, Bruschweiler R. J Am Chem Soc. 2008;130:15927–15937. doi: 10.1021/ja804274s. [DOI] [PMC free article] [PubMed] [Google Scholar]
- 18.Mesleh MF, Veglia G, DeSilva TM, Marassi FM, Opella SJ. J Am Chem Soc. 2002;124:4206–4207. doi: 10.1021/ja0178665. [DOI] [PMC free article] [PubMed] [Google Scholar]
- 19.Mesleh MF, Opella SJ. J Magn Reson. 2003;163:288–299. doi: 10.1016/s1090-7807(03)00119-8. [DOI] [PubMed] [Google Scholar]
- 20.Mascioni A, Veglia G. J Am Chem Soc. 2003;125:12520–12526. doi: 10.1021/ja0354824. [DOI] [PubMed] [Google Scholar]
- 21.Walsh JD, Wang YX. J Magn Reson. 2005;174:152–162. doi: 10.1016/j.jmr.2005.01.018. [DOI] [PubMed] [Google Scholar]
- 22.Mascioni A, Eggimann BL, Veglia G. Chem Phys Lipids. 2004;132:133–144. doi: 10.1016/j.chemphyslip.2004.09.018. [DOI] [PubMed] [Google Scholar]
- 23.Al-Hashimi HM, Valafar H, Terrell M, Zartler ER, Eidsness MK, Prestegard JH. J Magn Reson. 2000;143:402–406. doi: 10.1006/jmre.2000.2049. [DOI] [PubMed] [Google Scholar]
- 24.Tolman JR, Flanagan JM, Kennedy MA, Prestegard JH. Proceedings Natinal Academy Science U S A. 1995;92:9279–9283. doi: 10.1073/pnas.92.20.9279. [DOI] [PMC free article] [PubMed] [Google Scholar]
- 25.Tolman JR, Flanagan JM, Kennedy MA, Prestegard JH. Nat Struct Biol. 1997;4:292–7. doi: 10.1038/nsb0497-292. [DOI] [PubMed] [Google Scholar]
- 26.Tolman JR, Ruan K. Chem Rev. 2006;106:1720–1736. doi: 10.1021/cr040429z. [DOI] [PubMed] [Google Scholar]
- 27.Lakomek NA, Carlomagno T, Becker S, Griesinger C, Meiler J. J Biomol NMR. 2006;34:101–115. doi: 10.1007/s10858-005-5686-0. [DOI] [PubMed] [Google Scholar]
- 28.Bertini I, Gupta YK, Luchinat C, Parigi G, Peana M, Sgheri L, Yuan J. J Am Chem Soc. 2007;129:12786–12794. doi: 10.1021/ja0726613. [DOI] [PubMed] [Google Scholar]
- 29.Bertelsen EB, Chang L, Gestwicki JE, Zuiderweg ER. Proc Natl Acad Sci U S A. 2009;106:8471–8476. doi: 10.1073/pnas.0903503106. [DOI] [PMC free article] [PubMed] [Google Scholar]
- 30.White SH, Wimley WC. Annual Review Biophysics Biomolecular Structures. 1999;28:319–365. doi: 10.1146/annurev.biophys.28.1.319. [DOI] [PubMed] [Google Scholar]
- 31.von Heijne G. Nat Rev Mol Cell Biol. 2006;7:909–918. doi: 10.1038/nrm2063. [DOI] [PubMed] [Google Scholar]
- 32.Zhou Y, Cierpicki T, Jimenez RH, Lukasik SM, Ellena JF, Cafiso DS, Kadokura H, Beckwith J, Bushweller JH. Mol Cell. 2008;31:896–908. doi: 10.1016/j.molcel.2008.08.028. [DOI] [PMC free article] [PubMed] [Google Scholar]
- 33.Traaseth NJ, Verardi R, Veglia G. J Am Chem Soc. 2008;130:2400–2401. doi: 10.1021/ja711499r. [DOI] [PMC free article] [PubMed] [Google Scholar]
- 34.Tugarinov V, Kay LE. J Biomol NMR. 2004;28:165–72. doi: 10.1023/B:JNMR.0000013824.93994.1f. [DOI] [PubMed] [Google Scholar]
- 35.Tugarinov V, Kay LE. J Am Chem Soc. 2003;125:13868–13878. doi: 10.1021/ja030345s. [DOI] [PubMed] [Google Scholar]
- 36.Tycko R, Blanco FJ, Ishii Y. Journal of the American Chemical Society. 2000;122:9340–9341. [Google Scholar]
- 37.Douglas SM, Chou JJ, Shih WM. Proc Natl Acad Sci U S A. 2007;104:6644–6648. doi: 10.1073/pnas.0700930104. [DOI] [PMC free article] [PubMed] [Google Scholar]
- 38.Lorieau J, Yao L, Bax A. J Am Chem Soc. 2008;130:7536–7537. doi: 10.1021/ja801729f. [DOI] [PMC free article] [PubMed] [Google Scholar]
- 39.Veglia G, Opella SJ. Journal of the American Chemical Society (Communication) 2000;122:11733–11734. [Google Scholar]
- 40.Ma C, Opella SJ. Journal of Magnetic Resonance. 2000;146:381–384. doi: 10.1006/jmre.2000.2172. [DOI] [PubMed] [Google Scholar]
- 41.Wohnert J, Franz KJ, Nitz M, Imperiali B, Schwalbe H. J Am Chem Soc. 2003;125:13338–13339. doi: 10.1021/ja036022d. [DOI] [PubMed] [Google Scholar]
- 42.Van Horn WD, Kim HJ, Ellis CD, Hadziselimovic A, Sulistijo ES, Karra MD, Tian C, Sonnichsen FD, Sanders CR. Science. 2009;324:1726–1729. doi: 10.1126/science.1171716. [DOI] [PMC free article] [PubMed] [Google Scholar]
- 43.Cierpicki T, Liang B, Tamm LK, Bushweller JH. J Am Chem Soc. 2006;128:6947–6951. doi: 10.1021/ja0608343. [DOI] [PMC free article] [PubMed] [Google Scholar]
- 44.Buck B, Zamoon J, Kirby TL, DeSilva TM, Karim C, Thomas D, Veglia G. Protein Expr Purif. 2003;30:253–61. doi: 10.1016/s1046-5928(03)00127-x. [DOI] [PubMed] [Google Scholar]
- 45.Kirby TL, Karim CB, Thomas DD. Biochemistry. 2004;43:5842–52. doi: 10.1021/bi035749b. [DOI] [PubMed] [Google Scholar]
- 46.Chou JJ, Kaufman JD, Stahl SJ, Wingfield PT, Bax A. J Am Chem Soc. 2002;124:2450–2451. doi: 10.1021/ja017875d. [DOI] [PubMed] [Google Scholar]
- 47.Permi P, Annila A. J Biomol NMR. 2000;16:221–227. doi: 10.1023/a:1008362211560. [DOI] [PubMed] [Google Scholar]
- 48.Delaglio F, Grzesiek S, Vuister GW, Zhu G, Pfeifer J, Bax A. J Biomol NMR. 1995;6:277–293. doi: 10.1007/BF00197809. [DOI] [PubMed] [Google Scholar]
- 49.Johnson BA. Methods Mol Biol. 2004;278:313–352. doi: 10.1385/1-59259-809-9:313. [DOI] [PubMed] [Google Scholar]
- 50.Battiste JL, Wagner G. Biochemistry. 2000;39:5355–5365. doi: 10.1021/bi000060h. [DOI] [PubMed] [Google Scholar]
- 51.Metcalfe EE, Zamoon J, Thomas DD, Veglia G. Biophys J. 2004;87:1205–1214. doi: 10.1529/biophysj.103.038844. [DOI] [PMC free article] [PubMed] [Google Scholar]
- 52.Schwieters CD, Kuszewski JJ, Tjandra N, Clore GM. J Magn Reson. 2003;160:65–73. doi: 10.1016/s1090-7807(02)00014-9. [DOI] [PubMed] [Google Scholar]
- 53.Zamoon J, Mascioni A, Thomas DD, Veglia G. Biophys J. 2003;85:2589–2598. doi: 10.1016/s0006-3495(03)74681-5. [DOI] [PMC free article] [PubMed] [Google Scholar]
- 54.Cornilescu G, Delaglio F, Bax A. J Biomol NMR. 1999;13:289–302. doi: 10.1023/a:1008392405740. [DOI] [PubMed] [Google Scholar]
- 55.Traaseth NJ, Shi L, Verardi R, Mullen DG, Barany G, Veglia G. Proc Natl Acad Sci U S A. 2009;106:10165–10170. doi: 10.1073/pnas.0904290106. [DOI] [PMC free article] [PubMed] [Google Scholar]
- 56.Clore GM, Kuszewski J. J Am Chem Soc. 2003;125:1518–1525. doi: 10.1021/ja028383j. [DOI] [PubMed] [Google Scholar]
- 57.Traaseth NJ, Ha KN, Verardi R, Shi L, Buffy JJ, Masterson LR, Veglia G. Biochemistry. 2008;47:3–13. doi: 10.1021/bi701668v. [DOI] [PMC free article] [PubMed] [Google Scholar]
- 58.Kimura Y, Kurzydlowski K, Tada M, MacLennan DH. J Biol Chem. 1997;272:15061–4. doi: 10.1074/jbc.272.24.15061. [DOI] [PubMed] [Google Scholar]
- 59.Reddy LG, Jones LR, Thomas DD. Biochemistry. 1999;38:3954–62. doi: 10.1021/bi981795d. [DOI] [PubMed] [Google Scholar]
- 60.Karim CB, Marquardt CG, Stamm JD, Barany G, Thomas DD. Biochemistry. 2000;39:10892–7. doi: 10.1021/bi0003543. [DOI] [PubMed] [Google Scholar]
- 61.Veglia G, Zeri AC, Ma C, Opella SJ. Biophys J. 2002;82:2176–2183. doi: 10.1016/s0006-3495(02)75564-1. [DOI] [PMC free article] [PubMed] [Google Scholar]
- 62.Mascioni A, Karim C, Zamoon J, Thomas DD, Veglia G. J Am Chem Soc. 2002;124:9392–9393. doi: 10.1021/ja026507m. [DOI] [PubMed] [Google Scholar]
- 63.Chou JJ, Gaemers S, Howder B, Louis JM, Bax A. J Biomol NMR. 2001;21:377–382. doi: 10.1023/a:1013336502594. [DOI] [PubMed] [Google Scholar]
- 64.Traaseth NJ, Veglia G. Biochim Biophys Acta. 2010;1798:77–81. doi: 10.1016/j.bbamem.2009.09.009. [DOI] [PMC free article] [PubMed] [Google Scholar]
- 65.Warren JJ, Moore PB. Journal of Magnetic Resonance. 2001;149:271–275. doi: 10.1006/jmre.2001.2307. [DOI] [PubMed] [Google Scholar]
- 66.Clore MG, Gronenborn MA, Bax A. Journal of Magnetic Resonance. 1998;133:216–221. doi: 10.1006/jmre.1998.1419. [DOI] [PubMed] [Google Scholar]
- 67.Chill JH, Louis JM, Delaglio F, Bax A. Biochim Biophys Acta. 2007;1768:3260–3270. doi: 10.1016/j.bbamem.2007.08.006. [DOI] [PMC free article] [PubMed] [Google Scholar]
- 68.Oxenoid K, Chou JJ. Proc Natl Acad Sci U S A. 2005;102:10870–10875. doi: 10.1073/pnas.0504920102. [DOI] [PMC free article] [PubMed] [Google Scholar]
- 69.Langen R, Oh KJ, Cascio D, Hubbell WL. Biochemistry. 2000;39:8396–8405. doi: 10.1021/bi000604f. [DOI] [PubMed] [Google Scholar]
- 70.Sammalkorpi M, Lazaridis T. Biophys J. 2007;92:10–22. doi: 10.1529/biophysj.106.092809. [DOI] [PMC free article] [PubMed] [Google Scholar]
- 71.Losonczi JA, Andrec M, Fischer MW, Prestegard JH. Journal of Magnetic Resonance. 1999;138:334–342. doi: 10.1006/jmre.1999.1754. [DOI] [PubMed] [Google Scholar]
- 72.Shi L, Traaseth NJ, Verardi R, Cembran A, Gao J, Veglia G. J Biomol NMR. 2009;44:195–205. doi: 10.1007/s10858-009-9328-9. [DOI] [PMC free article] [PubMed] [Google Scholar]
- 73.Franzin CM, Teriete P, Marassi FM. J Am Chem Soc. 2007;129:8078–8079. doi: 10.1021/ja0728371. [DOI] [PMC free article] [PubMed] [Google Scholar]
- 74.Chou JJ, Kaufman JD, Stahl SJ, Wingfield PT, Bax A. J Am Chem Soc. 2002;124:2450–2451. doi: 10.1021/ja017875d. [DOI] [PubMed] [Google Scholar]
- 75.Dedmon MM, Lindorff-Larsen K, Christodoulou J, Vendruscolo M, Dobson CM. J Am Chem Soc. 2005;127:476–477. doi: 10.1021/ja044834j. [DOI] [PubMed] [Google Scholar]
- 76.Liang B, Bushweller JH, Tamm LK. J Am Chem Soc. 2006;128:4389–4397. doi: 10.1021/ja0574825. [DOI] [PMC free article] [PubMed] [Google Scholar]
- 77.Salvatella X, Richter B, Vendruscolo M. J Biomol NMR. 2008;40:71–81. doi: 10.1007/s10858-007-9210-6. [DOI] [PubMed] [Google Scholar]
- 78.De Simone A, Richter B, Salvatella X, Vendruscolo M. J Am Chem Soc. 2009;131:3810–3811. doi: 10.1021/ja8087295. [DOI] [PubMed] [Google Scholar]
- 79.Salmon L, Nodet G, Ozenne V, Yin G, Jensen MR, Zweckstetter M, Blackledge M. J Am Chem Soc. 2010;132:8407–8418. doi: 10.1021/ja101645g. [DOI] [PubMed] [Google Scholar]
Associated Data
This section collects any data citations, data availability statements, or supplementary materials included in this article.


