

Abstract
Osteosarcoma remains a leading cause of cancer death in adolescents. Treatment paradigms and survival rates have not improved in two decades. Driving the lack of therapeutic inroads, the molecular etiology of osteosarcoma remains elusive. MicroRNAs (miRNAs) have demonstrated far-reaching effects on the cellular biology of development and cancer. Their role in osteosarcomagenesis remains largely unexplored. Here we identify for the first time an miRNA signature reflecting the pathogenesis of osteosarcoma from surgically procured samples from human patients. The signature includes high expression of miR-181a, miR-181b, and miR-181c as well as reduced expression of miR-16, miR-29b, and miR-142-5p. We also demonstrate that miR-181b and miR-29b exhibit restricted expression to distinct cell populations in the tumor tissue. Further, higher expression of miR-27a and miR-181c* in pre-treatment biopsy samples characterized patients who developed clinical metastatic disease. In addition, higher expression of miR-451 and miR-15b in pre-treatment samples correlated with subsequent positive response to chemotherapy. In vitro and in vivo functional validation in osteosarcoma cell lines confirmed the tumor suppressive role of miR-16 and the pro-metastatic role of miR-27a. Furthermore, predicted target genes for miR-16 and miR-27a were confirmed as down-regulated by real-time PCR. Affymetrix array profiling of cDNAs from the osteosarcoma specimens and controls were interrogated according to predicted targets of miR-16, miR142-5p, miR-29b, miR-181a/b, and miR-27a. This analysis revealed positive and negative correlations highlighting pathways of known importance to osteosarcoma, as well as novel genes. Thus, our findings establish a miRNA signature associated with pathogenesis of osteosarcoma as well as critical pre-treatment biomarkers of metastasis and responsiveness to therapy.
Keywords: osteosarcoma, microRNA, chemotherapy, metastasis-related miRs, gene array
Introduction
Osteosarcoma (OS) is the most common primary sarcoma of bone and a leading cause of cancer death among adolescents and young adults (1). The cellular events that initiate and propagate osteosarcomagenesis remain poorly understood (2). The vast majority of osteosarcomas (approximately 90%) are termed “conventional” and have osteoblastic and/or fibroblastic histologic patterns with consistently high-grade nuclear morphologies. Two common alternate histologic subtypes, chondroblastic, characterized by cartilaginous tissues in the tumor, and telangiectatic, characterized by abundant vascular and cystic spaces in the tumor, are also often high-grade. When these other subtypes are high-grade, they are treated with conventional osteosarcoma treatment regimens (3).
The genetic and cytogenetic complexity intrinsic to OS make deciphering the origins of its very patterned clinical phenotype especially difficult. Inability to determine which, among the many genetic derangements present in OS, such as aneuploidy, rampant mutations, and manifold copy number variations, are causative of and which are resultant from oncogenic transformation remains a major impediment to progress in understanding its etiology (2). Nonetheless, the consistent clinical pattern of osteosarcomagenesis, characterized by rapid onset of high-grade neoplasms in young people, suggests that some yet undetected, but consistent etiological event or group of events defines the neoplasm. MicroRNAs (miRNAs) are short non-coding RNAs that post-transcriptionally modify gene expression in eukaryotic cells. Expression of a single miRNA can silence a large number of genes, granting these molecules extensive control over many cellular functions (4). Knowledge of individual miRNAs effecting developmental biology, cellular differentiation programs, and oncogenesis continues to grow (reviewed in (5)). Although specific miRNAs have been functionally evaluated in a few OS cell lines (6–9), and miRNA expression profiled in formalin-fixed paraffin-embedded OS specimens (10), high quality total RNA from primary OS tissues has been collected prospectively in few centers (11). Appreciating the vast effects possible from oncogenic and other miRNAs, we surveyed a well-characterized group of OSs using array-based technologies. Differential expression profiles were validated with quantitative reverse transcriptase polymerase chain reaction (qRT-PCR), in situ hybridization, and functional validation in human OS cell lines both in vitro and in vivo. Our studies have demonstrated profiles including differential expression of oncogenic and tumor suppressor miRNAs, reflecting OS status.
Materials & Methods
Patients, sample procurement, and isolation of total RNA
With approval of the institutional review board and in compliance with all legal and ethical considerations for human subject research, patients presenting with suspected sarcomas and scheduled for incisional biopsies provided informed consent to have their tissue banked for RNA extraction. Specimens were obtained during these open surgical biopsies, gently washed with normal saline to remove excess blood, and placed immediately into RNAlater (Ambion, Austin, Texas, USA) by the surgeon. Specimens were kept at 4°C in RNAlater for up to 1 week, then stored at −80°C. When formal pathological interpretation of histology from other portions of the biopsy specimen rendered a diagnosis of osteosarcoma, the RNA-preserving tissue specimens were banked and annotated. In preparation for these specific experiments, total RNA was extracted from banked specimens using the TRIzol reagent and method (Invitrogen, Carlsbad, California, USA). Control samples were derived from to-be-discarded bone fragments obtained from similarly consented patients undergoing debridement surgeries for acute, traumatic injuries to the long-bones.
Microarray profiling of miRNA and mRNA expression
MicroRNA microarray was performed as previously described (12). The integrity of these total RNAs was assessed using an Agilent 2100 bioanalyzer. Five micrograms of total RNA was hybridized on the custom microarray chip (OSUCCC miRNA microchip version 3.0). This array contains approximately 1100 probes (including 345 human and 249 mouse miRNA genes spotted in duplicate). Normalized microarray data were managed and analyzed by BRB-ArrayTools, Version 3.8.1 (13). Genes whose expression differed by at least 1.5 fold from the median, in at least 20% of the arrays were used. A stringent significance threshold was used to limit the number of false positive findings. The result of this approach was determined by two-sample t-test with nominal significance level at 0.01. The FDR is the expected proportion of positive results that are false positives at the various levels of significance and was controlled using the step-up method of Benjamini and Hochberg. In this analysis, at any selected FDR level, the expected proportion of false positives was determined. Class prediction algorithms determined whether microRNA expression patterns could accurately differentiate between OS samples and normal human bone controls. We developed models based on the compound covariate predictor, nearest neighbor classification and support vector machine. The models incorporated genes that were differentially expressed among genes at the significance level (0.05) as assessed by the random variance t-test. We used the prediction test to identify the classifier signature with the lowest misclassification error.
For the mRNA profiling, 14 of the cohort's OS and 4 of the control samples were hybridized with the Affymetrix Human Genome U133 Plus 2.0 Array (Santa Clara, CA). The CEL files were imported and RMA normalized. Genes whose expression differed by at least 1.5 fold from the median in at least 20% of the arrays were used. We performed class comparisons algorithms in BRB-ArrayTools using the paired t-test (p<0.05). The union of the target mRNAs was used as an input to DAVID EASE, using the David Bioinformatics Resources system (http://david.abcc.ncifcrf.gov). We compared the list of terms related to the predicted targeted mRNAs. The terms were evaluated by p-value (P < 0.05) and Benjamini-Hochberg correction for multiple testing controlled the p-values. Target genes selection was performed by Target Scan software. We evaluated Gene Ontology (http://www.geneontology.org/) and PATHWAY (http://www.genome.jp/kegg/) terms.
RT-PCR validation
TaqMan miRNA assays were used to detect and quantify mature miRNAs as previously described (14) using ABI Prism 7900HT sequence detection systems (Applied Biosystems). Normalization was performed with RNA U6. Samples were run in triplicate, including no-template controls. Relative expression was calculated using the comparative Ct method. qRT-PCR to confirm expression levels in cell lines following transfection with lentiviral vectors was performed according to a previously described protocol (15). Primers used are noted Supplemental Table 6.
In situ hybridization
Detection of microRNAs by in situ hybridization was performed as previously published (16, 17). LNA modified probes were 5’ labeled with digoxigenin (Exiqon). After protease digestion to expose the target, 2 pmoles/µL of the probe was hybridized to the tissue section for 15 hours, then subjected to a low stringency wash. The probe-target complex was visualized by alkaline phosphatase activity on the chromogen nitroblue tetrazolium and bromochloroindolyl phosphate (NBT/BCIP) (Roche Diagnostics) after nuclear fast red counterstain. Co-expression analyses was performed with the Nuance system as previously published (17).
Cell lines and cell culture
Cell lines (HOS, KHOS, SaOS2, U2OS, MG-63) were obtained from the American Type Culture Collection (ATCC, Manassas, VA) and hOB from PromoCell (Heidelberg, Germany). Each line was authenticated as to genotype and phenotype by the source company. Cells were utilized at low-passage for experiments, always less than 6 months of passaging post-procurement.
In vitro viral transduction
Lenti-miR-16 was a gift from Dr. Yinon Ben-Neriah (Hebrew University, Jerusalem) and Lenti-miR-27a was described elsewhere (18). HEK293 cells with pCMV-VSVG and pHR82R packaging plasmids were used to produce the lenti-miRs. OS cells at subconfluent density (70%) were incubated with the lentivirus for 4–5 hours. Selection with 0.5µg/mL puromycin began the next day. Stable clones were then isolated and verified by qRT-PCR and GFP fluorescence.
Cell proliferation analysis
Cells (1.5 × 10³) were plated in 96-well plate and analyzed using an XTT (sodium 3(phenylaminocarbonyl)- 3,4- tetrazolium]-bis (4-methoxy- 6-nitro) benzene sulfonic acid hydrate) proliferation assay according to the manufacturer’s instructions (Beit Haemek, Israel).
Colony Formation Assay
Cells were plated at a density of 500 cells/well in a 6-well plate in triplicate. After 1–2 weeks the cells were fixed with 70% Ethanol, stained with Giemsa and counted.
Matrigel invasion assay
Blind well chemotaxis chambers with 13-mm-diameter filters were used for this assay. Polyvinylpyrrolidone-free polycarbonate filters, 8-µm pore size (Costar Scientific Co., Cambridge, MA), were coated with basement membrane Matrigel (25 µg per filter). Cells (2 × 10⁵) suspended in DMEM containing 0.1% bovine serum albumin, were added to the upper chamber. Conditioned medium of NIH3T3 fibroblasts was placed in the lower chamber. Assays were carried out at 37°C in 5% CO2. Over 90% of the cells attached to the filter after incubation for 7 h. After incubation, the upper surface of the filter was freed of cells with a cotton swab. Cells that passed through the filter to bottom side were fixed with methanol and stained with Giemsa. Each triplicate assay was performed twice. Invasive cells were counted in ten representative light-microscopy fields.
Mouse Experiments
All animals were housed in the Hebrew University animal facility and the experiments with live animals were approved by our institute animal committee and conducted in accordance with NIH guidelines. HOS cells expressing miR-control, miR16 or miR-27a were injected subcutaneously (SC; 5 × 10⁶ cells) or intravenously (IV; 1 × 10⁶ cells) into NOD/SCID mice respectively. For SC experiments, tumor volume was evaluated weekly and tumor mass measured at the end of the experiment. For IV experiments, 6-weeks after injecting cells expressing miR-27a-GFP or control-miR-GFP, mice were sacrificed and lungs as well as legs and forearms were examined for micro and macro-metastases, respectively, using a fluorescent stereomicroscope (Olympus).
Immunohistochemistry
Immunohistochemistry was performed on formalin-fixed, paraffin embedded specimens using the following antibodies: polyclonal anti-active caspase-3 (Cell Signaling; dilution 1:100), polyclonal anti-BCL2 (Abcam ab7973-1, dilution 1:100), and polyclonal anti-NFAT5 (Abcam ab110995, dilution 1:100). Detection was performed using ABC kit (BA-1000, VECTOR Laboratories) according to manufacturer's specifications. Slides were reviewed in blinded fashion and ranked according to density of immunostain. Five bone marrow core biopsy controls were used, assessing immunostaining on trabecular bone-rimming osteoblasts.
Results
miRNA expression signature for osteosarcomagenesis
To identify differentially expressed miRNAs common in osteosarcomagenesis, we compared miRNA expression profiles from 18 pretreatment biopsy samples from conventional (osteoblastic/fibroblastic) OSs to control samples from healthy bone tissue (Supplemental Table 1). 34 miRNAs were significantly deregulated (P < 0.01); of those, 11 had higher expression among the conventional OS group and 23 lower expression (Table 1, Fig 1A). The most up-regulated miRNAs in OS were miR-181a and miR-181b. MiR-29b, miR-451 and miR-16 were among the most downregulated. Discrimination by profile between the two groups was strong. The cross-validation receiver operator characteristic (ROC) curve from the Bayesian compound covariate predictor had an area under the curve (AUC) of 0.986. This demonstrates an extremely strong capacity for the relative expression levels of these 34 miRNAs to place a given sample into its correct group, OS or control.
Table 1. Differential expression of miRNAs in osteosarcoma.
- Osteosarcoma samples compared to control bone. The 34 genes are significant at the nominal 0.01 level of the univariate test.
- Metastatic osteosarcomas compared to non-metastatic osteosarcomas
- Chemo-resistant osteosarcomas compared to chemo-sensitive
| Gene symbol | Fold-change | Parametric p-value | FDR | |
|---|---|---|---|---|
| A. | ||||
| hsa-miR-181a | 11.16 | 0.0000301 | 0.00128 | |
| hsa-miR-181b | 5.35 | 0.003193 | 0.0611 | |
| hsa-miR-10b* | 4.36 | 0.0046651 | 0.0687 | |
| hsa-miR-7 | 4.12 | 0.0002834 | 0.0109 | |
| hsa-miR-214 | 4.11 | 0.0000223 | 0.00128 | |
| hsa-miR-190 | 4.04 | 0.0019492 | 0.0436 | |
| hsa-miR-181c | 3.67 | 0.0063869 | 0.0895 | |
| hsa-miR-616* | 2.92 | 0.0068924 | 0.0895 | |
| hsa-miR-210 | 2.67 | 0.0023937 | 0.0483 | |
| hsa-miR-574-3p | 2.26 | 0.0000037 | 0.000354 | |
| hsa-miR-487a | 2.22 | 0.0045357 | 0.0687 | |
| hsa-miR-566 | 0.65 | 0.0072429 | 0.0895 | |
| hsa-miR-326 | 0.6 | 0.0045096 | 0.0687 | |
| hsa-miR-657 | 0.55 | 0.0046341 | 0.0687 | |
| hsa-miR-195 | 0.45 | 0.0015867 | 0.038 | |
| hsa-miR-483-3p | 0.45 | 0.0072026 | 0.0895 | |
| hsa-miR-663 | 0.45 | 0.0099922 | 0.113 | |
| hsa-miR-150 | 0.41 | 0.0000002 | 0.0000766 | |
| hsa-miR-650 | 0.41 | 0.0020484 | 0.0436 | |
| hsa-let-7g | 0.41 | 0.0092105 | 0.107 | |
| hsa-miR-519d | 0.39 | 0.0034483 | 0.0629 | |
| hsa-miR-16-2* | 0.34 | 0.0003525 | 0.0122 | |
| hsa-miR-26b | 0.33 | 0.0087029 | 0.104 | |
| hsa-miR-340 | 0.28 | 0.0000234 | 0.00128 | |
| hsa-miR-486-5p | 0.26 | 0.0036685 | 0.0639 | |
| hsa-miR-126 | 0.24 | 0.0004251 | 0.0122 | |
| hsa-miR-488 | 0.23 | 0.0072343 | 0.0895 | |
| hsa-miR-335 | 0.22 | 0.0000286 | 0.00128 | |
| hsa-miR-16 | 0.2 | 0.0004448 | 0.0122 | |
| hsa-miR-451 | 0.2 | 0.0009 | 0.023 | |
| hsa-miR-29b | 0.16 | 0.0000016 | 0.000306 | |
| hsa-miR-126* | 0.14 | 0.0004009 | 0.0122 | |
| hsa-miR-142-5p | 0.1 | 0.0000029 | 0.000354 | |
| hsa-miR-223 | 0.064 | 0.0000058 | 0.000444 | |
| B. | ||||
| hsa-miR-181c* | 1.75 | 0.02934 | N/A | |
| hsa-miR-27a | 4.53 | 0.01469 | N/A | |
| C. | ||||
| hsa-miR-15b | 0.42 | 1.36E-05 | N/A | |
| hsa-miR-451 | 0.19 | 0.000422 | N/A | |
Figure 1.

An miRNA expression signature for osteosarcoma. (A) Unsupervised clustering of miRNA expression profiling from 18 pre-treatment tumor total RNA obtained from conventional osteosarcomas in comparison to 12 normal bone tissues. (B) Quantitative (q)RT-PCR confirmed differential expression for a subset of control and osteosarcoma samples and a subset of highlighted miRNAs. (C) Unsupervised clustering of miRNA expression profiles from 30 pre-treatment tumor total RNA samples of varied histologic subtypes, demonstrating co-clustering.
For validation, we performed qRT-PCR for a subset of the samples (Fig 1B). Specifically, qRT-PCR confirmed differential expression for 9 of the 34 significant OS (shown in Fig 1A) miRNAs among a random sampling of 7 specimens from OSs and 4 from controls. In particular, we confirmed the downregulation of miR-29b, miR-16, miR-142-5p, miR-26b, let7g, miR-223 and miR-451 in OS samples as compared to controls. By contrast, miR-181a and miR-181b showed significant up-regulation in OS cases (Fig 1B). In addition, miR-29a, expressed from the same locus as miR-29b, was checked by qRT-PCR as a separate validation of the same locus. Other than one sample in each of two of the qRT-PCR experiments, all osteosarcoma samples and control samples had distinct expression ranges, with no overlapping means.
Conventional, chondroblastic, and telangiectatic histologic subtypes of OS have distinct pathologic features. To interrogate the potential contribution of miRNA expression to the development of these different high-grade OS histologic subtypes, miRNA profiles from 18 conventional, 4 telangiectatic, 5 chondroblastic, 1 recurrent chondroblastic, 1 recurrent conventional, and 1 soft-tissue OSs were subjected to unsupervised hierarchical clustering. Conventional, telangiectatic, chondroblastic, and even soft-tissue OSs all clustered together in intermingled fashion (Fig 1C). All 4 telangiectatic OSs clustered to one side of the highest hierarchy division, characterized by elevated expression of miR-142-5p, miR-15a, miR-486-5p, and miR-488. Small sample size makes statistical resolution of this finding unfeasible. Both conventional and chondroblastic OSs clustered with those 4 telangiectatic OSs. The overall co-clustering of different subtypes suggests that with regard to miRNA expression, these tumors share more in common than not, which suggests that the miRNA expression represents more a shared oncogenic program than a differentiation profile alone, as these tumors are distinctly dissimilar in cell differentiation state. MiRNA profiling thereforemay not be helpful in defining histologically-based OS subtype classifications.
To validate against an alternate data set, the publicly available S-MED database (19) was queried for the 34 miRNAs highlighted by our OS signature. The 15 osteosarcoma samples (not subtyped) and 6 control bone samples recorded in the S-MED database had raw expression data for 26 of these miRNAs. Expression of 17 corroborated the differential expression in our samples (8 were significant with Student’s t-test p-values ranging from 0.006 to 5×10⁻⁸.) These statistically significant and concordant expression data included higher expression of miR-181c and miR-190 in S-MED OS specimens and lower expression of miR-16, miR-126*, miR-150, miR-195, miR-657, and miR-340. While the S-MED database includes fewer OS specimens than our primary data and lacks any clinical or pathologic annotation, it provides validation of the most important members of our osteosarcoma miRNA signature profile from an alternate sample source and profiling platform.
miR-181b is inversely correlated with miR-29b in OS
To confirm deregulation of miRNA expression within tumor cells specifically, in situ hybridization of probes anti-sense to the differentially expressed miR-181b and 29b was performed using formalin-fixed paraffin-embedded tissue sections processed from 9 of the same pre-treatment biopsy specimens from which fresh tissue for total RNA isolation had been initially banked. As shown in Fig 2, in situ hybridization with locked nucleic acid (LNA)-modified anti–miR-181b (B) or anti-miR-29b (C) probes showed results consistent with qRT-PCR (D). No signal was detected with scrambled oligo, demonstrating probe specificity (data not shown). Some tissues showed positive hybridization for the down-regulated miRNA-29b (Fig 2D). While down-regulation is not tantamount to absence, this nonetheless prompted further investigation. Using double-labeling for miR-29b and miR-181b, it was confirmed that expression did not co-localize to the same cells (Fig 2E, F), suggesting that the pro-osteoblast-differentiation miR-29b was specifically absent in cells with the most robust oncogenic program of miR-181b expression. Additional in situ hybridization validation was performed using a bone cancer tissue microarray (US Biomax, Inc. Rockville, Maryland, USA) that included 8 core tissue sections from 4 OSs. Four of the samples from 2 of the OS specimens demonstrated strong staining for miR-181b and minimal staining for miR-29b.
Figure 2.

Validation by in situ hybridization. Formalin-fixed, paraffin-embedded tissues from the same biopsies that rendered the total RNA samples were sectioned and stained with hematoxylin and eosin (A), or probed with anti-sense oligonucleotides against miR-181b (B) or miR-29b (C). The percent cells hybridizing to the tested probes were generated from counting 10 high powered fields (D). Samples with both miR-181 and miR-29b hybridization were subjected to cohybridization with differentially labeled detection systems, demonstrating little to no overlap in positive cells (miR-29b stained red in E and fluorescent green in F, miR-181 stained blue in E and fluorescent blue in F).
miRNA expression signatures for osteosarcoma metastasis and chemotherapeutic response
Ten OS patients either presented with or later developed clinically apparent metastatic disease. Their biologically aggressive tumors clustered together on unsupervised hierarchical clustering, loosely separate from the comparison 19 localized OSs (Fig 3A). Differentially expressed miRNAs included 1.75- and 4.53-fold increased expression of miR-181c* and miR-27a, respectively, in metastatic OSs. The class prediction analysis using these two miRNAs yielded a relatively strong ROC curve with an AUC of 0.805, indicating that the expression level of these two miRNAs alone discriminated between tumors that would and would not develop clinical metastases.
Figure 3.

miRNA expression profiling identifies behavioral subgroups of osteosarcoma. (A) Unsupervised clustering according to expression of miRNAs differentially expressed in pre-treatment samples from osteosarcomas that present or develop clinical metastasis or remain clinical localized through treatment and follow-up. (B) Unsupervised hierarchical clustering of osteosarcomas according their pre-treatment expression of miRNAs that correlate by Spearman correlation coefficient with percent necrosis following neoadjuvant chemotherapy. (C) Unsupervised hierarchical clustering of osteosarcomas according their pre-treatment expression of miRNAs that correlate by Pearson correlation coefficient with percent necrosis following neoadjuvant chemotherapy.
As OS patients typically receive chemotherapy after biopsy, but before resection, the percent necrosis or treatment effect noted by the pathologist in the resection specimen has been found to be a powerful prognostic tool (20). All OS patients with pre-treatment sample miRNA profiles available and who received neoadjuvant chemotherapy followed by resection and histopathologic grading of necrosis (n=27, Supplemental Table 1), were analyzed for a correlation between differentially expressed pretreatment miRNAs and the percent necrosis following chemotherapy. Spearman correlation, which measures the correlation of rank-ordering between two values, identified expression of 8 miRNAs positively correlated with percent necrosis at <0.01 stringency and 1 negatively correlated (Supplemental Table 2A; Fig 3B shows unsupervised clustering by Spearman-identified miRNAs). Pearson correlation, which identifies linear relationships rather than rankings, identified 7 miRNAs positively correlated with necrosis at <0.01 stringency (Supplemental Table 2B; Fig 3C shows unsupervised clustering by Pearson-identified miRNAs). MiR-451 and miR-15b, with the two highest Spearman correlation coefficients of 0.64 and 0.619, respectively, were also highlighted by the Pearson correlation list, having correlation coefficients of 0.533 and 0.539, respectively. Thus, increased expression of miR-15b (from the miR-15/16 family) and miR-451 in pre-treatment samples was the most stringent predictor of good response to chemotherapy. RT-PCR validated expression levels of miR-451 and miR-15b in a subset of chemosensitive and chemoresistant OS samples (Supplemental Figure 1).
Functional validation of miR-16 as tumor suppressive in OS cells
To determine the functional relevance of miRNA deregulation in OS, we studied the effect of miR-16 and miR-27a manipulation on OS cells. We first checked the endogenous miR-16 and miR-27a levels by qRTPCR in one human osteoblast and 6 human osteosarcoma cell lines. Three OS cell lines (HOS, KHOS and U2OS) exhibited significantly low levels of miR-16 as compared to hOB (Supplementary Fig S2). Similarly, miR-27a expression levels were lower in these cells while the MG-63 cells, capable of metastasis and the highly metastatic LM-7 cells displayed higher levels (Supplementary Fig S2).
Next, we set to determine whether re-introduction of these miRs affected the tumorigenic traits of OS cells (Supplementary Fig S3, 4). Using XTT test, we observed significant growth inhibition in U2OS and hOB cells (Supplementary Fig S5). In contrast, we did not detect this effect in HOS, KHOS and SaOS2 cells (Fig 4A, Supplementary Fig S5). Nevertheless, overexpression of miR-16 in OS cells displaying low levels of endogenous miR-16 was associated with significant reduction in colony formation ability (Fig 4B and Supplementary Fig S5). Moreover, HOS expressing miR-16 displayed increased apoptosis in the presence of doxorubicin (Figure 4C).
Figure 4.
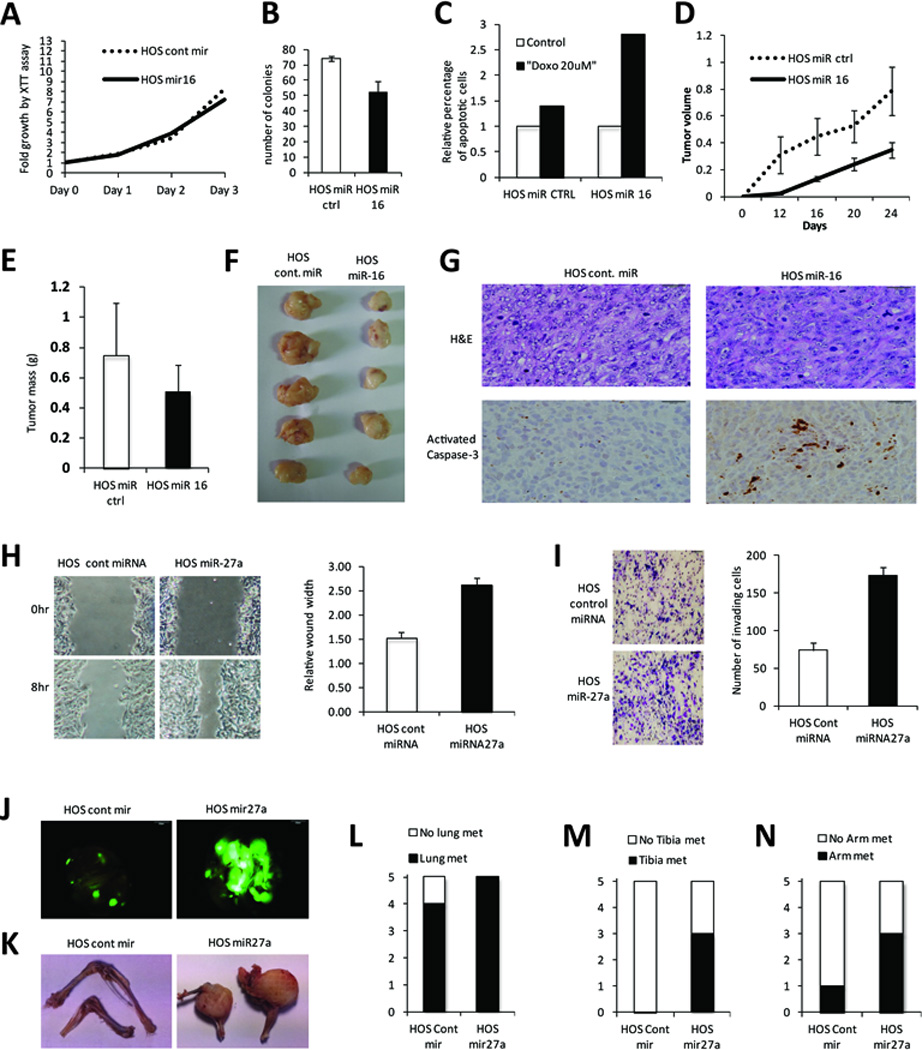
Functional validation of miR-16 and miR-27a in the HOS osteosarcoma cell line. A. XTT assay demonstrates no significant proliferative effect of miR-16 overexpression by lentivirus, compared to scrambled miR control. B. Assessment of colony formation confirms tumor-suppressive role for miR-16. C. Apoptotic response following exposure to doxorubicin demonstrates a chemosensitizing role. D. HOS miR-16 or control cells were injected subcutaneously into the flanks of NOD-SCID mice; tumor volume (cm3) was assessed every week. E. Tumor mass (in grams) was measured at the end of the experiment. F. Representative tumor masses excised from mice. G. H&E staining and activated caspase-3 immunohistochemistry on paraffin-embedded sections of representative tumors (brown color indicates act. Casp3 positivity). H. Migration assay (wound-healing) of HOS-miR-27a or control cells monitored in serum free media for 8hrs. I. Matrigel invasion assay of HOS-miR27a and control cells monitored using Boyden chambers. J. HOS-miR-27a or control cells were injected intravenously into the tail vein of NOD/SCID mice and microscopic and macroscopic metastasis assessed at 6-weeks by GFP fluorescence in the lungs. K. Representative pictures of the forearms and tibias of the same animals. L-N. Quantification of the metastasis positive animals in the indicated organs.
We next evaluated the tumor suppressor function of miR-16 in vivo. HOS cells overexpressing control miR or miR-16 were xenografted into the flanks of NOD/SCID mice and monitored for tumor formation. We found that overexpressing miR-16 produced tumors of smaller volume and smaller final mass (Figure 4D–F). Furthermore, miR-16 overexpressing HOS xenografts exhibited increased activated caspase-3 staining (Figure 4G), an indicator of enhanced apoptosis in the absence of cytotoxic treatment.
Functional validation of miR-27a as pro-metastatic in OS cells
In order to interrogate the impact of miR-27a overexpression on the metastatic potential of OS cells, we infected HOS cells with a lentiviral vector that expresses either miR-27a or control miR along with a green fluorescent protein (GFP) reporter. In vitro, a wound healing assay demonstrated increased migration with overexpression of miR-27a versus control miR (Figure 4H). Similarly, matrigel invasion assay showed that miR-27a increased invasiveness (Figure 4I). miR-27a expressing cells were next injected intravenously into NOD/SCID mice to evaluate the metastatic potential of these cells. Six weeks later, the animals were scarified and dissected to look for both microscopic and macroscopic metastases. We found that overexpression of miR-27a is associated with increased ability to form metastatic foci compared to control miR. The number and size of pulmonary metastases was significantly increased as well as the presence of macroscopic metastatic disease in the bones of the legs and forearms (Figure 4J–N). Additional functional validation in other cell lines confirmed pro-migration and invasion effects of miR-27a (Supplementary Fig S5).
Predicted targets of differentially expressed miRNAs reflected in osteosarcoma
MiRNAs are known to have downregulatory effects at the level of transcript longevity and translational control. Expression levels of TargetScan-predicted target genes of miR-16 were found to be reduced in OS and osteoblast cell lines following overexpression of miR-16 (Fig 5A). Similarly, expression levels of predicted target genes of miR-27a were found to be reduced in OS cell lines following overexpression of miR-27a (Fig 5B).
Figure 5.
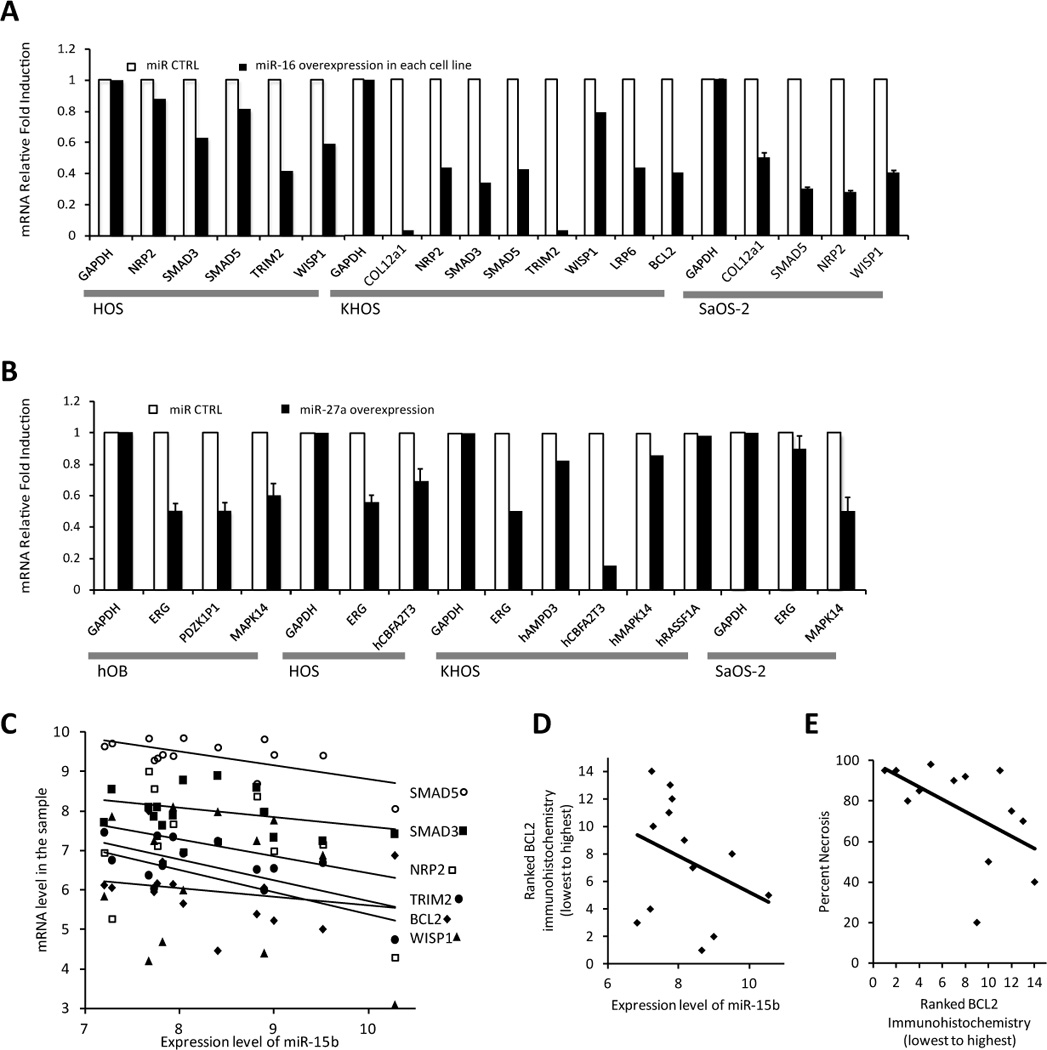
Predicted targets respond to miR expression levels. A. HOS, KHOS, and SaOS-2 osteosarcoma cell lines stably transfected by lentivirus with an overexpression vector of miR-16 or scrambled miR control demonstrated reduced levels of TargetScan predicted target genes by qRT-PCR. B. Functional validation of miR-27a versus scrambled control miR in osteoblasts and osteosarcoma cell lines demonstrate dowregulation of TargetScan predicted target gene mRNAs, shown here by qRT-PCR. C. The Affymetrix array expression level of these same predicted miR-15/16 family targets are plotted against miR-15b levels by sample and each linear regression follows the expected correlation direction. D. Blindly ranked BCL2 protein levels ascertained by immunohistochemistry correlate even more strongly than transcript levels with miR-15b levels by specimen. E. This BCL2 immunohistochemical ranking also correlates with the predicted chemoresponsiveness of tumors.
We expanded the analysis of expression of target genes by profiling gene expression by Affymetrix array in 14 of the OS samples in our cohort and 4 of the normal bone control samples. Our data revealed differential changes in a significant number of genes (data not shown). The miRNA and mRNA expression profiles were then integrated to identify functional relationships that may contribute to OS. Instead of correlating gene expression with all miRNAs, we focused on miRNAs whose differential expression was most significant in OS; miR-16, miR-142-5p, miR-29b as down-regulated miRNAs in OS and miR-181 and miR-27a as up-regulated miRNAs in OS. Positive and negative correlations were found. However, we focused on the differentially expressed genes that followed the directional change predicted by the miRNA; increased expression in OS for genes targeted by miR-16, miR-142-5p, and miR-29b, and decreased expression of genes targeted by miR-181 and miR-27a (Supplementary Tables 3A–3B). We found that several known OS genes are indeed targeted by these different miRNA classes. Gene ontologies and Kegg pathways analyses of these predicted target genes highlighted significant changes in transcriptional regulation, cell cycle control, and known cancer signaling pathways (Table 2 and Supplementary Tables 4 and 5).
Table 2.
Kegg pathway analysis of Target Scan predicted target genes of miR-16, miR-142-5p, and miR- 29b that were confirmed to have increased expression in osteosarcomas by affymetrix cDNA profiling.
| Kegg Pathway Term | Gene Count | Fold-enrichment | p-value |
|---|---|---|---|
| Pathways in cancer | 29 | 3.5 | 6.64×10−09 |
| Focal adhesion | 26 | 5.1 | 1.65×10⁻¹¹ |
| Small cell lung cancer | 16 | 7.5 | 1.72×10−09 |
| Regulation of actin cytoskeleton | 16 | 2.9 | 3.11×10−04 |
| ECM-receptor interaction | 14 | 6.5 | 1.33×10−07 |
| Neurotrophin signaling pathway | 14 | 4.4 | 1.23×10−05 |
| Axon guidance | 14 | 4.2 | 1.90×10−05 |
| Wnt signaling pathway | 11 | 2.8 | 0.004713 |
| Ubiquitin mediated proteolysis | 10 | 2.9 | 0.007635 |
| Colorectal cancer | 9 | 4.2 | 0.001193 |
| T cell receptor signaling pathway | 9 | 3.3 | 0.005802 |
| Glioma | 8 | 5.0 | 9.75×10−04 |
| Melanoma | 8 | 4.4 | 0.001982 |
| Pancreatic cancer | 8 | 4.3 | 0.002149 |
| Chronic myeloid leukemia | 8 | 4.2 | 0.00272 |
| TGF-beta signaling pathway | 8 | 3.6 | 0.006232 |
| Prostate cancer | 8 | 3.5 | 0.007049 |
| Renal cell carcinoma | 7 | 3.9 | 0.008248 |
Genes in each pathway are shown in Supplement Table 4 (A shows the Gene Ontology groups and B identifies Kegg pathway specific genes.)
To further investigate one miRNA as an example, miR-15b from miR-15/16 family was selected due to the fact that it showed differential expression within the cohort of osteosarcomas and predicted chemosensitivity. The expression level of miR-15b from each specimen was plotted against the Affymetrix mRNA level in the same sample for six of the prominent differentially expressed genes that are predicted targets and responsive in cell line experiments (Fig 5C). A linear regression trendline for each series showed the predicted direction of correlation with increasing level of miR-15b linked to decreasing levels of each gene's mRNA.
Because miRNAs can have more profound effects on translation than transcription, we performed immunohistochemistry in tissue sections from a subset of the OS samples. We selected two genes, one a well-known gene in osteosarcoma, BCL2, the other a gene not previously associated with osteosarcoma, but also a target of the miR-15/16 family, NFAT5. For both, immunohistochemistry confirmed increased protein presence in the cohort OSs than in the osteoblasts of bone marrow controls (Supplementary Fig S6). The BCL2-immunohistochemically stained sections were blindly ranked from least to most positive for staining. This ranking was then plotted against the expression level of miR-15b (Fig 5D) and against the expected clinical parameter of percent necrosis as measured from later resection surgery to quantify chemoresponsiveness (Fig 5E). Linear regressions strongly followed the expected correlation in each. While these correlations only consider one example, they suggest that the differentially expressed miRNAs play a direct role in controlling transcript levels and translational success of predicted target genes in OS.
Discussion
We report unique OS signatures of miRNA expression related to the OS character and pathogenesis, to clinical metastasis, and to chemotherapy response. The deregulation of miR-181b specifically in the malignant cells in OS tissues by in situ hybridization provides a potential OS marker. Further, miR-181b and miR-29b expression inversely correlate in subpopulations of cells in the tumors. Significantly, our in vitro and in vivo functional experiments validate miR-16 as a tumor suppressor and miR-27a as pro-metastatic in OS and osteoblast cell lines. These data suggest potential targets for future therapeutic strategies. Further, our study indicates that by correlating genome wide gene and miRNA expression profiles, putative functional miRNA-mRNA interactions could be identified in OS.
The conventional OS miRNA expression signature we report showed strong statistical significance even in a relatively small sample size. This suggests profile consistency across the samples. Given the genetic and cytogenetic complexity inherent to OS (2), this consistency raises the possibility that miRNAs play a central role in osteosarcomagenesis. That the miRNA profile differed little even among histologically disparate samples from chondroblastic and telangiectatic OSs further suggests a role for these miRNAs in development of OS generally. Validation against another patient group confirmed the differential expression of the critical members of this (19). A final validation of our signature derives from our observation that some of the prominent signature miRNAs are also highlighted by OS metastasis and chemotherapy responsiveness signatures (Supplementary Fig S7).
As we qualitatively evaluate these signature OS miRNAs, downregulated miRNAs are most striking. MiR-29b figured prominently in this list. We also demonstrated its localization to a distinct cell subpopulation within the tumors. This fits the powerful role of miR-29b as a pro-differentiation miRNA in normal osteoblasts (21). Other signature downregulated miRNAS have known pro-differentiation roles in other tissues, miR-223 in myeloid (22) and miR-451 in erythroid differentiation (23). MiR-29b is also known as a tumor suppressor miRNA (24). The tumor suppressor category also encompasses other prominently downregulated members of the signature profile, including miR-142-5p (25), miR-340 (26), breast cancer metastasis suppressing miR-335 (27), BCL-2 targeting miR-16/16-2* (Reviewed in (28)), miR-126/126* (Reviewed in (29)), and miR-195 (30), a miR-15/16-related miRNA. Together with our in vitro functional validation for miR-16, these findings highlight critical tumor-suppressor functions of the miR-15/16 family in OS.
Most upregulated miRNAs in the OS signature are known oncomiRs, such as miR-190 (31), miR-10b ((32) and references therein), miR-7 ((33) and references therein), miR-214 ((34) and references therein), and miR-210 (35). Although miR-574-3p is not well-characterized in the literature, it is predicted to target disabled homolog 2 interacting protein (DAB2IP), which is silenced in a number of cancers (36–38), retinoid X receptor alpha (RXRA), which is associated with vitamin D metabolism and polymorphism-based cancer risk (39), and FOS like antigen 2 (Fosl2/Fra2), which is a pro-differentiation gene in osteoblasts (40). Most prominently, three of the four miRNAs from the miR-181 group were highly upregulated in OS samples. MiR-181 has been associated with stemness and poor prognosis in other cancers ((41) and references therein). Further, miR-181 activates Wnt signaling (42), important in OS pathogenesis (43). Together with our in situ hybridization confirmation that miR-181 identifies a subgroup of cells within OS tissues that lack miR-29b-driven differentiation, these data highlight miR-181 as a critical OS oncomiR.
Increased expression of miR-181c* and miR-27a at pre-treatment biopsy was found to be prognostic of metastatic disease. This punctuates the importance of the miR-181 family to OS. miR27a is a known oncomiR, associated with metastasis in gastric cancer (44) and poor prognosis in ovarian carcinoma (45). Our in vitro and in vivo experiments confirmed that miR-27a overexpression enhances migration, invasion, and proliferation in metastatic sites. These findings correlate with the recently described inhibition of osteoblast differentiation by miR-27a (18). Targeted therapies against miR-27a are emerging (46, 47).
Expression levels of miR-451 and miR-15b in pre-treatment specimens both correlated positively with percent necrosis following neoadjuvant chemotherapy. Reduced expression of miR-451 was also prominent in the general OS signature. While miR-15b itself was not highlighted in the general OS signature, miR-16, miR16-2*, and miR-195, all from the same miR-15/16 family, were. Apparently, reduced expression of these miRNAs characterizes OS generally, but among OSs, further reduced expression correlates with resistance to chemotherapy. MiR-15b and other family members target Bcl-2, which could explain their downregulation in chemo-resistant tumors (48). We confirmed by immunohistochemistry the increased presence of BCL-2 in the OS histologic specimens compared to controls. Further, increased apoptosis was identified both in untreated xenografts and doxorubicin-treated cultures of OS cells driven to overexpress miR-16. Our findings did not corroborate any of the specific miRNAs reported to predict chemotherapeutic response in a series of formalin-fixed paraffin-embedded OS specimens (10). This other study differed in source and method of RNA isolation. It also focused on ifosfamide, an infrequent neoadjuvant chemotherapy for OS in the United States and received by only one of our patients. Further, our findings did not highlight any of the previously investigated individual miRNAs noted to have roles in osteosarcoma cell lines(6–9).
The profound effects of miR-16, miR-142-5p, miR-29b, miR-181, and miR-27a on the microarray-defined expression of their predicted target genes, with statistically significant differences in the predicted direction, suggest that these miRNAs play central roles in defining the expression identity of OS. Our study reveals many potential functional miRNA-mRNA relationships that will need to be further explored mechanistically for their involvement in OS pathogenesis. Gain and loss of function studies are needed to investigate further the role of these miRNAs that have correlated with transcriptional regulation, cell cycle control, and known cancer signaling pathways. Finally, the discovery of previously unidentified functional relationships may lead to the development of novel therapeutic approaches. Further investigation into the potentially more poignant effects on translation of their targets may yield additional insights into this newly recognized method of an OS cell defining itself.
Making clear sense of how the genetic chaos that defines OS derives such a patterned clinical disease remains a distant goal, but these data strongly recommend the pursuit of osteosarcomiRs and silenced OS tumor suppressor miRNAs as critically associated with development of OS. The statistical strength of the OS signature we report, the consistency across multiple histologic subtypes, and especially the overlap of the general OS signature with signatures predictive of metastasis and predictive of response to chemotherapy all highlight the central role of these dysregulated miRNAs in osteosarcomagenesis. Our validation studies for key signature OS miRNAs and integration of miRNA expression with mRNA expression, together with existing literature provide models for future study.
Supplementary Material
Acknowledgements
The authors wish to thank Saleh Khwaled and Suhaib Abdeen from Hebrew University for assistance with mice work, John J. Wixted from the University of Massachusetts, Worcester, for assistance in procuring control bone specimens, David LaPointe, also from the University of Massachusetts, Worcester, for assistance with bioinformatics analysis, and Huifeng Jin and Mohamed Salama from the University of Utah for assistance with immunohistochemistry.
Grant Support: This work was supported, in part, by the Alex’s Lemonade Stand Foundation (ALSF) ‘A’ Award to R.I. Aqeilan, and Israeli Cancer Research Funds (ICRF) to R.I. Aqeilan and Z. Salah. K. B. Jones is supported by the National Cancer Institute (NIH) K08CA138764 and the Huntsman Cancer Foundation. R. L. Randall is supported by the Huntsman Cancer Foundation. G. S. Stein and J. B. Lian are supported by NIH/NIAMS AR039588-19. S. Volinia is supported by AIRC (IG 8588) and PRIN MIUR 2008.
Footnotes
Conflict of Interest: The authors declare no competing financial interests in relation to the work described.
References
- 1.Ottaviani G, Jaffe N. The epidemiology of osteosarcoma. Cancer Treat Res. 2009;152:3–13. doi: 10.1007/978-1-4419-0284-9_1. [DOI] [PubMed] [Google Scholar]
- 2.Gorlick R. Current concepts on the molecular biology of osteosarcoma. Cancer Treat Res. 2009;152:467–478. doi: 10.1007/978-1-4419-0284-9_27. [DOI] [PubMed] [Google Scholar]
- 3.Bacci G, Bertoni F, Longhi A, Ferrari S, Forni C, Biagini R, et al. Neoadjuvant chemotherapy for high-grade central osteosarcoma of the extremity. Histologic response to preoperative chemotherapy correlates with histologic subtype of the tumor. Cancer. 2003;97:3068–3075. doi: 10.1002/cncr.11456. [DOI] [PubMed] [Google Scholar]
- 4.Lewis BP, Burge CB, Bartel DP. Conserved seed pairing, often flanked by adenosines, indicates that thousands of human genes are microRNA targets. Cell. 2005;120:15–20. doi: 10.1016/j.cell.2004.12.035. [DOI] [PubMed] [Google Scholar]
- 5.Croce CM. Causes and consequences of microRNA dysregulation in cancer. Nat Rev Genet. 2009;10:704–714. doi: 10.1038/nrg2634. [DOI] [PMC free article] [PubMed] [Google Scholar]
- 6.Ziyan W, Shuhua Y, Xiufang W, Xiaoyun L. MicroRNA-21 is involved in osteosarcoma cell invasion and migration. Med Oncol. 2011;28:1469–1474. doi: 10.1007/s12032-010-9563-7. [DOI] [PubMed] [Google Scholar]
- 7.Zhang H, Cai X, Wang Y, Tang H, Tong D, Ji F. microRNA-143, down-regulated in osteosarcoma, promotes apoptosis and suppresses tumorigenicity by targeting Bcl-2. Oncol Rep. 2010;24:1363–1369. doi: 10.3892/or_00000994. [DOI] [PubMed] [Google Scholar]
- 8.Song B, Wang Y, Xi Y, Kudo K, Bruheim S, Botchkina GI, et al. Mechanism of chemoresistance mediated by miR-140 in human osteosarcoma and colon cancer cells. Oncogene. 2009;28:4065–4074. doi: 10.1038/onc.2009.274. [DOI] [PMC free article] [PubMed] [Google Scholar]
- 9.He C, Xiong J, Xu X, Lu W, Liu L, Xiao D, et al. Functional elucidation of MiR-34 in osteosarcoma cells and primary tumor samples. Biochem Biophys Res Commun. 2009;388:35–40. doi: 10.1016/j.bbrc.2009.07.101. [DOI] [PubMed] [Google Scholar]
- 10.Gougelet A, Pissaloux D, Besse A, Perez J, Duc A, Dutour A, et al. Micro-RNA profiles in osteosarcoma as a predictive tool for ifosfamide response. Int J Cancer. 2010;129:680–690. doi: 10.1002/ijc.25715. [DOI] [PubMed] [Google Scholar]
- 11.Randall RL, Wade M, Albritton K, Joyner D. Retrieval yield of total and messenger RNA in mesenchymal tissue ex vivo. Clin Orthop Relat Res. 2003:59–63. doi: 10.1097/01.blo.0000093897.12372.88. [DOI] [PubMed] [Google Scholar]
- 12.Liu CG, Calin GA, Volinia S, Croce CM. MicroRNA expression profiling using microarrays. Nat Protoc. 2008;3:563–578. doi: 10.1038/nprot.2008.14. [DOI] [PubMed] [Google Scholar]
- 13.Simon R, Lam A, Li MC, Ngan M, Menenzes S, Zhao Y. Analysis of gene expression data using BRB-ArrayTools. Cancer Inform. 2007;3:11–17. [PMC free article] [PubMed] [Google Scholar]
- 14.Bartel DP. MicroRNAs: genomics, biogenesis, mechanism, and function. Cell. 2004;116:281–297. doi: 10.1016/s0092-8674(04)00045-5. [DOI] [PubMed] [Google Scholar]
- 15.Shi R, Chiang VL. Facile means for quantifying microRNA expression by real-time PCR. Biotechniques. 2005;39:519–525. doi: 10.2144/000112010. [DOI] [PubMed] [Google Scholar]
- 16.Valeri N, Gasparini P, Fabbri M, Braconi C, Veronese A, Lovat F, et al. Modulation of mismatch repair and genomic stability by miR-155. Proc Natl Acad Sci U S A. 2010;107:6982–6987. doi: 10.1073/pnas.1002472107. [DOI] [PMC free article] [PubMed] [Google Scholar]
- 17.Nuovo GJ, Elton TS, Nana-Sinkam P, Volinia S, Croce CM, Schmittgen TD. A methodology for the combined in situ analyses of the precursor and mature forms of microRNAs and correlation with their putative targets. Nat Protoc. 2009;4:107–115. doi: 10.1038/nprot.2008.215. [DOI] [PMC free article] [PubMed] [Google Scholar]
- 18.Hassan MQ, Gordon JA, Beloti MM, Croce CM, van Wijnen AJ, Stein JL, et al. A network connecting Runx2, SATB2, and the miR-23a~27a~24-2 cluster regulates the osteoblast differentiation program. Proc Natl Acad Sci U S A. 2010;107:19879–19884. doi: 10.1073/pnas.1007698107. [DOI] [PMC free article] [PubMed] [Google Scholar]
- 19.Sarver AL, Phalak R, Thayanithy V, Subramanian S. S-MED: sarcoma microRNA expression database. Lab Invest. 2010;90:753–761. doi: 10.1038/labinvest.2010.53. [DOI] [PubMed] [Google Scholar]
- 20.Glasser DB, Lane JM, Huvos AG, Marcove RC, Rosen G. Survival, prognosis, and therapeutic response in osteogenic sarcoma. The Memorial Hospital experience. Cancer. 1992;69:698–708. doi: 10.1002/1097-0142(19920201)69:3<698::aid-cncr2820690317>3.0.co;2-g. [DOI] [PubMed] [Google Scholar]
- 21.Li Z, Hassan MQ, Jafferji M, Aqeilan RI, Garzon R, Croce CM, et al. Biological functions of miR-29b contribute to positive regulation of osteoblast differentiation. J Biol Chem. 2009;284:15676–15684. doi: 10.1074/jbc.M809787200. [DOI] [PMC free article] [PubMed] [Google Scholar]
- 22.Vasilatou D, Papageorgiou S, Pappa V, Papageorgiou E, Dervenoulas J. The role of microRNAs in normal and malignant hematopoiesis. Eur J Haematol. 2010;84:1–16. doi: 10.1111/j.1600-0609.2009.01348.x. [DOI] [PubMed] [Google Scholar]
- 23.Patrick DM, Zhang CC, Tao Y, Yao H, Qi X, Schwartz RJ, et al. Defective erythroid differentiation in miR-451 mutant mice mediated by 14-3-3zeta. Genes Dev. 2010;24:1614–1619. doi: 10.1101/gad.1942810. [DOI] [PMC free article] [PubMed] [Google Scholar]
- 24.Eyholzer M, Schmid S, Wilkens L, Mueller BU, Pabst T. The tumour-suppressive miR-29a/b1 cluster is regulated by CEBPA and blocked in human AML. Br J Cancer. 2010;103:275–284. doi: 10.1038/sj.bjc.6605751. [DOI] [PMC free article] [PubMed] [Google Scholar]
- 25.Sempere LF, Liu X, Dmitrovsky E. Tumor-suppressive microRNAs in Lung cancer: diagnostic and therapeutic opportunities. ScientificWorldJournal. 2009;9:626–628. doi: 10.1100/tsw.2009.88. [DOI] [PMC free article] [PubMed] [Google Scholar]
- 26.Guled M, Lahti L, Lindholm PM, Salmenkivi K, Bagwan I, Nicholson AG, et al. CDKN2A, NF2, and JUN are dysregulated among other genes by miRNAs in malignant mesothelioma -A miRNA microarray analysis. Genes Chromosomes Cancer. 2009;48:615–623. doi: 10.1002/gcc.20669. [DOI] [PubMed] [Google Scholar]
- 27.Tavazoie SF, Alarcon C, Oskarsson T, Padua D, Wang Q, Bos PD, et al. Endogenous human microRNAs that suppress breast cancer metastasis. Nature. 2008;451:147–152. doi: 10.1038/nature06487. [DOI] [PMC free article] [PubMed] [Google Scholar]
- 28.Aqeilan RI, Calin GA, Croce CM. miR-15a and miR-16-1 in cancer: discovery, function and future perspectives. Cell Death Differ. 2010;17:215–220. doi: 10.1038/cdd.2009.69. [DOI] [PubMed] [Google Scholar]
- 29.Meister J, Schmidt MH. miR-126 and miR-126*: new players in cancer. ScientificWorldJournal. 2010;10:2090–2100. doi: 10.1100/tsw.2010.198. [DOI] [PMC free article] [PubMed] [Google Scholar]
- 30.Liu L, Chen L, Xu Y, Li R, Du X. microRNA-195 promotes apoptosis and suppresses tumorigenicity of human colorectal cancer cells. Biochem Biophys Res Commun. 2010;400:236–240. doi: 10.1016/j.bbrc.2010.08.046. [DOI] [PubMed] [Google Scholar]
- 31.Zhang Y, Li M, Wang H, Fisher WE, Lin PH, Yao Q, et al. Profiling of 95 microRNAs in pancreatic cancer cell lines and surgical specimens by real-time PCR analysis. World J Surg. 2009;33:698–709. doi: 10.1007/s00268-008-9833-0. [DOI] [PMC free article] [PubMed] [Google Scholar]
- 32.Ma L, Reinhardt F, Pan E, Soutschek J, Bhat B, Marcusson EG, et al. Therapeutic silencing of miR-10b inhibits metastasis in a mouse mammary tumor model. Nat Biotechnol. 2010;28:341–347. doi: 10.1038/nbt.1618. [DOI] [PMC free article] [PubMed] [Google Scholar]
- 33.Chou YT, Lin HH, Lien YC, Wang YH, Hong CF, Kao YR, et al. EGFR promotes lung tumorigenesis by activating miR-7 through a Ras/ERK/Myc pathway that targets the Ets2 transcriptional repressor ERF. Cancer Res. 2010;70:8822–8831. doi: 10.1158/0008-5472.CAN-10-0638. [DOI] [PubMed] [Google Scholar]
- 34.Qiang R, Wang F, Shi LY, Liu M, Chen S, Wan HY, et al. Plexin-B1 is a target of miR-214 in cervical cancer and promotes the growth and invasion of HeLa cells. Int J Biochem Cell Biol. 2011;43:623–641. doi: 10.1016/j.biocel.2011.01.002. [DOI] [PubMed] [Google Scholar]
- 35.Zhang Z, Sun H, Dai H, Walsh RM, Imakura M, Schelter J, et al. MicroRNA miR-210 modulates cellular response to hypoxia through the MYC antagonist MNT. Cell Cycle. 2009;8:2756–2768. doi: 10.4161/cc.8.17.9387. [DOI] [PubMed] [Google Scholar]
- 36.Yano M, Toyooka S, Tsukuda K, Dote H, Ouchida M, Hanabata T, et al. Aberrant promoter methylation of human DAB2 interactive protein (hDAB2IP) gene in lung cancers. Int J Cancer. 2005;113:59–66. doi: 10.1002/ijc.20531. [DOI] [PubMed] [Google Scholar]
- 37.Qiu GH, Xie H, Wheelhouse N, Harrison D, Chen GG, Salto-Tellez M, et al. Differential expression of hDAB2IPA and hDAB2IPB in normal tissues and promoter methylation of hDAB2IPA in hepatocellular carcinoma. J Hepatol. 2007;46:655–663. doi: 10.1016/j.jhep.2006.11.012. [DOI] [PubMed] [Google Scholar]
- 38.Xie D, Gore C, Liu J, Pong RC, Mason R, Hao G, et al. Role of DAB2IP in modulating epithelial-to-mesenchymal transition and prostate cancer metastasis. Proc Natl Acad Sci U S A. 2010;107:2485–2490. doi: 10.1073/pnas.0908133107. [DOI] [PMC free article] [PubMed] [Google Scholar]
- 39.Karami S, Brennan P, Navratilova M, Mates D, Zaridze D, Janout V, et al. Vitamin d pathway genes, diet, and risk of renal cell carcinoma. Int J Endocrinol. 2010;2010:879362. doi: 10.1155/2010/879362. [DOI] [PMC free article] [PubMed] [Google Scholar]
- 40.Bozec A, Bakiri L, Jimenez M, Schinke T, Amling M, Wagner EF. Fra-2/AP-1 controls bone formation by regulating osteoblast differentiation and collagen production. J Cell Biol. 2010;190:1093–1106. doi: 10.1083/jcb.201002111. [DOI] [PMC free article] [PubMed] [Google Scholar]
- 41.Wang Y, Yu Y, Tsuyada A, Ren X, Wu X, Stubblefield K, et al. Transforming growth factor-beta regulates the sphere-initiating stem cell-like feature in breast cancer through miRNA-181 and ATM. Oncogene. 2011;30:1470–1480. doi: 10.1038/onc.2010.531. [DOI] [PMC free article] [PubMed] [Google Scholar]
- 42.Qin L, Chen Y, Niu Y, Chen W, Wang Q, Xiao S, et al. A deep investigation into the adipogenesis mechanism: profile of microRNAs regulating adipogenesis by modulating the canonical Wnt/beta-catenin signaling pathway. BMC Genomics. 2010;11:320. doi: 10.1186/1471-2164-11-320. [DOI] [PMC free article] [PubMed] [Google Scholar]
- 43.Guo Y, Zi X, Koontz Z, Kim A, Xie J, Gorlick R, et al. Blocking Wnt/LRP5 signaling by a soluble receptor modulates the epithelial to mesenchymal transition and suppresses met and metalloproteinases in osteosarcoma Saos-2 cells. J Orthop Res. 2007;25:964–971. doi: 10.1002/jor.20356. [DOI] [PubMed] [Google Scholar]
- 44.Katada T, Ishiguro H, Kuwabara Y, Kimura M, Mitui A, Mori Y, et al. microRNA expression profile in undifferentiated gastric cancer. Int J Oncol. 2009;34:537–542. [PubMed] [Google Scholar]
- 45.Eitan R, Kushnir M, Lithwick-Yanai G, David MB, Hoshen M, Glezerman M, et al. Tumor microRNA expression patterns associated with resistance to platinum based chemotherapy and survival in ovarian cancer patients. Gynecol Oncol. 2009;114:253–259. doi: 10.1016/j.ygyno.2009.04.024. [DOI] [PubMed] [Google Scholar]
- 46.Sun Q, Cong R, Yan H, Gu H, Zeng Y, Liu N, et al. Genistein inhibits growth of human uveal melanoma cells and affects microRNA-27a and target gene expression. Oncol Rep. 2009;22:563–567. doi: 10.3892/or_00000472. [DOI] [PubMed] [Google Scholar]
- 47.Chintharlapalli S, Papineni S, Abdelrahim M, Abudayyeh A, Jutooru I, Chadalapaka G, et al. Oncogenic microRNA-27a is a target for anticancer agent methyl 2-cyano-3,11-dioxo-18beta-olean-1,12-dien-30-oate in colon cancer cells. Int J Cancer. 2009;125:1965–1974. doi: 10.1002/ijc.24530. [DOI] [PMC free article] [PubMed] [Google Scholar]
- 48.Xia L, Zhang D, Du R, Pan Y, Zhao L, Sun S, et al. miR-15b and miR-16 modulate multidrug resistance by targeting BCL2 in human gastric cancer cells. Int J Cancer. 2008;123:372–379. doi: 10.1002/ijc.23501. [DOI] [PubMed] [Google Scholar]
Associated Data
This section collects any data citations, data availability statements, or supplementary materials included in this article.