

Abstract
The current study tested the accuracy of primary MRI and cerebrospinal fluid (CSF) biomarker candidates and neuropsychological tests for predicting the conversion from mild cognitive impairment (MCI) to Alzheimer's disease (AD) dementia. In a cross-validation paradigm, predictor models were estimated in the training set of AD (N = 81) and elderly control subjects (N = 101). A combination of CSF t-tau/Aβ1-4 ratio and MRI biomarkers or neuropsychological tests (free recall and trail making test B (TMT-B)) showed the best statistical fit in the AD vs. HC comparison, reaching a classification accuracy of up to 64% when applied to the prediction of MCI conversion (3.3-year observation interval, mean = 2.3 years). However, several single-predictor models showed a predictive accuracy of MCI conversion comparable to that of any multipredictor model. The best single predictors were right entorhinal cortex (prediction accuracy = 68.5% (95% CI (59.5, 77.4))) and TMT-B test (prediction accuracy 64.6% (95% CI (55.5, 73.4%))). In conclusion, short-term conversion to AD is predicted by single marker models to a comparable degree as by multimarker models in amnestic MCI subjects.
Keywords: Alzheimer's disease, Dementia, Mild cognitive impairment, Mild cognitive impairment (MCI), Autopsy-confirmation, Biomarkers, Early detection, Cerebrospinal fluid, Cerebrospinal fluid (CSF), Aβ1-42, Tau, p-tau, MRI, Hippocampus, Volumetry, Entorhinal cortex, Prodromal, ADNI
1. Introduction
Alzheimer's disease (AD) is a complex chronically progressive neurodegenerative disease and the most common form of dementia. The prevalence of clinically manifest AD is about 2% at the age of 65 years but increases to about 30% at the age of 85 years (Wimo et al., 1997).
At the mildest clinical stage of AD pathology, the clinical diagnosis is challenging since dementia symptoms are not yet fully expressed. Mild cognitive impairment (MCI) with aging is a clinical syndrome of focal cognitive impairment that has been associated with increased risk of AD (Petersen et al., 1999). However, MCI may stem from a variety of different etiologies and pathologies and shows sometimes high rates of reversion back to normal, suggesting that the clinical symptoms of MCI can occur due to causes other than underlying AD pathology (Ritchie et al., 2001). Thus, at an early stage, the diagnosis of AD is inherently difficult when based upon clinical symptoms only.
The biomarker-based assessment of the neuropathological characteristics of AD has been proposed to enhance the clinical detection of AD in early prodromal stages of the disease (Dubois et al., 2007). The rationale for the use of biomarkers in diagnostics is that these biological tests may enable us to detect AD pathology to determine whether the MCI symptoms are due to AD pathology and represent early stage, prodromal AD. Such an etiological classification is important for the timely administration of disease modifying drugs, such as Aβ immunization currently tested in clinical trials, to prevent or slow down the clinical manifestation of AD-type dementia. Among the primary biomarker candidates recommended by consensus expert groups on biomarkers (Frank et al., 2003) are cerebrospinal fluid (CSF) based measures of phosphorylated Tau protein (p-tau), t-tau protein, beta amyloid peptide (Aβ1-42) (Blennow and Hampel, 2003; Herukka et al., 2005; Hansson et al., 2006; Ewers et al., 2007) as well as MRI-based assessments of the hippocampus and entorhinal cortex (Jack et al., 1999; Kantarci and Jack, 2003; Schuff et al., 2009). The hippocampus shows characteristic global and local subfield structural changes that are specific for AD in early stages of the disease (Csernansky et al., 2000; Frisoni et al., 2008; Wang et al., 2009). Entorhinal cortex has been previously reported to be especially sensitive for AD at the early prodromal stages of the disease (Du et al., 2001; Pennanen et al., 2004; Tapiola et al., 2008). CSF biomarkers of total tau, p-tau, and Aβ1-42 have also been shown in numerous studies to predict the conversion from MCI to AD at clinically relevant levels of accuracy (Ewers et al., 2007; Herukka et al., 2007; Mattsson et al., 2009).
Results of recent studies of smaller sample size have shown that a combination of both MRI-based assessment of hippocampus volume and CSF based biomarkers may possess additive value for enhanced prediction accuracy (Bouwman et al., 2007; Brys et al., 2009b). A recent study as part of the large-scale multicenter trial of the American Alzheimer's Disease Neuroimaging Initiative (ADNI) using pattern recognition techniques of structural brain changes of gray matter, white matter and CSF space in the whole brain (Vemuri et al., 2008) showed that volumetric changes and CSF markers were associated with higher risk of AD in MCI when compared with each marker alone (Vemuri et al., 2009). In addition to biomarkers, measures of both memory and nonmemory related cognitive ability may contribute to the prediction of AD in subjects with MCI (Jacobs et al., 1995; Devanand et al., 2007). However, the effective gain in predictive accuracy by combining different biomarkers or neuropsychological variables for the prediction of AD in MCI has not been conclusively tested so far. Here, we examined on the basis of the data collected within the large-scale multicenter ADNI the accuracy of the combination of the automated MRI-assessed hippocampus and entorhinal measurement, major CSF-biochemical biomarker candidates, and neuropsychological tests for the prediction of the conversion of subjects with MCI to clinical AD over an observation time period of up to 3.3 years.
2. Methods
2.1. Patients
Subjects with a complete data set of MRI, CSF and neuropsychological tests were drawn from the ADNI data set including 81 patients with AD, 130 amnestic MCI subjects, and 101 elderly HC (Figure 1). Neuropsychological assessment and MRI are routinely taken, and—in a subset of subjects—cerebrospinal fluid samples. Thus, the current sample with a complete data set was a subsample of the larger sample of subjects with amnestic MCI (N = 397), mild AD (N = 193) and HC (N = 229). The subsample who had completed the full data assessment was virtually the same in terms of age, Mini Mental State exam (MMSE), education, ADAS and Ray auditory verbal learning test (AVLT) compared with the remainder of subjects within the ADNI data sample (data not shown). Thus, no selection bias was evident based on the variables tested. All collected data are online freely accessible to researchers (downloaded on 29/9/08 and updated on 8/19/09 at www.loni.ucla.edu/ADNI). General inclusion criteria included an age between 55 and 90 years, a modified Hachinski score ≤ 4, education of at least 6 grade level, and stable treatment of at least 4 weeks in case of treatment with permitted medication (for full list see www.adni-info.org, Procedures Manual). The diagnosis of AD was made according to the NINCDS-ADRDA criteria (McKhann et al., 1984). Inclusion criteria for AD encompassed subjective memory complaint, memory impairment as assessed by an education adjusted score on delayed recall of a single paragraph as tested by the Wechsler Logical Memory II Subscale as follows: 0–7 years of education: ≤ 2, for 8–15 years: ≤ 4, for 16 years or more: ≤ 8, a MMSE score between 20 and 26 and a clinical dementia rating (CDR) score of 0.5 or 1. For the diagnosis of amnestic MCI, the subjects had to show subjective memory impairment and objective memory impairment identical to that for AD, a CDR of 0.5 including the memory box score of 0.5 or greater, and a MMSE score between 24 and 30, with unimpaired general cognitive ability and functional performance such that they did not meet criteria for dementia. HC had to show normal performance on the Logical Memory II Subscale adjusted for education as follows: 0–7 years: ≥ 3, 8–15 years: ≥ 5, 16 or more years: ≥ 9, and absence of significant impairment on cognitive function or activities of daily living.
Fig. 1.
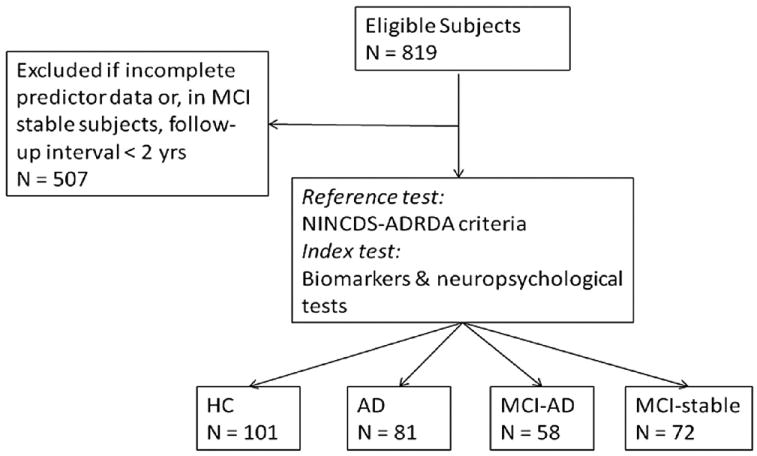
Flow chart of number of patients undergoing the test under evaluation (index test) and the reference test. HCV, Hippocampus volume; ERC, Entorhinal cortical thickness.
2.2. CSF measurement
All CSF samples collected at the different centers were shipped on dry ice to the Penn ADNI Biomarker Core Laboratory at the University of Pennsylvania, Philadelphia for storage at −80 °C until further analysis at the laboratory. More details on data collection of the CSF samples can be found at (www.adni-info.org, under “ADNI study procedures”). The CSF concentration of Aβ1-42, t-tau, and p-tau181 were measured in the baseline CSF samples using Innogenetics reagents (research use only AlzBio3 immunoassay kits, Ghent, Belgium) and the multiplex xMAP Luminex platform (Lumnix Corporation, Austin, TX) at the Penn ADNI Biomarker Core Laboratory. For detailed description see (Shaw et al., 2009).
2.3. MRI acquisition and ROI measurement
The data of left and right hippocampus volume and entorhinal cortex thickness were downloaded from the public ADNI databank (www.loni.ucla.edu/ADNI). All MRI data were acquired on 1.5 T MRI scanners with 3D T1-weighted sequences optimized for the different scanners as indicated at www.loni.ucla.edu/ADNI/Research/Cores/index (Jack et al., 2008). All images were corrected for spatial distortion due to gradient nonlinearity and normalized for B1 nonuniformity (see also www.loni.ucla.edu/ADNI/Data/ADNI_Data.shtml). MRI measures of hippocampus volume and entorhinal cortex were reconstructed with the software program Freesurfer in Dr. Dale's laboratory at University of California, San Diego as previously described in detail (Fennema-Notestine et al., 2009). Automated 3D whole-brain segmentation procedure (Fischl et al., 2002; Fennema-Notestine et al., 2009) was used, which has been shown to be largely robust to variation in image acquisition including scanner type, software version and scan protocol (Fischl et al., 2002). Minimal manual editing of the images was applied (Fennema-Notestine et al., 2009).
2.3.1. Neuropsychological tests
Episodic memory was assessed with the Rey Auditory Verbal Learning test (RAVLT), which includes a list of 15 words to be recalled immediately after each of the 5 verbal presentations, as well as after an interference list and after a 30-minute delay including a free recall and recognition test (Rey, 1964). Tests of frontal lobe functions included digit span forward and backward (score: total correct responses) (Wechsler, 1987), and the trail making test A and B (TMT-A and trail making test b (TMT-B), score: total number of seconds to complete the test) (Reitan and Wolfson, 1985). Verbal fluency was assessed through tests of category fluency including animals and vegetables (score: number of examples recalled) (Morris et al., 1989). The Boston Naming test (score: total number of items correctly named) (Kaplan et al., 1983) and Digit Symbol Substitution test (score: correct number of substitutions) (Wechsler, 1981) were tested in addition. For details on the administration and scoring see the “Procedures Manual” at www.adni-info.org/Scientists/AboutADNI.aspx.
2.4. Statistics
All variables were examined for normal distribution within each diagnostic group using QQ plots. Variables including age, right and left hippocampus volume, and CSF-concentration levels of t-tau, p-tau181, and Aβ1-42, were log-transformed to achieve normal distribution.
Total intracranial volume (TIV) was not used here as we did not anticipate it as a confounding factor for diagnostic classification (Fennema-Notestine et al., 2009), although we appreciate that TIV correction may have reduced further potential nondisease related variation in ROI volume.
In a first step, logistic regression analysis was used to establish a prediction model for the discrimination between AD and HC. In order to test the robustness of the model and to control for potential sample-specific overfitting, the logistic regression analysis was reiterated 1000 times using random-split resampling. In each trial, a logistic regression model was constructed on the basis of a subset of randomly chosen portion of two-thirds of the AD and HC (training set) and the predictive accuracy was tested in the remaining ⅓ of the AD and HC subjects (test set). The sensitivity and specificity of the regression model for the test set was recorded within each resampling trial. The best regression model was defined as the particular regression model that was generated most frequently during the resampling trials. For the best model, the average sensitivity and specificity across resampling test trials and the regression coefficients together with the 95% confidence interval (95% CI) of the sampling distribution was reported. Predictors tested included left and right hippocampus volume and entorhinal cortex, CSF-measures of t-tau, p-tau181, Aβ1-42, ratio of t-tau/Aβ1-42 and p-tau181/Aβ1-42, age, gender and ApoE genotype. ApoE genotype was binarized into ApoE ε4 allele carrier and ApoE ε4 allele non-carriers. Note that in the most accurate model across the 1000 resampling trials, age, gender, and ApoE genotype were not significant predictors and thus did not contribute to the predictive accuracy of the models reported here. The prediction model derived from the first step was applied in the second step for the discrimination between MCI-AD converters and MCI-AD nonconverters.
We reported previously a logistic regression derived formula for the detection of AD based on ApoE genotype and CSF obtained antemortem tested in autopsy confirmed AD patients and living cognitive normal HC (Shaw et al., 2009). We tested here whether this algorithm including CSF-concentration of t-tau, Aβ1-42, and number of ApoE ε4 alleles (designated LRTAA) could be augmented by the current MRI markers for the prediction of MCI to AD. To this end, the 2 prediction models (i.e., with and without neuropsychological markers) were rerun, but this time the separate CSF markers of total tau, p-tau181, and Aβ1-42 and ApoE genotype were substituted by the LRTAA predictor.
In addition to the biomarker-only models, we tested whether neuropsychological variables contributed to the predictive power of the biomarker based model. We repeated the random-split resampling based logistic regression analysis for the discrimination between AD and HC in the same way as described above, but this time feeding in the regression model also neuropsychological test scores including AVLT immediate and 30 minute free recall, AVLT recognition test, TMT-A and TMT-B, category fluency, digit span forward and digit span backward, Digit Symbol Substitution test and the Boston naming test. A correlation matrix was between all tests was computed across all subjects to check colinearity, using Pearson moment correlations.
Note that the model established in AD vs. HC comparison on the basis of the best statistical fit of the logistic regression model may not necessarily translate into the model with the best classification accuracy (Schemper, 2003). Therefore, we compared in a second approach the classification accuracy for each combination of the variables. In a first step, the coefficients were estimated in the AD vs. HC sample (in the whole sample) and then applied for the MCI prediction. Models for all possible combination of the 24 predictors including the biomarker candidates, neuropsychological variables, and demographic variables including age and gender were estimated, with the restriction of a maximal number of predictors of 4. This restriction of the maximum number of predictors in a particular model was done for computational reasons since the total number of possible combinations of 24 variables is exceedingly high. Moreover, models with high number of predictors are less attractive in terms of implementation in clinical practice. To keep the follow-up interval consistent across subjects, the follow-up interval was restricted to at least 1.9 years in MCI stable subjects and the time to conversion was maximally 2.1 years for MCI converters (n = 128 MCI subjects). Using bootstrapping with replacement, the classification accuracy for the MCI conversion prediction was recorded for each model estimated during each of 100 bootstrap trials. In each bootstrap trial, the different models were ranked according to the overall classification accuracy. The mean and 95% CI of the sampling distribution of the rank and classification accuracy indexes (total classification accuracy, sensitivity and specificity) were computed across bootstrapping trials. The 95% CI of the classification accuracies was used to test for statistically significant differences in the classification accuracy between different prediction models.
Note that in the first cross-validation approach to establish the best prediction model in the AD vs. HC comparison, Type I error accumulation due to multiple tests or overfitting was controlled for by random-split resampling. Age and gender were tested as covariates in all models but were not found to contribute to prediction accuracy. The statistical significance threshold for variable entry was α = 0.05 and for removal of a variable from the regression model α = 0.1 was used. In the comparison of systematically varied prediction models on the basis of the 95% CI, the number of comparisons between models was limited to the models with the highest ranks of predictive accuracy, thus limiting the number of statistical tests. Second, as we did not find a significant difference based on the 95% CI, the conclusion of the current study holds regardless of Bonferroni correction.
Finally, within the MCI sample, time to conversion to AD was tested via Cox regression analysis.
The analyses were conducted with open source statistical software package R (www.r-project.org/) and SPSS 16.0 (SPSS, Inc, Chicago, USA).
3. Results
Demographic variables for the different diagnostic groups are displayed in Table 1. Among the subjects with MCI, 58 out of 130 subjects developed AD within 3.3 years of clinical follow up, with a mean follow up interval of 2.3 years (SD = 0.6). In order to check for co-linearity between the predictors, a Pearson-moment correlation matrix was computed among all predictors within the AD and HC subjects. For no pairing of predictors, the correlation was higher than r = 0.9 (data not shown).
Table 1.
Demographic descriptive for each of the diagnostics groups. Mean (standard deviation) are indicated for Age and MMSE
| Group | Sample size | Age | Gender (f/m) | MMSE | ApoE (ε4−/ε4+) |
|---|---|---|---|---|---|
| HC | 101 | 75.2 (5.4) | 48/53 | 29.0 (1.0) | 76/25 |
| MCI-nonAD | 72 | 73.4 (7.4) | 28/44 | 27.4 (1.6) | 39/33 |
| MCI-AD | 58 | 74.6 (7.3) | 19/39 | 26.9 (1.8) | 20/38 |
| AD | 81 | 74.4 (7.8) | 48/33 | 23.5 (1.8) | 24/57 |
f, Female; m, male; ε4-, ApoE genotype without ε4 allele; ε4+, ApoE genotype with at least 1 ε4 allele.
3.1. Differentiation between AD vs. HC
When only biomarker variables were entered, the logistic regression analysis showed that the combination of the CSF ratio of t-tau/Aβ1-42 (B = 3.6, 95% CI (2.6, 4.7)), left entorhinal cortex (B = −2.4, 95% CI (−3.3, −1.5)), and left hippocampus volume (B = −6.8, 95% CI (−9.7, −3.8)) was the model most frequently chosen as the most accurate classification model. Potential confounding factors such as age and gender did not contribute to the best model. The overall classification accuracy of the most frequently yielded best model was 86.7% with a sensitivity of 82.5% and specificity of 90.1% at a cut-off point of the probability of the predicted probability of p = 0.5 based on the regression equation.
When biomarkers and neuropsychological variables were combined, the model most frequently chosen as the best model included again the biomarker of CSF t-tau/Aβ1-42 ratio (B = 5.9, 95% CI (3.4, 8.4)), but this time in combination with the following neuropsychological predictors: RAVLT immediate free recall (B = −11.7, 95% CI (−7.4, −16.1)), RAVLT 30-min. delayed recall (B = −2, 95% CI (−1.1, −2.9)), and TMT-B (B = 4.2, 95% CI (2.7, 5.6). The MRI measures were no longer significant in this extended model. The sensitivity was 93.8% and the specificity 95.6%, with an overall classification accuracy of 94.8%.
In a recent study, based on CSF samples obtained antemortem from AD patients followed to autopsy with postmortem confirmed diagnoses of AD, and CSF from living cognitive normal HC, we reported a logistic regression model based upon CSF-concentration of t-tau, Aβ1-42, and number of ApoE ε4 alleles (designated LRTAA) (Shaw et al., 2009). When this LRTAA based formula was fed into the regression analysis in the current study, results showed that LRTAA (B = 4.4, 95% CI (2.8, 5.9)) was a significant predictor in addition to left entorhinal and hippocampus measures. The overall classification accuracy for the LRTAA plus MRI measures model was 91.1%, with a sensitivity of 90.1% and specificity of 92.1%.
When the analysis was repeated with the LRTAA formula plus neuropsychological tests entered, the LRTAA was a significant predictor of AD (B = 5.3, 95% CI (3.0, 7.5)) in addition to the same neuropsychological predictors, i.e., RAVLT immediate free recall, RAVLT 30-min. delayed recall, and TMT-B. The sensitivity for this model was 92.2% and the specificity was 97.5% with an overall classification accuracy of 95.2%.
3.2. Prediction of conversion from MCI to AD based upon best classification model established in the AD vs. HC comparison
For the best biomarker-only model including the combination of the CSF t-tau/Aβ1-42 ratio and the left entorhinal and hippocampus measures (see above), 80.4% of the 56 MCI-AD converters were correctly identified by the model, and 48.6% of the MCI-AD nonconverters. The overall classification accuracy was 62.5% (Fig. 2A,B). For the combination of the biomarkers plus neuropsychological variables (CSF t-tau/Aβ1-42 ratio, AVLT immediate and delayed free recall, and TMT-B), the total classification accuracy was 64.1%, with a sensitivity of 80.4% and specificity of 51.4%.
Fig. 2.
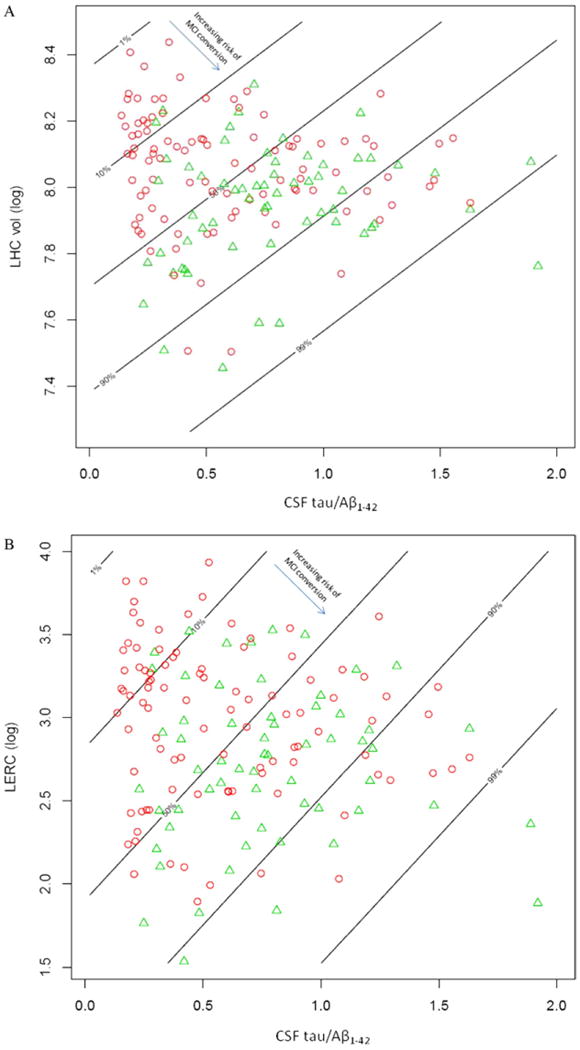
Distribution of MCI-AD converters (green triangles) vs. MCI nonAD (red circles) as a function of left hippocampus volume (ln) and CSF tau/Aβ1-42 ratio (A) and for the entorhinal cortex (mm3) vs. CSF tau/Aβ1-42 ratio (B). The lines show the risk zones for classification as MCI converters or MCI nonconverters. The risk of MCI conversion associated with the left hippocampus volume (A) or left entorhinal cortical thickness (B) is labeled as percentages on each line. The arrow points in the direction of risk increase associated with a decrease in the MRI measures (inset in A and B). Note that an increase in the CSF tau/Aβ1-42 ratio as indicated by the slope of the lines, but a decrease in left hippocampus volume (A) or left entorhinal cortical thickness (B) indicated by the height of the lines is associated with an increased risk of MCI-AD conversion.
When the LRTAA plus MRI based regression model derived above was used for the classification of the MCI conversion, the classification accuracy was 64.8%, with a sensitivity of 76.8% and specificity of 55.6%. For the combination of the LRTAA with neuropsychological predictors, the overall classification accuracy was 68.0%, with a sensitivity of 82.1% and specificity of 57.0%.
3.3. Cox regression analysis of the prediction of time to conversion from MCI to AD
When biomarkers and demographic variables were entered in a feedforward manner, the combination of right hippocampus volume (B = −2.9, SE = 0.7, p < 0.001) and CSF P-tau181 (B = 0.7, SE = 0.3, p = 0.01) significantly predicted time to conversion from MCI to AD.
When neuropsychological test scores in addition to biomarkers and demographic variables were fed into the model, the combination of right hippocampus volume (B = −3.6, SE = 0.8, p < 0.001), ApoE genotype (B = 0.6, SE = 0.3, p = 0.04), AVLT immediate recall (B = −1.5, SE = 0.4, p < 0.001), and Digit span (B = −1.8, SE = 0.4, p < 0.001) predicted time to conversion.
3.4. Statistical test of the difference in the accuracy of predicting MCI conversion between different prediction models
It is possible that a regression model that yields the highest classification accuracy for the discrimination between AD vs. HC may not necessarily select the best model for the prediction of conversion form MCI to AD. Moreover, model selection based on the statistical fit may not always result in statistically significant improvement of actual classification of subjects into clinical diagnostic categories, such as MCI-AD converters and MCI nonconverters. Therefore, we tested in a bootstrapping approach the difference in classification accuracy for the discrimination between MCI-AD converters and MCI-AD nonconverters between all possible combinations of the 24 predictors. The maximum number of variables in a particular model was set to 4.
For the single-predictor model, the biomarker and neuropsychological predictors for which the total prediction accuracy exceeded 50% are listed in Table 2. The top ranked single-predictor was the right entorhinal cortex (mean total CAC = 68.5% (95% CI = 59.6, 77.4)). For neuropsychological predictors, the top ranked predictor was TMT-B (mean total CAC = 64.6% (95% CI = 55.8, 73.5)). The 95% CI of the total classification accuracy overlapped among single predictor models, indicating comparable prediction accuracy between different biomarkers or neuropsychological variables (Fig. 3, Table 2).
Table 2.
The single-predictor models that ranked highest in terms of overall classification accuracy with a minimum classification accuracy > 50% at 2-year follow-up interval are shown. The classification accuracy (CAC), sensitivity and specificity are indicated for the prediction of conversion from MCI to AD as well as the discrimination between AD and HC. Note that bootstrapping of the classification accuracy was performed only in the MCI group
| Variable | Rank | MCI converter vs. MCI nonconverter | AD vs. HC | ||||
|---|---|---|---|---|---|---|---|
| CAC (95% CI) in % | Sensitivity (95% CI) in % | Specificity (95% CI) in % | CAC | Sensitivity | Specificity | ||
| Biomarkers | |||||||
| RERC | 1 | 68.5 (59.5, 77.4) | 53.4 (39.7, 67.1) | 77.0 (66.5, 87.4) | 78.0 | 67.9 | 86.1 |
| RHC | 2 | 67.5 (58.9, 76.2) | 66.8 (53.6, 80.1) | 66.7 (55.9, 77.4) | 76.4 | 65.4 | 85.1 |
| LHC | 4 | 63.5 (54.0, 72.9) | 70.1 (58.0, 82.3) | 58.7 (45.7, 71.6) | 76.4 | 66.7 | 84.2 |
| CSF P-tau181 | 5 | 61.9 (53.8, 70.1) | 63.9 (51.2, 76.6) | 58.9 (45.8, 71.9) | 73.6 | 66.7 | 79.2 |
| CSF T-tau | 6 | 59.9 (51.3, 68.4) | 60.7 (46.1, 75.2) | 58.9 (46.5, 71.3) | 72.0 | 64.2 | 78.2 |
| LERC | 7 | 59.2 (50.1, 68.4) | 54.8 (43.0, 66.7) | 63.5 (50.8, 76.3) | 79.7 | 74.1 | 84.2 |
| Neuropsychological tests | |||||||
| TMT-B | 1 | 64.6 (55.8, 73.4) | 49.6 (35.8, 63.4) | 76.2 (66.9, 85.5) | 46.2 | 32.1 | 57.4 |
| AVLT–IM REC | 2 | 61.8 (53.9, 69.8) | 74.3 (61.7, 86.9) | 53.0 (40.7, 65.4) | 90.7 | 90.1 | 91.1 |
| AVLT-DEL REC | 3 | 61.7 (53.4, 69.9) | 78.1 (67.5, 88.7) | 49.4 (38.3, 60.6) | 88.5 | 86.4 | 90.1 |
| Cat fluency (veg) | 4 | 60.2 (52.7, 67.8) | 55.8 (44.6, 66.9) | 65.6 (53.0, 78.3) | 81.9 | 79.0 | 84.2 |
| Digit score | 5 | 59.9 (51.7, 68.2) | 50.9 (37.3, 64.5) | 66.0 (55.2, 76.7) | 48.9 | 39.5 | 56.4 |
| AVLT-DEL RECOG | 6 | 58.9 (50.6, 67.1) | 50.0 (37.2, 62.8) | 65.2 (54.1, 76.4) | 79.7 | 65.4 | 91.1 |
AVLT-DEL REC, AVLT delayed free recall; AVLT-IM REC, AVLT immediate free recall; AVLT-DEL RECOG, AVLT recognition memory; Cat Fluency (VEG), Category fluency for category of vegetables; digit span B, digit span backwards(length); digit score, digit span total score; LERC, left enthorinal cortex thickness; LHC, left hippocampus volume; RERC, right entorhinal cortex thickness; LHC, left hippocampus volume; TMT-B, trail making test B.
Fig. 3.
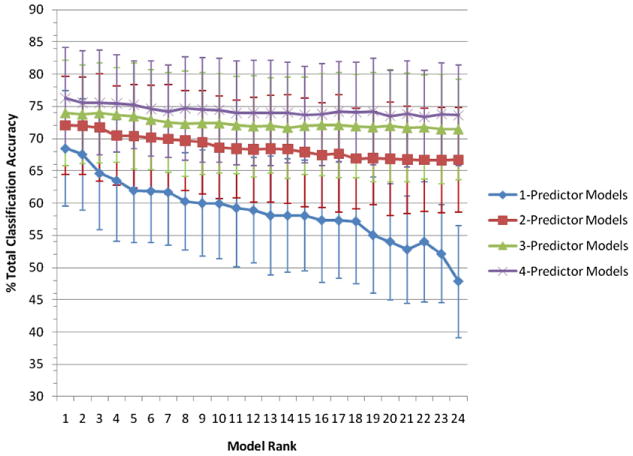
Bootstrapped mean of the total overall classification accuracy and 95% CI for the 24 rank ordered models of highest CAC each of 1-, 2-, 3-, and 4-predictor models for the classification of MCI conversion within a 2-year interval. For identification of models see supplementary Table 1, where the models are identified by their corresponding rank.
We asked the question whether any combination of biomarkers or neuropsychological variables shows a significant gain over the single-predictor model in terms of classification accuracy. Bootstrapped classification accuracy was compared among all possible combinations of predictors, with the restriction of no more than 4 predictors being included in a particular model. Figure 3 shows classification accuracy of the best 24 models for 2-, 3-, and 4 predictor models vs. each single predictor model (for model identification see supplementary Table 1). Tables 3 and 4 display the total classification accuracy, sensitivity and specificity along with the 95% CI of the best 1-, 2-, 3-, or 4-predictor models for the biomarker-only models (Table 3) and the biomarker-plus-neuropsychology models (Table 4). For the biomarker-only models, there was a numerical but statistically nonsignificant increase in total classification accuracy from the best single marker model of the entorhinal cortex thickness (68.5%, 95% CI (59.5, 77.4)) to best for the 4-predictor model including right hippocampus volume, CSF total-tau/Aβ1-42 ratio, ApoE genotype, and age (overall classification accuracy = 70.9% (95% CI (63.1, 78.6), Table 3)).
Table 3.
Combined biomarkers models for different follow up intervals. The overall classification accuracy, sensitivity and specificity for the top ranked models during the bootstrapping trials for single and multiple predictor models are displayed for 2- and 3-year follow-up intervals. Bootstrapping was performed only in the full 2-year sample.
| Follow-up interval (in years) | Sample size MCI-AD/MCI nonAD | Model | Overall classification accuracy in % (95% CI) | Sensitivity in % (95% CI) | Specificity in % (95% CI) |
|---|---|---|---|---|---|
| 2-y follow up | 58/72 | RERC | 68.5 (59.5, 77.4) | 53.4 (39.7, 67.1) | 77.0 (66.5, 87.5) |
| LERC and RHC | 68.4 (60, 76.8) | 70.8 (58.8, 82.9) | 66.6 (54.5, 78.8) | ||
| RHC and CSF P-tau181 and ApoE | 72.0 (64.0, 80.0) | 79.9 (69.4, 90.3) | 62.2 (50.5, 73.8) | ||
| RHC and tau/Aβ1-42 and ApoE and age | 70.9 (63.1, 78.6) | 79.6 (69.7, 89.5) | 64.1 (53.3, 74.9) | ||
| ≥ 3-y follow up | 11/15 | RERC | 65.4 | 54.5 | 73.3 |
| LERC and RHC | 69.2 | 63.6 | 73.3 | ||
| RHC and CSF P-tau181 and ApoE | 69.2 | 63.6 | 73.3 | ||
| RHC and tau/Aβ1-42 and ApoE and age | 69.2 | 63.6 | 73.3 |
ApoE, ApoE genotype; LERC, left entorhinal cortex thickness; LHC, left hippocampus volume; RERC, right entorhinal cortex thickness (ApoE ε4 allele carriers vs. non-carriers).
Table 4.
Combined biomarkers and neuropsychological models for different follow up intervals. The overall classification accuracy, sensitivity and specificity for the top ranked models during the bootstrapping trials for single and multiple predictor models are displayed for 2- and 3-year follow-up intervals. Bootstrapping was performed only in the full 2-year sample
| Follow-up interval (in years) | Sample size MCI-AD/MCI non AD | Model | Overall classification accuracy in % (95% CI) | Sensitivity in % (95% CI) | Specificity in % (95% CI) |
|---|---|---|---|---|---|
| 2-y follow up | 58/72 | TMT-B | 64.6 (55.8, 73.5) | 49.6 (35.8, 63.4) | 76.2 (66.8, 85.5) |
| LHC and digit span | 72.2 (64.5, 79.6) | 77.7 (67.7, 87.7) | 68.2 (57.3, 79.2) | ||
| LHC and LRTAA and digit span | 74.0 (65.8, 79.6) | 83.1 (74.2, 92.1) | 66.8 (56.6, 76.9) | ||
| TMT-B, RHC and CSF P-tau181/Aβ1-42 and age | 76.3 (68.4, 84.2) | 87.5 (78.9, 96.0) | 68.3 (56.9, 79.6) | ||
| ≥ 3-y follow up | 11/15 | TMT-B | 61.5 | 36.4 | 80 |
| LHC and digit span | 76.9 | 81.8 | 73.3 | ||
| LHC and LRTAA and digit span | 76.9 | 90.9 | 66.7 | ||
| TMT-B, RHC and P-tau181/Aβ1-42 and age | 76.9 | 81.8 | 73.3 |
For the models combining biomarker and neuropsychological test performance, a numerical increase of the overall classification accuracy by 11.7% in total classification accuracy was observed in favor of the best 4-predictor model (TMT-B, right hippocampus volume, CSF p-tau181/Aβ1-42 and age, classification accuracy = 76.3% (95% CI (68.4, 84.2)) when compared with the best single neuropsychological predictor (TMT-B, classification accuracy = 64.6%, 95% CI (55.8, 73.5), see above and Table 4). However, the mean difference between the best predictor model and best 4-predictor model was not statistically significant, as the 95% CI of the classification accuracy of both models was overlapping (see Table 4).
4. Discussion
The major results show that a combination of MRI and CSF or neuropsychological markers contributed independently to the discrimination between AD and HC subjects. However, the comparison of the classification accuracy between different models with increasing numbers of predictors showed that the combination of multiple biomarkers and neuropsychological tests did not significantly augment the overall classification accuracy when compared with the best single-predictor models.
We used a widely applied method of cross-validation, determining the best logistic regression model in the training sample consisting of AD and HC subjects. Based on such a best-statistical-fit approach, CSF total tau/Aβ1-42 ratio, left entorhinal cortex and hippocampus volume were found to independently contribute to the classification of AD vs. HC subjects. When neuropsychological predictors were introduced, a combination of CSF total tau/Aβ1-42 ratio with performance on tests of immediate and delayed recall was found to yield the best model. This finding of independent contribution of different biomarkers to the prediction of risk of AD is consistent with previous results.
For the prediction of time to conversion from MCI to AD, Cox regression analysis showed significant contribution of a combination of multiple variables to predict time to conversion from MCI to AD. Previous studies reported that a combination of hippocampus rating (Bouwman et al., 2007) or manual hippocampus volumetry (de Leon et al., 2006) contributed independently from CSF based core biomarkers (de Leon et al., 2006; Bouwman et al., 2007; Brys et al., 2009a) to the the prediction of AD in MCI subjects. Similarly, a combination of WAIS-R Digit Span, Selective Reminding Test (SRT) Immediate Recall and functional assessment measures and biomarkers including MRI based measures of entorhinal cortex and hippocampus were found to best predict the time to conversion from MCI to AD within 3 years of clinical follow up (Devanand et al., 2007). In larger multicenter studies including the ADNI trial, previous studies with a mean follow up interval of 1.5 years reported that MRI and CSF biomarkers may contribute independently to the prediction of AD (Vemuri et al., 2009). However, the clinical utility in terms of prediction accuracy was not evaluated for this relatively short follow-up interval used in that earlier study (Vemuri et al., 2009). In a similar vein, Landau et al. recently reported that the combination of a decrease in FDG-PET uptake and impaired free recall shows a significantly elevated hazard ratio to develop AD dementia within 2 years (Landau et al., 2010). These studies support the notion that biomarker and neuropsychological predictors are independently associated with the risk of AD. However, such results based on explained variance leave considerable uncertainty to what extent the actual predictive accuracy is enhanced by the addition of a particular marker in multipredictor models (Schemper, 2003).
In the current study, the systematic combination of each of the 24 predictor variables in models with a number of maximally 4 predictors allowed for the direct comparison of single predictor models and more complex models based upon the 95% CI of the predictive accuracy. Our results showed that although there was a numerical increase by up to 11.7% in total prediction accuracy from the best single-predictor model to the best four-predictor model, this difference was not robust based on the bootstrapped 95% CI of the prediction accuracy. Although it is possible that a test of the same model in a larger sample or a combination of even more predictors may eventually lead to a significant improvement, the current results support the notion that some sparser and economic single-predictor models may be as good as any more complex model for the prediction of the clinical course to the progression from MCI to AD within a short time interval.
A second finding of the current analysis is that a broad range of both biomarker and neuropsychological predictors yield comparable results. Previous studies have provided evidence for the utility of CSF and MRI markers of hippocampus and entorhinal cortex for the prediction of AD (Schmand et al., 2010). We found that some neuropsychological predictors achieved a predictive accuracy that was comparable to that of biomarkers. Note that the best neuropsychological predictors included both memory measures (free recall) and nonmemory measures (TMT-B, digit span, and fluency). Free and cued recall of verbal list learning has been previously shown to be highly sensitive towards mild AD (Tierney et al., 1996; Tabert et al., 2006; Sarazin et al., 2007; Devanand et al., 2008; Fleisher et al., 2008), even 10 years before the clinical manifestation of AD (Tierney et al., 2005). Both immediate free recall and digit span were reported to be associated with the risk of development of AD in MCI in a previous study (Devanand et al., 2007). Our current finding suggests that executive functions such as tapped by TMT-B (Arbuthnott and Frank, 2000) showed significant predictive value for the development of AD in amnestic MCI. In summary, both free recall measures are strong predictors of Alzheimer's disease in MCI (Sarazin et al., 2007), and fronal nonmemory neuropsychological measures (Jacobs et al., 1995; Tierney et al., 1996; Backman et al., 2005; Tierney et al., 2005; Tabert et al., 2006; Rozzini et al., 2007) show predictive value for the conversion from MCI to AD. It should be noted that the use of psychometric memory tests is somewhat controversial, since such tests were also used for the diagnosis of AD, thus posing the risk of circularity. On the other hand, one may argue that the inclusion of neuropsychologically impaired subjects such as in the case of amnestic MCI may render the test of neuropsychological prediction of progression harder since the variability in neuropsychological performance is reduced in such a clinical group. Eventually, the utility of any predictor will need to be validated in neuropathologically confirmed AD cases.
The current results also demonstrate that the predictive accuracy of the current biomarker models is not yet clinically sufficient within a follow-up interval of up to 3.3 years in the ADNI study. The limited predictive accuracy may be partially explainable by censoring effects. Although our results do not show an improvement of predictive accuracy between a 2-year and 3-year follow-up interval, the predictive accuracy of the current model is likely to improve with extended follow-up time and may reach a plateau only many years later. This hypothesis is consistent with findings of a meta-analysis showing a trend towards increasingly higher effect sizes of CSF biomarkers including t-tau, p-tau and Aβ1-42 during at least 6 years of clinical follow-up (Schmand et al., 2010).
The current biomarker based model did take advantage of a clinical characterization, as a preselection of subjects in terms of presence of amnestic MCI was used. Thus, the results need to be interpreted in view of the clinical concept of MCI that may be supplemented by biomarker and neuropsychology based prediction of AD. An evaluation of biomarker and neuropsychological predictor supported models in subjects with nonamnestic subtype of MCI, which was not included in the current study, is desirable in the future. Previous studies have shown that the frequency of AD-like CSF-patterns composed of the concentration of tau and Aβ1-42 is significantly elevated not only in amnestic MCI subjects, but also in the nonamnestic subtype of MCI or subjective memory impairment when compared with normal controls (Visser et al., 2009). Presence of the AD like CSF pattern was associated with stronger cognitive decline in these groups (Visser et al., 2009). Thus, it will need to be tested whether the current result pattern holds also in the nonamnestic type of MCI.
Supplementary Material
Acknowledgments
We thank Philip Insel for statistical advice. We also thank the reviewers for their helpful comments. The study was supported by grants from the Science Foundation Ireland (SFI) investigator program award 08/IN.1/B1846 (to H.H.); National Institute on Aging (AG19610, AG024904, AG025526), the NIH Foundation, the Evelyn F. McKnight Brain Institute of the University of Arizona, the state of Arizona and Arizona Department of Health Services (to G.A.); National Institute on Aging AG11378 and the Alexander Family Alzheimer's Research Professorship, Mayo Clinic (to CRJ); Pfizer, Eisai, Janssen, Novartis, Lilly, AstraZeneca, Sanofi, NIH, CIHR, Alzheimer Society of Canada, Michael Smith Health Research Foundation (to H.H.F.); and NIA, UO1 AG-024904 (to Alzheimer's Disease Neuroimaging Initiative (ADNI)).
Footnotes
Disclosure statement: H.H.F. has been a consultant for the pharmaceutical companies Pfizer, Eisai, Novartis, Lilly, Janssen, Servier, Myriad, Targacept, Lundbeck, AstraZeneca, Sanofi, Wyeth, Forest, Elan, Bristol-Myers Squibb, BC Pharmacare prior to 2009. H.H.F. has participated in CME programs of Pfizer, Eisai, Janssen, Novartis, Forest, AstraZeneca prior to 2009. H.H.F. is currently on leave from University of British Columbia (1 January 2009) and an employee At Bristol-Myers Squibb, and holds stocks of Bristol-Myers Squibb.
None of the other authors have a conflict of interest to disclose.
Appendix. Supplementary data: Supplementary data associated with this article can be found, in the online version, at doi:10.1016/j.neurobiolaging.2010.10.019.
References
- Arbuthnott K, Frank J. Trail making test, part B as a measure of executive control: validation using a set-switching paradigm. J Clin Exp Neuropsychol. 2000;22(4):518–528. doi: 10.1076/1380-3395(200008)22:4;1-0;FT518. [DOI] [PubMed] [Google Scholar]
- Backman L, Jones S, Berger AK, Laukka EJ, Small BJ. Cognitive impairment in preclinical Alzheimer's disease: a meta-analysis. Neuropsychology. 2005;19:520–531. doi: 10.1037/0894-4105.19.4.520. [DOI] [PubMed] [Google Scholar]
- Blennow K, Hampel H. CSF markers for incipient Alzheimer's disease. Lancet Neurol. 2003;2:605–613. doi: 10.1016/s1474-4422(03)00530-1. [DOI] [PubMed] [Google Scholar]
- Bouwman FH, Schoonenboom SN, van der Flier WM, van Elk EJ, Kok A, Barkhof F, Blankenstein MA, Scheltens P. CSF biomarkers and medial temporal lobe atrophy predict dementia in mild cognitive impairment. Neurobiol Aging. 2007;28:1070–4. doi: 10.1016/j.neurobiolaging.2006.05.006. [DOI] [PubMed] [Google Scholar]
- Brys M, Glodzik L, Mosconi L, Switalski R, De Santi S, Pirraglia E, Rich K, Kim BC, Mehta P, Zinkowski R, Pratico D, Wallin A, Zetterberg H, Tsui WH, Rusinek H, Blennow K, de Leon MJ. Magnetic resonance imaging improves cerebrospinal fluid biomarkers in the early detection of Alzheimer's disease. J Alzheimers Dis. 2009a;16:351–362. doi: 10.3233/JAD-2009-0968. [DOI] [PMC free article] [PubMed] [Google Scholar]
- Brys M, Pirraglia E, Rich K, Rolstad S, Mosconi L, Switalski R, Glodzik-Sobanska L, De Santi S, Zinkowski R, Mehta P, Pratico D, Saint Louis LA, Wallin A, Blennow K, de Leon MJ. Prediction and longitudinal study of CSF biomarkers in mild cognitive impairment. Neurobiol Aging. 2009b;30:682–690. doi: 10.1016/j.neurobiolaging.2007.08.010. [DOI] [PMC free article] [PubMed] [Google Scholar]
- Csernansky JG, Wang L, Joshi S, Miller JP, Gado M, Kido D, McKeel D, Morris JC, Miller MI. Early DAT is distinguished from aging by high-dimensional mapping of the hippocampus. Dementia of the Alzheimer type Neurology. 2000;55:1636–1643. doi: 10.1212/wnl.55.11.1636. [DOI] [PubMed] [Google Scholar]
- de Leon MJ, DeSanti S, Zinkowski R, Mehta PD, Pratico D, Segal S, Rusinek H, Li J, Tsui W, Saint Louis LA, Clark CM, Tarshish C, Li Y, Lair L, Javier E, Rich K, Lesbre P, Mosconi L, Reisberg B, Sadowski M, DeBernadis JF, Kerkman DJ, Hampel H, Wahlund LO, Davies P. Longitudinal CSF and MRI biomarkers improve the diagnosis of mild cognitive impairment. Neurobiol Aging. 2006;27:394–401. doi: 10.1016/j.neurobiolaging.2005.07.003. [DOI] [PubMed] [Google Scholar]
- Devanand DP, Liu X, Tabert MH, Pradhaban G, Cuasay K, Bell K, de Leon MJ, Doty RL, Stern Y, Pelton GH. Combining early markers strongly predicts conversion from mild cognitive impairment to Alzheimer's disease. Biol Psychiatry. 2008;64:871–879. doi: 10.1016/j.biopsych.2008.06.020. [DOI] [PMC free article] [PubMed] [Google Scholar]
- Devanand DP, Pradhaban G, Liu X, Khandji A, De Santi S, Segal S, Rusinek H, Pelton GH, Honig LS, Mayeux R, Stern Y, Tabert MH, de Leon MJ. Hippocampal and entorhinal atrophy in mild cognitive impairment: Prediction of Alzheimer disease. Neurology. 2007;68:828–836. doi: 10.1212/01.wnl.0000256697.20968.d7. [DOI] [PubMed] [Google Scholar]
- Du AT, Schuff N, Amend D, Laakso MP, Hsu YY, Jagust WJ, Yaffe K, Kramer JH, Reed B, Norman D, Chui HC, Weiner MW. Magnetic resonance imaging of the entorhinal cortex and hippocampus in mild cognitive impairment and Alzheimer's disease. J Neurol Neurosurg Psychiatry. 2001;71:441–447. doi: 10.1136/jnnp.71.4.441. [DOI] [PMC free article] [PubMed] [Google Scholar]
- Dubois B, Feldman HH, Jacova C, Dekosky ST, Barberger-Gateau P, Cummings J, Delacourte A, Galasko D, Gauthier S, Jicha G, Meguro K, O'Brien J, Pasquier F, Robert P, Rossor M, Salloway S, Stern Y, Visser PJ, Scheltens P. Research criteria for the diagnosis of Alzheimer's disease: revising the NINCDS-ADRDA criteria. Lancet Neurol. 2007;6:734–746. doi: 10.1016/S1474-4422(07)70178-3. [DOI] [PubMed] [Google Scholar]
- Ewers M, Buerger K, Teipel SJ, Scheltens P, Schroder J, Zinkowski RP, Bouwman FH, Schonknecht P, Schoonenboom NS, Andreasen N, Wallin A, DeBernardis JF, Kerkman DJ, Heindl B, Blennow K, Hampel H. Multicenter assessment of CSF-phosphorylated tau for the prediction of conversion of MCI. Neurology. 2007;69:2205–2212. doi: 10.1212/01.wnl.0000286944.22262.ff. [DOI] [PubMed] [Google Scholar]
- Fennema-Notestine C, Hagler DJ, Jr, McEvoy LK, Fleisher AS, Wu EH, Karow DS, Dale AM. Structural MRI biomarkers for preclinical and mild Alzheimer's disease. Hum Brain Mapp. 2009;30:3238–53. doi: 10.1002/hbm.20744. [DOI] [PMC free article] [PubMed] [Google Scholar]
- Fischl B, Salat DH, Busa E, Albert M, Dieterich M, Haselgrove C, van der Kouwe A, Killiany R, Kennedy D, Klaveness S, Montillo A, Makris N, Rosen B, Dale AM. Whole brain segmentation: automated labeling of neuroanatomical structures in the human brain. Neuron. 2002;33:341–355. doi: 10.1016/s0896-6273(02)00569-x. [DOI] [PubMed] [Google Scholar]
- Fleisher AS, Sun S, Taylor C, Ward CP, Gamst AC, Petersen RC, Jack CR, Jr, Aisen PS, Thal LJ. Volumetric MRI vs clinical predictors of Alzheimer disease in mild cognitive impairment. Neurology. 2008;70:191–199. doi: 10.1212/01.wnl.0000287091.57376.65. [DOI] [PubMed] [Google Scholar]
- Frank RA, Galasko D, Hampel H, Hardy J, de Leon MJ, Mehta PD, Rogers J, Siemers E, Trojanowski JQ. Biological markers for therapeutic trials in Alzheimer's disease. Proceedings of the biological Markers Working Group; NIA Initiative on Neuroimaging in Alzheimer'S Disease. Neurobiol Aging. 2003;24:521–536. doi: 10.1016/s0197-4580(03)00002-2. [DOI] [PubMed] [Google Scholar]
- Frisoni GB, Ganzola R, Canu E, Rub U, Pizzini FB, Alessandrini F, Zoccatelli G, Beltramello A, Caltagirone C, Thompson PM. Mapping local hippocampal changes in Alzheimer's disease and normal ageing with MRI at 3 Tesla. Brain. 2008;131:3266–3276. doi: 10.1093/brain/awn280. [DOI] [PubMed] [Google Scholar]
- Hansson O, Zetterberg H, Buchhave P, Londos E, Blennow K, Minthon L. Association between CSF biomarkers and incipient Alzheimer's disease in patients with mild cognitive impairment: a follow-up study. Lancet Neurol. 2006;5:228–234. doi: 10.1016/S1474-4422(06)70355-6. [DOI] [PubMed] [Google Scholar]
- Herukka SK, Hallikainen M, Soininen H, Pirttila T. CSF A{beta}42 and tau or phosphorylated tau and prediction of progressive mild cognitive impairment. Neurology. 2005;64:1294–1297. doi: 10.1212/01.WNL.0000156914.16988.56. [DOI] [PubMed] [Google Scholar]
- Herukka SK, Helisalmi S, Hallikainen M, Tervo S, Soininen H, Pirttila T. CSF Abeta42, Tau and phosphorylated Tau, APOE epsilon4 allele and MCI type in progressive MCI. Neurobiol Aging. 2007;28:507–514. doi: 10.1016/j.neurobiolaging.2006.02.001. [DOI] [PubMed] [Google Scholar]
- Jack CR, Jr, Bernstein MA, Fox NC, Thompson P, Alexander G, Harvey D, Borowski B, Britson PJ, J LW, Ward C, Dale AM, Felmlee JP, Gunter JL, Hill DL, Killiany R, Schuff N, Fox-Bosetti S, Lin C, Studholme C, DeCarli CS, Krueger G, Ward HA, Metzger GJ, Scott KT, Mallozzi R, Blezek D, Levy J, Debbins JP, Fleisher AS, Albert M, Green R, Bartzokis G, Glover G, Mugler J, Weiner MW. The Alzheimer'S Disease Neuroimaging Initiative (ADNI): MRI methods. J Magn Reson Imaging. 2008;27:685–691. doi: 10.1002/jmri.21049. [DOI] [PMC free article] [PubMed] [Google Scholar]
- Jack CR, Jr, Petersen RC, Xu YC, O'Brien PC, Smith GE, Ivnik RJ, Boeve BF, Waring SC, Tangalos EG, Kokmen E. Prediction of AD with MRI-based hippocampal volume in mild cognitive impairment. Neurology. 1999;52:1397–1403. doi: 10.1212/wnl.52.7.1397. [DOI] [PMC free article] [PubMed] [Google Scholar]
- Jacobs DM, Sano M, Dooneief G, Marder K, Bell KL, Stern Y. Neuropsychological detection and characterization of preclinical Alzheimer's disease. Neurology. 1995;45:957–962. doi: 10.1212/wnl.45.5.957. [DOI] [PubMed] [Google Scholar]
- Kantarci K, Jack CR., Jr Neuroimaging in Alzheimer disease: an evidence-based review. Neuroimaging Clin N Am. 2003;13:197–209. doi: 10.1016/s1052-5149(03)00025-x. [DOI] [PubMed] [Google Scholar]
- Kaplan E, Goodglass H, Weintraub S. The Boston Naming Test. Lea and Febiger; Philadelphia: 1983. [Google Scholar]
- Landau SM, Harvey D, Madison CM, Reiman EM, Foster NL, Aisen PS, Petersen RC, Shaw LM, Trojanowski JQ, Jack CR, Jr, Weiner MW, Jagust WJ. Comparing predictors of conversion and decline in mild cognitive impairment. Neurology. 2010;75:230–238. doi: 10.1212/WNL.0b013e3181e8e8b8. [DOI] [PMC free article] [PubMed] [Google Scholar]
- Mattsson N, Zetterberg H, Hansson O, Andreasen N, Parnetti L, Jonsson M, Herukka SK, van der Flier WM, Blankenstein MA, Ewers M, Rich K, Kaiser E, Verbeek M, Tsolaki M, Mulugeta E, Rosen E, Aarsland D, Visser PJ, Schroder J, Marcusson J, de Leon M, Hampel H, Scheltens P, Pirttila T, Wallin A, Jonhagen ME, Minthon L, Winblad B, Blennow K. CSF biomarkers and incipient Alzheimer disease in patients with mild cognitive impairment. JAMA. 2009;302:385–393. doi: 10.1001/jama.2009.1064. [DOI] [PubMed] [Google Scholar]
- McKhann G, Drachman D, Folstein M, Katzman R, Price D, Stadlan EM. Clinical diagnosis of Alzheimer's disease: report of the NINCDS-ADRDA Work Group under the auspices of Department of Health and Human Services Task Force on Alzheimer's Disease. Neurology. 1984;34:939–944. doi: 10.1212/wnl.34.7.939. [DOI] [PubMed] [Google Scholar]
- Morris JC, Heyman A, Mohs RC, Hughes JP, van Belle G, Fillenbaum G, Mellits ED, Clark C. The Consortium to Establish a Registry for Alzheimer's Disease (CERAD). Part I Clinical and neuropsychological assessment of Alzheimer's disease. Neurology. 1989;39:1159–1165. doi: 10.1212/wnl.39.9.1159. [DOI] [PubMed] [Google Scholar]
- Pennanen C, Kivipelto M, Tuomainen S, Hartikainen P, Hanninen T, Laakso MP, Hallikainen M, Vanhanen M, Nissinen A, Helkala EL, Vainio P, Vanninen R, Partanen K, Soininen H. Hippocampus and entorhinal cortex in mild cognitive impairment and early AD. Neurobiol Aging. 2004;25:303–310. doi: 10.1016/S0197-4580(03)00084-8. [DOI] [PubMed] [Google Scholar]
- Petersen RC, Smith GE, Waring SC, Ivnik RJ, Tangalos EG, Kokmen E. Mild cognitive impairment: clinical characterization and outcome. Arch Neurol. 1999;56:303–308. doi: 10.1001/archneur.56.3.303. [DOI] [PubMed] [Google Scholar]
- Reitan R, Wolfson D. The Halstead-Reitan Neuropsychological Test Battery. Neuropsychological Publishing Group; Tucson: 1985. [Google Scholar]
- Rey A. L'examen clinique en psychologie. Press Universitaires de France; Paris: 1964. [Google Scholar]
- Ritchie K, Artero S, Touchon J. Classification criteria for mild cognitive impairment: a population-based validation study. Neurology. 2001;56:37–42. doi: 10.1212/wnl.56.1.37. [DOI] [PubMed] [Google Scholar]
- Rozzini L, Chilovi BV, Conti M, Bertoletti E, delRio I, Trabucchi M, Padovani A. Conversion of amnestic Mild Cognitive Impairment to dementia of Alzheimer type is independent to memory deterioration. Int J Geriatr Psychiatry. 2007;22:1217–1222. doi: 10.1002/gps.1816. [DOI] [PubMed] [Google Scholar]
- Sarazin M, Berr C, De Rotrou J, Fabrigoule C, Pasquier F, Legrain S, Michel B, Puel M, Volteau M, Touchon J, Verny M, Dubois B. Amnestic syndrome of the medial temporal type identifies prodromal AD: a longitudinal study. Neurology. 2007;69:1859–1867. doi: 10.1212/01.wnl.0000279336.36610.f7. [DOI] [PubMed] [Google Scholar]
- Schemper M. Predictive accuracy and explained variation. Stat Med. 2003;22:2299–2308. doi: 10.1002/sim.1486. [DOI] [PubMed] [Google Scholar]
- Schmand B, Huizenga HM, van Gool WA. Meta-analysis of CSF and MRI biomarkers for detecting preclinical Alzheimer's disease. Psychol Med. 2010;40:135–145. doi: 10.1017/S0033291709991516. [DOI] [PubMed] [Google Scholar]
- Schuff N, Woerner N, Boreta L, Kornfield T, Shaw LM, Trojanowski JQ, Thompson PM, Jack CR, Jr, Weiner MW. the A.s., Disease Neuroimaging I. MRI of hippocampal volume loss in early Alzheimer's disease in relation to ApoE genotype and biomarkers. Brain. 2009;132(4):1067–77. doi: 10.1093/brain/awp007. [DOI] [PMC free article] [PubMed] [Google Scholar]
- Shaw LM, Vanderstichele H, Knapik-Czajka M, Clark CM, Aisen PS, Petersen RC, Blennow K, Soares H, Simon A, Lewczuk P, Dean R, Siemers E, Potter W, Lee VM, Trojanowski JQ. Cerebrospinal fluid biomarker signature in Alzheimer's Disease Neuroimaging Initiative subjects. Ann Neurol. 2009;65:403–13. doi: 10.1002/ana.21610. [DOI] [PMC free article] [PubMed] [Google Scholar]
- Tabert MH, Manly JJ, Liu X, Pelton GH, Rosenblum S, Jacobs M, Zamora D, Goodkind M, Bell K, Stern Y, Devanand DP. Neuropsychological Prediction of Conversion to Alzheimer Disease in Patients With Mild Cognitive Impairment. Arch Gen Psychiatry. 2006;63:916–924. doi: 10.1001/archpsyc.63.8.916. [DOI] [PubMed] [Google Scholar]
- Tapiola T, Pennanen C, Tapiola M, Tervo S, Kivipelto M, Hanninen T, Pihlajamaki M, Laakso MP, Hallikainen M, Hamalainen A, Vanhanen M, Helkala EL, Vanninen R, Nissinen A, Rossi R, Frisoni GB, Soininen H. MRI of hippocampus and entorhinal cortex in mild cognitive impairment: a follow-up study. Neurobiol Aging. 2008;29:31–38. doi: 10.1016/j.neurobiolaging.2006.09.007. [DOI] [PubMed] [Google Scholar]
- Tierney MC, Szalai JP, Snow WG, Fisher RH, Nores A, Nadon G, Dunn E, St George-Hyslop PH. Prediction of probable Alzheimer's disease in memory-impaired patients: A prospective longitudinal study. Neurology. 1996;46:661–665. doi: 10.1212/wnl.46.3.661. [DOI] [PubMed] [Google Scholar]
- Tierney MC, Yao C, Kiss A, McDowell I. Neuropsychological tests accurately predict incident Alzheimer disease after 5 and 10 years. Neurology. 2005;64:1853–1859. doi: 10.1212/01.WNL.0000163773.21794.0B. [DOI] [PubMed] [Google Scholar]
- Vemuri P, Gunter JL, Senjem ML, Whitwell JL, Kantarci K, Knopman DS, Boeve BF, Petersen RC, Jack CR., Jr Alzheimer's disease diagnosis in individual subjects using structural MR images: validation studies. Neuroimage. 2008;39:1186–1197. doi: 10.1016/j.neuroimage.2007.09.073. [DOI] [PMC free article] [PubMed] [Google Scholar]
- Vemuri P, Wiste HJ, Weigand SD, Shaw LM, Trojanowski JQ, Weiner MW, Knopman DS, Petersen RC, Jack CR., Jr MRI and CSF biomarkers in normal, MCI, and AD subjects: predicting future clinical change. Neurology. 2009;73:294–301. doi: 10.1212/WNL.0b013e3181af79fb. [DOI] [PMC free article] [PubMed] [Google Scholar]
- Visser PJ, Verhey F, Knol DL, Scheltens P, Wahlund LO, Freund-Levi Y, Tsolaki M, Minthon L, Wallin AK, Hampel H, Burger K, Pirttila T, Soininen H, Rikkert MO, Verbeek MM, Spiru L, Blennow K. Prevalence and prognostic value of CSF markers of Alzheimer's disease pathology in patients with subjective cognitive impairment or mild cognitive impairment in the DESCRIPA study: a prospective cohort study. Lancet Neurol. 2009;8:619–627. doi: 10.1016/S1474-4422(09)70139-5. [DOI] [PubMed] [Google Scholar]
- Wang L, Khan A, Csernansky JG, Fischl B, Miller MI, Morris JC, Beg MF. Fully-automated, multi-stage hippocampus mapping in very mild Alzheimer disease. Hippocampus. 2009;19:541–548. doi: 10.1002/hipo.20616. [DOI] [PMC free article] [PubMed] [Google Scholar]
- Wechsler D. Wechsler Adult Intelligence Scale-Revised. Psychological Corporation; 1981. [Google Scholar]
- Wechsler D. Wechsler Memory Scale-Revised. Psychological Corporation; San Antonio: 1987. [Google Scholar]
- Wimo A, Ljunggren G, Winblad B. Costs of dementia and dementia care: a review. Int J Geriatr Psychiatry. 1997;12:841–856. [PubMed] [Google Scholar]
Associated Data
This section collects any data citations, data availability statements, or supplementary materials included in this article.