Abstract
A novel functional Imaging Mass Spectrometry technology is described that utilizes activity-based probes for imaging enzyme active sites in tissue sections. We demonstrate this technology using an activity-based probe (fluorophosphate) that is specific for serine hydrolases. A dendrimer containing multiple mass tags that is attached to the activity-based probe is used to analyze the binding sites of the probe through release and measurement of the mass tags on laser irradiation. A generation 8 Poly(amido amine) dendrimer with 1024 amino groups was labeled with an azide group and then more than 900 mass tags were attached in order to achieve signal amplification of nearly three orders of magnitude. The experimental protocol first involves binding of the activity-based probe containing an alkyne group to serine hydrolases in the tissue section followed by attachment of the dendrimer labeled with mass tags to the bound probe by Click chemistry. On irradiation of the labeled tissue by the laser beam in a raster pattern, the mass tags are liberated and recorded by the mass analyzer, consequently, the ion image of the mass tag reveals the distribution of serine hydrolases in the tissue. This process was shown using rat brain and mouse embryo sections. Targeted imaging has the advantage of providing high spatial resolution and high sensitivity through the use of signal amplification chemistry with high target specificity through the use of an enzyme activity probe.
Keywords: Imaging mass spectrometry, MALDI, tissue, serine hydrolase, activity-based probe, dendrimer
Matrix-assisted laser desorption ionization imaging mass spectrometry (MALDI IMS) is a technology that provides the spatial distribution and the relative abundance of compounds present in biological tissue sections.1–5 The laser is scanned in a raster across the surface of a tissue section that is coated with an organic matrix compound that promotes desorption and ionization of molecules in the tissue. Mass spectra are collected at specific coordinates across the tissue specimen, and ion density maps are generated by integrating the signal intensity of individual m/z values across the data set and plotting ion intensities at each coordinate position. The ion images generated are used to determine the location of molecular species in the tissue specimen, helping to elucidate the underlying biology of the tissue.6 Numerous studies have utilized MALDI IMS to study the development of healthy tissues and organs as well as the progression of diseased tissue states, including cancer and neurodegenerative disorders.7–8 The potential of IMS as a clinical tool to provide new molecular insights into diagnostic and prognostic decisions has also been demonstrated.9
New methods for IMS sample preparation have enabled the analysis of low molecular weight compounds such as drugs, lipids and other metabolites in isolated organs and whole body sections in animal studies.10–14 Although MALDI IMS methods were initially developed for the analysis of thin sections cut from fresh frozen tissue specimens, currently IMS can be performed on sections cut from formalin fixed tissue blocks due to the development of protocols for in situ tryptic digestion prior to the imaging process.8, 15 The localization of proteins within formalin fixed tissue is mapped through the analysis of proteotypic tryptic peptides. The proteins are identified from sequencing of these peptides and subsequent searches of the peptide sequences against protein databases.
Despite significant advances in IMS methodology, there remain some classes of molecules that are difficult to analyze. For example, proteins with molecular weights greater than 50 kDa are more difficult to detect because of decreased ionization and detection efficiencies, difficulty extracting these proteins from their native biological environment, and ion suppression effects from more abundant analytes in the tissue.16–18 Alternative approaches for the direct analysis of larger proteins have recently been reported that increase the specificity and sensitivity of IMS technology. One approach recently described is the targeting of specific proteins present within tissue sections using a corresponding antibody carrying a laser-cleavable linker with a low MW mass tag ion.19–20 After immunoreaction, the mass tag ion is liberated by laser desorption/ionization and is subsequently detected by the mass analyzer. A systematic raster across the tissue section generates an image of the target proteins by detecting the low mass tag as an indicator of the location of the bound antibody. The potential of this approach was demonstrated by simultaneously imaging three proteins expressed within the Islets of Langerhans in sections of pancreas.20–21 Laser-cleavable tags have the advantage that the detection efficiency is not dependent on the molecular weight of the protein and its cellular localization.
The present article details the development of targeted mass spectrometric imaging based on activity-based probes (ABPs) conjugated to laser-cleavable mass tags (Figure 1). ABPs are compounds designed bind to an enzyme or receptor at the active site and carry a reporter group.22 Some ABPs can bind covalently only to the active site of active proteins, and probes for several enzyme families have been developed.23 Whereas previous experiments with ABPs have focused on proteome-level characterization of enzymes according to their activity, we believe these probes can also be used as the basis for mass spectrometry-based histological studies of sectioned tissue. A broad spectrum fluorophosphonate (FP) ABP has been shown to effectively modify the serine hydrolase superfamily which includes serine proteases, lipases, esterase, acetylcholinesterase, thioesterases, some phospholipases and amidases.22 Once bound to the enzyme active site, the FP probe is conjugated to a dendrimer scaffold modified to contain over 900 laser-cleavable mass tags. Due to the fact that hundreds of mass tags are present for each ABP binding event, sensitivity is significantly enhanced following their release on irradiation by the laser. Herein, we report both a synthetic and methodological approach combining the technologies of ABPs with IMS to map the distribution of serine hydrolases in rat brain and mouse embryo tissue sections.
Figure 1.
IMS strategy using an activity-based probe conjugated to a PAMAM dendrimer modified with laser cleavable mass tags.
Materials and Methods
Reagents
Poly(amido amine) (PAMAM) dendrimers were purchased from Dendritech, Inc. (Midland, MI), and frozen rat brain from Pel Freez (Rogers, AR), and stored at −80°C. Frozen mouse embryo was obtained from DR. Scott Baldwin at Vanderbilt University Medical Center. Tissue freezing medium (TFM) was obtained from Triangle Biomedical Science, Inc. (Durham, NC). Tris [(1-benzyl-1H-1,2,3-triazol-4-yl) methyl amine (TBTA) was purchased from AnaSpec (Fremont, CA). Unless otherwise stated, all other reagents were purchased from Sigma-Aldrich.
Probe Assembly
The synthesis of the activity-based probe, inactive probe, photolabile tagging reagent, linker arm as well as assembly of the PAMAM dendrimer with the linker arm and laser-cleavable mass tags are detailed in the Supplemental Information. The tagged dendrimer was characterized by NMR spectroscopy to determine the number of tags conjugated. Briefly, 5 mg of purified tagged dendrimer was dissolved in 1 mL of deuterated DMSO. Proton NMR was acquired (300 MHz) to compare the relative areas of protons from the amide group and aromatic groups, providing the percentage of tagged amino groups. Calculation of number of tags on dendrimer is detailed in supplementary Information.
Mass Tag Detection Sensitivity
Ten mg of nitrocellulose (Whatman, 10402680) was dissolved in 2 mL of 1:1 acetone and isopropanol and 0.7 μL of this solution was pipetted into the wells of a gold coated MALDI target (AB Sciex, V503476). On the nitrocellulose surfaces, 1 μL of each following solutions were pipetted separately: a) mass tag reagent solutions: serial solutions were prepared in water from a 3.5E-2 M stock solution of compound 17 (Scheme 1 and Supplemental Information) in ethanol to concentrations ranging from 3.5E-3 to 3.5E-10 M. b) tagged dendrimer solutions: serial solutions of tagged dendrimer were prepared in water from a stock solution of tagged dendrimer of 3.5E-4 M in dry acetone to obtain the concentrations from 3.5E-6 to 3.5E-10 M. Laser desorption yield measurements were conducted on an Ultraflextreme™ MALDI-TOF/TOF (Bruker Daltonics, Billerica, MA) in reflectron mode by averaging the sum signals of the mass tag ion (m/z 333) from 500 laser shots at 9 randomly selected areas within three wells.
Chymotrypsin Activity Assay
FP probe efficacy was tested by evaluating the active-site binding to chymotrypsin. The following solutions were prepared: chymotrypsin (α-chymotrypsin from bovine pancreas) at 1 mg/mL in phosphate buffer (pH 7.2), chromogenic substrate S7388 (N-Succinyl-Ala-Ala-Pro-Phe-p-nitroanilide, Sigma) at 1 mg/mL in 10% DMSO, FP probe solution and the inactive probe were prepared as 1 mg/mL stock solutions in DMSO. To compare the activity of the FP probe and inactive probe, 20 μL of FP probe solution and inactive probe were separately added to two vials both with 1 mL of chymotrypsin solution. The chromogenic assay was carried out after 2 min of FP probe incubation. Assay procedure: 150 μL of S7388 solution and 20 μL of chymotrypsin solution (incubated with FP probe or inactive probe) were pipetted into 1 mL of tris buffer (pH 8.3). UV/vis absorbance at 410 nm was measured on an Agilent 8453 UV-Visible Spectrophotometer (Santa Clara, CA) over a 40s time.
Tissue Preparation
For sectioning, all tissue samples were immobilized with embedding medium, cut at a thickness of 12 μm on a Leica CM3050 cryostat (Leica Microsystems GmbH, Wetzlar, Germany) and thaw mounted on polylysine coated microscope slides. The slides were dried in ambient conditions and fixed for 15 min with a fresh made 10% formaldehyde solution in PBS (pH 7.2). Each slide was then rinsed with 3 × 10 min of 10 mL PBS (pH 7.2) on a Lab-Line 1304 Rotator (Melrose Park, IL) with a gentle movement. The PBS washing solution was removed, and the excess solution on the slides was carefully removed by wiping the periphery of the section with a clean tissue. The tissue section on the slide was then circled with a hydrophobic ink pen (Dako North America, Carpinteria, CA), and inside the circled area 100 μL of probe or inactive probe solutions were deposited on the tissue section. The FP probe and inactive probe solutions were prepared at concentrations of 200 μM in pH 7.2 PBS from 1 mg/ml stock solutions of these compounds in DMSO. After 30 min of incubation, the slides were rinsed with water, 70%, 80%, 95% and 100% ethanol. The probed slides were allowed to dry prior to reaction with the tagged dendrimer by Click chemical coupling.
Preparation of Positive Control Rat Brain Section
An aliquot of 1 μL of N-hydroxysuccinimide (NHS) ester of hex-5-ynoic acid (compound 2 in supplemental information) at 1 mg/mL in sodium bicarbonate buffer (100mM, pH 8.3) was pipetted at three locations generating a triangle shape on the surface of a rat brain section. The alkyne labeling reaction was performed in a humid environment to keep the solution on the section from drying. After 1 hour of incubation, the slide was rinsed with 70%, 95% and 100% ethanol and placed into 100% ethanol on a shaking bed for another 2 hours, during this period, ethanol was replaced every 30 min to remove any nonspecifically bound alkyne compound. The slides were allowed to dry prior to reaction with the tagged dendrimer by Click chemical coupling.
Linking of Tagged Dendrimer to ABP by Click coupling
The ABP was coupled to the tagged dendrimer (Figure 1) by Click chemistry24. The following solutions were made to carry out the coupling reaction:
-
a)
Tris [(1-benzyl-1H-1,2,3-triazole-4-yl) methyl] amine (TBTA) and copper sulfate: 62.42 mg of CuSO4•5H2O and 132.66 mg of TBTA was dissolved in 5 mL of 55% DMSO,
-
b)
Ascorbic acid stock solution: 100 mg of sodium ascorbic acid was dissolved in 1 ml of water,
-
c)
DIEA solution in tert-butyl alcohol: 87 μl of N,N-diisopropylethylamine (DIEA) was dissolved in 1 mL of tert-butyl alcohol,
-
d)
Laser labile tagged and azide tagged PAMAM dendrimer G8: 0.1 μM in DMSO.
In 400 μL of DMSO, 4 μL of solutions a, b and c, and 8 μL of solution d were added and vortex agitated for 30 s. 100 μL of this solution was deposited on each tissue section outlined with hydrophobic ink pen. After 1 h, the tissue sections mounted on the target plate was rinsed with DMSO by 5 × 10min × 10mL, and 10min × 10mL of acetonitrile. The slide then was taken out to dry prior to imaging MS.
Imaging Mass Spectrometry
The tissue sections labeled with the ABP and the tagged dendrimer were analyzed by laser desorption ionization using a Bruker Daltonics Ultraflextreme TOF/TOF instrument in reflectron mode at 25 kV of acceleration under optimized delayed extraction conditions. MS data resulted from summing the signals from 500 laser shots per tissue coordinate. The mass tag ion images (m/z 333) were automatically acquired with a spatial resolution of 300 μm for the positive control rat brain section, 100 μm for serine hydrolase imaging of the rat brain section, and 80 μm for serine hydrolase imaging of the mouse embryo section. Ion images were reconstructed with FlexImaging™ 2.1 software (Bruker Daltonics).
Results
A two-step protocol was employed to selectively label the serine hydrolases with laser-cleavable tags (Figure 1). First, the ABP is applied to the tissue and permitted to react with the enzyme active sites, then the tagging reagent is linked to the bound ABP using a Click chemical coupling reaction.24 This approach permits facile redesign of the ABP without changes to the tagged dendrimer used for detection. This strategy was employed to simplify the application of this approach to future ABP imaging studies that target different enzyme classes.
Synthesis of Dendrimer Linked Laser Cleavable Tags
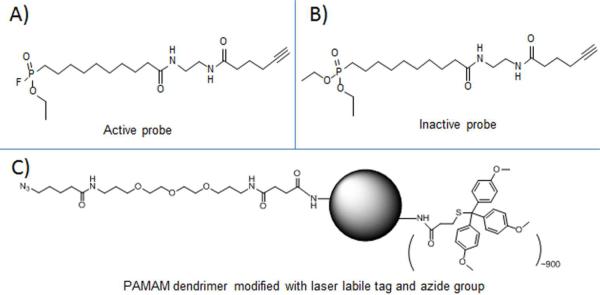
Both an active fluorophosphonate probe and an inactive diethylphosphonate probe were synthesized with an alkynyl terminal group attached (Structures are in Figure 2, procedure of synthesis is in Scheme 1 of Supplemental Information). The inactive probe was used for the evaluation of non-specific binding to the tissue surface during the optimization of the staining protocol. The mass tag was synthesized as an NHS-ester containing a trityl functional group (Schemes 2–4 of Supplemental Information), previously shown to cleave and ionize under laser-desorption conditions in the source of a mass spectrometer.25–26 Due to the hydrophobic nature of the tagging reagent, the tagged dendrimer is extremely hydrophobic and hence easily purified by the precipitation of the tagged dendrimer in 95% of ethanol, while the impurities are dissolved in ethanol and removed. Furthermore, Click chemistry was carried out in DMSO to connect the dendrimer (via its linker molecular arm) to the FP probe on tissue.
Figure 2.
Structures of A) active probe, B) inactive probe and C) modified PAMAM dendrimer with laser labile mass tag and azide group.
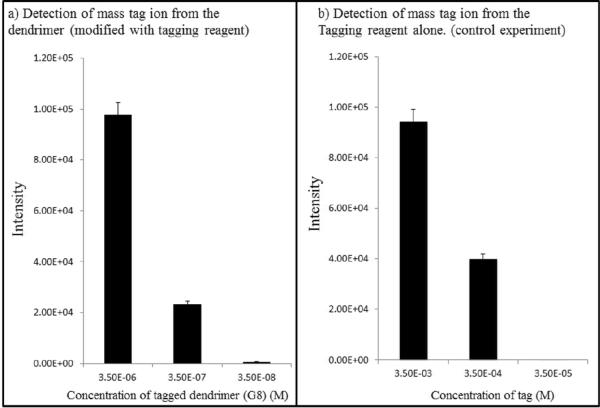
The ratio of amide protons and aromatic protons determined by NMR spectroscopy of the tagged dendrimer (Figure 1, Supplemental Information) reveal that nearly 90% of the amino groups on the surface were modified by the tagging reagent, totaling approximately 900 labeled amino groups of the 1024 maximally available amino groups on the surface of a generation 8 PAMAM dendrimer. Thus the sensitivity of detection of the targeted enzymes can be increased many hundred fold. This indeed was observed during the experiments to determine the detection limit of the tagging reagent and tagged dendrimer (Figure 3, a and b). It was found that the detection limit of the tagging reagent was 3.5E-5 M, while the detection limit of tagged dendrimer was 3.5E-8 M.
Figure 3.
Detection of the mass tag ion from a) the tagged PAMAM dendrimer compared to b) the laser cleavable tag alone results in a sensitivity increase of many hundred fold.
Activity-Based Probe Activity
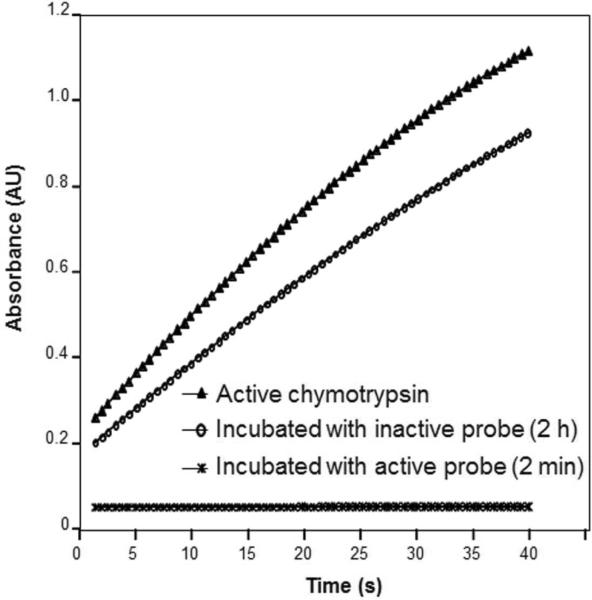
The activity and stability of the FP probe over time was also investigated. A quality control test of the probe can be done in approximately 15 min using a chymotrypsin inactivation chromogenic assay.27 Experiments were carried out using three chymotrypsin solutions (native, incubated with FP probe and incubated with inactive probe). Chymotrypsin activity was measured as a function of time by monitoring the cleavage reaction of S7388 generating p-nitroaniline and subsequent detection by UV absorbance at 410 nm. The results presented in Figure 4 show typical active and inactive (FP probe inhibited) chymotrypsin assay curves. For chymotrypsin incubated with the inactive probe for up to 2 h, a steady increase in p-nitroaniline appearance was observed as a function of time with a similar trend with respect to the one observed for native chymotrypsin. This demonstrates that the enzyme active site is preserved with only a small decrease in enzyme activity upon exposure to the inactive probe. For chymotrypsin incubated two minutes with the active FP probe, there is almost no detectable p-nitroaniline production with time indicating that the probe blocked the enzyme active site and inhibited the hydrolysis reaction. FP probe activity was confirmed with a chymotrypsin inactivation chromogenic assay prior to all in situ tissue reactions and imaging MS experiments. It was found that the stability of the FP probe with an alkyne group at −80°C is at least 2 weeks (90% activity preserved according to chromogenic assay, data not shown). Longer term stability testing was not performed in this study.
Figure 4.
Confirmation of active site binding of the FP probe with chymotrypsin, a serine hydrolase. Assay measures the hydrolysis of the p-nitroanilide from S7388, a chromogenic substrate for chymotrypsin. Chymotryptic activity is not detectable upon incubation with the active site probe for 2 min; whereas, activity is preserved after expose to the inactive probe for 2 hrs.
Tissue Analysis
The treatment of tissue sections with aldehyde fixation proved to be essential. The purpose of fixation is to preserve the integrity of tissue structure and prevent enzyme delocalization during the incubation of section with probes in aqueous buffer. It was found that a brief period of fixation with formaldehyde will immobilize the enzymes and preserve the activity of enzymes.28–29 It was observed that the tissue section keeps its spatial integrity with 15 minutes of formaldehyde fixation (there is a total loss of binding of the FP probe when the fixation is longer than 6 hours). Hence, 15 minutes of formaldehyde fixation was used in these studies.
The procedure for on-tissue probe construction was evaluated first using a simple model system. A positive control experiment was designed to test the specificity of the on-tissue Click chemistry between the FP probe and the mass tag modified dendrimer. This experiment additionally was used to assess the level of non-specific binding of the dendrimer to the tissue section. A rat brain tissue section was prepared and reacted with the alkyne-NHS solution (compound 2 in Supporting Information). The alkyne-NHS solution was manually deposited at three specific coordinates on the section that were placed in a triangular pattern using a manual pipettor. The alkyne-NHS covalently binds with primary amines of biomolecules present in the sections (i.e., lysyl residues in proteins).
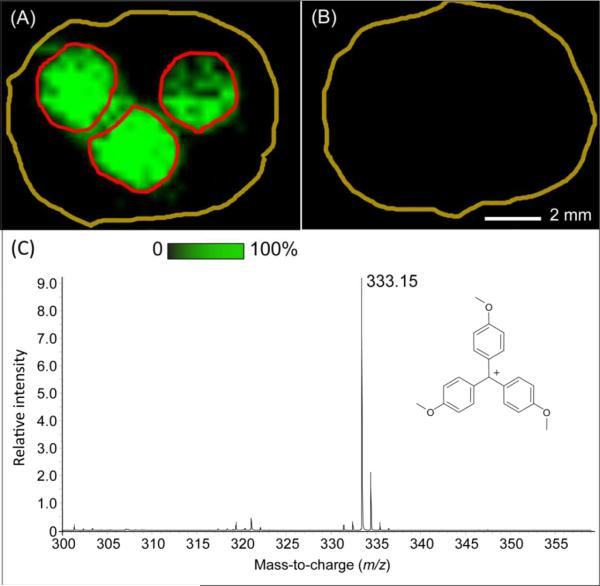
The modified G8 PAMAM dendrimer was then introduced to react with the alkyne group on the surface of tissue section by Click chemistry. After rinsing off the excess modified G8 PAMAM dendrimer, the section was imaged at a spatial resolution of 300 μm. The results presented in Figure 5A show an ion image of the mass tag at m/z 333 in the three spotted locations. A typical mass spectrum of the mass tag on tissue is shown in Figure 5C where only the laser labile tag ion was detected. This demonstrates that the on-tissue Click chemistry step was successful (ligation of the alkyne group on the tissue to the azide group on the dendrimer linker arm). Figure 5B shows the image at m/z 333 obtained from a control section not reacted with the alkyne-NHS solution. No signal of the mass tag was observed indicating the specificity of the Click chemistry reaction for the alkyne group.
Figure 5.
A) Positive control experiment confirming Click chemistry linkage of tagged dendrimer with a rat brain section dosed with alkyne-NHS at three spots (boundary of spots denoted by red circles); B) Negative control experiment of full probe construction with a rat brain section without dosing; C) A typical laser desorption mass spectrum from the dosed spots in panel A.
The distribution of serine hydrolase enzymes was then measured in different tissue specimens by IMS. Sections of a rat brain (Bregma −0.30 mm, Figure 6 A–C) were first reacted with the active or inactive probes and subsequently coupled to the mass tag derivatized G8 PAMAM dendrimer with the optimized Click chemistry protocol. Mass tag ion images (at m/z 333) were acquired with a spatial resolution of 100 μm. Serine hydrolase enzymes were found located in higher abundance in the corpus callosum (Figure 6B), in agreement with previous reports.30 The negative control experiment performed after incubation with the inactive probe compound on a serial brain section showed no signal corresponding to the tag mass (Figure 5C). A similar result was obtained from a section cut at a different position (Bregma −1.88 mm) (Figure 6 D–F).
Figure 6.
Localization of serine hydrolases at two cutting positions of two different rat brains. A–C, cutting position at Bregma −0.30 mm: A) Optical scan image of a rat brain section of H&E staining; B) Ion images of mass tags acquired on the serial section incubated with FP probe; C) Ion images of mass tags acquired on the serial section incubated with inactive probe; D–F: cutting position at Bregma −1.88 mm: D) Optical scan images of a rat brain section of H&E staining; E) Ion images of mass tags acquired on the serial section incubated with FP probe; F) Ion images of mass tags acquired on the serial section incubated with inactive probe.
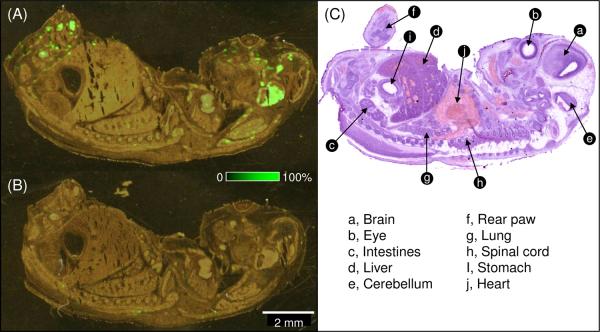
Similarly, a section cut from a mouse embryo was analyzed by IMS with a spatial resolution of 80 μm. Results for the active and inactive probes are presented in Figure 7. Serine hydrolase enzyme signatures were found abundant in several areas of the section especially in brain and the extremities of the paws. The control experiment performed after in situ incubation with the inactive probe compound showed no signal corresponding to the mass tag (Figure 7B). The increased serine hydrolases in the brain is consistent with literature that acetylcholinesterase increase in neural tissues derived from the neural crest in mouse embryo. The abundance of serine hydrolases in the extremities of the paws is under further investigation.
Figure 7.
Localization of serine hydrolase on mouse embryo section. A) Overlay of the ion image of the mass tag and the optical scan of a mouse embryo section incubated with the FP probe and subsequently linked to the tagged dendrimer; B) Overlay of ion image and optical scan of a mouse embryo section incubated with inactive probe; C) optical image of a neighboring section of H&E stain.
Discussion
The experiments described in this paper allow the determination of the localization and relative abundance of active serine hydrolase enzymes in different mammalian tissue sections. This approach introduces a new strategy for functional imaging using IMS by specifically targeting a family of proteins having similar biological activity. An important aspect of the strategy is the availability of highly specific affinity probes. In this study, compounds having affinity for the enzyme active site and that can be linked to the tagged dendrimer by Click chemistry were employed. Further development of this approach will focus on simplifying probe synthesis and assembly. Widespread use of this technology is dependent on the availability of functional probes that target different classes of proteins. While in this study the serine hydrolase enzyme family was targeted, different active enzymes could be simultaneously investigated by multiplexing different affinity probes, each coupled to mass tags having distinct molecular weights.
In order to improve detection efficiency, a dendrimer-based signal amplification system was introduced in our probe design with the potential of enhancing sensitivity by up to three orders of magnitude. A signal amplification approach is attractive because it allows detection of lower abundance proteins. Polyamidoamine (PAMAM) dendrimer has high degree of molecular uniformity and a generation 8 PAMAM dendrimer provides 1024 surface functional groups. The amine group was chosen for its ease of modification with NHS chemistry. Nonspecific binding of the G8 PAMAM dendrimer used for amplification occurs and the long period of rinsing (1 hour with changing the rinsing solution every 10min) of the sections to minimize non-specific binding has proven effective.
Imaging MS using mass tags liberated under laser desorption conditions was performed without the need to add other matrices to enhance desorption/ionization. This approach has some specific advantages over conventional MALDI Imaging MS. First, the mass tags are of low MW and can be detected with high mass resolution and sensitivity. Second, spatial resolution is limited only by the diameter of the ionizing laser beam on target. Modern TOF MS systems provide a laser spot size on-target of typically ~20–50 μm in diameter. Several publications have demonstrated <5 μm diameter on-target laser spot dimensions and thereby offer the potential for molecular imaging at the single cell level.11, 31 The third advantage is that targeted analysis using a specific recognition probe allows molecular analyses that are not readily amenable to current IMS approaches such as those involving membrane-associated proteins and those that are either of very low abundance or of high MW. Functional IMS using mass tags allows the measurement of protein activity in the tissue microenvironment, maintaining the spatial integrity with respect to important anatomical features. We believe that this technology adds a capability to IMS that will be important in better understanding tissue biology at the molecular level32.
Supplementary Material
Acknowledgements
The authors thank Benjamin Cravatt (The Scripps Research institute, CA) for discussions and his help in the appropriate choice of the FP probe for this study. The authors thank Peggi Angel for sectioning the mouse embryo. The authors also acknowledge financial support from the National Center for Research Resources (5P41RR031461-02), the National Institute of General Medical Sciences (8 P41 GM103391-02) and 5R01GM058008 from the National Institutes of Health.
Footnotes
Supporting Information The synthesis and characterization of the probes used in this study are detailed in the supplemental Information available at http://pubs.acs.org.
References
- 1.Caprioli RM, Farmer TB, Gile J. Anal. Chem. 1997;69:4751–4760. doi: 10.1021/ac970888i. [DOI] [PubMed] [Google Scholar]
- 2.Stoeckli M, Chaurand P, Hallahan DE, Caprioli RM. Nat Med. 2001;7:493–496. doi: 10.1038/86573. [DOI] [PubMed] [Google Scholar]
- 3.Cornett DS, Reyzer ML, Chaurand P, Caprioli RM. Nat. Meth. 2007;4:828–833. doi: 10.1038/nmeth1094. [DOI] [PubMed] [Google Scholar]
- 4.Franck J, Arafah K, Elayed M, Bonnel D, Vergara D, Jacquet A, Vinatier D, Wisztorski M, Day R, Fournier I, Salzet M. Mol. Cell. Proteomics. 2009;8:2023–2033. doi: 10.1074/mcp.R800016-MCP200. [DOI] [PMC free article] [PubMed] [Google Scholar]
- 5.Seeley EH, Caprioli RM. Trends in Biotechnol. 2011;29:136–143. doi: 10.1016/j.tibtech.2010.12.002. [DOI] [PMC free article] [PubMed] [Google Scholar]
- 6.Schwamborn K, Caprioli RM. Mol. Oncol. 2010;4:529–538. doi: 10.1016/j.molonc.2010.09.002. [DOI] [PMC free article] [PubMed] [Google Scholar]
- 7.Shimma S, Sugiura Y, Hayasaka T, Hoshikawa Y, Noda T, Setou M. J. Chromato. B. 2007;855:98–103. doi: 10.1016/j.jchromb.2007.02.037. [DOI] [PubMed] [Google Scholar]
- 8.Lemaire R, Desmons A, Tabet JC, Day R, Salzet M, Fournier I. J. Proteome Res. 2007;6:1295–1305. doi: 10.1021/pr060549i. [DOI] [PubMed] [Google Scholar]
- 9.Schwamborn K, Caprioli RM. Nat Rev Cancer. 2010;10:639–46. doi: 10.1038/nrc2917. [DOI] [PubMed] [Google Scholar]
- 10.Murphy RC, Hankin JA, Barkley RM. J. Lipid Res. 2009;50:S317–S322. doi: 10.1194/jlr.R800051-JLR200. [DOI] [PMC free article] [PubMed] [Google Scholar]
- 11.Chaurand P, Cornett DS, Angel PM, Caprioli RM. Mol. Cell. Proteomics. 2010 doi: 10.1074/mcp.O110.004259. [DOI] [PMC free article] [PubMed] [Google Scholar]
- 12.Cornett DS, Frappier SL, Caprioli RM. Anal. Chem. 2008;80:5648–5653. doi: 10.1021/ac800617s. [DOI] [PMC free article] [PubMed] [Google Scholar]
- 13.Burnum KE, Tranguch S, Mi D, Daikoku T, Dey SK, Caprioli RM. Endocrinology. 2008;149:3274–3278. doi: 10.1210/en.2008-0309. [DOI] [PMC free article] [PubMed] [Google Scholar]
- 14.Khatib-Shahidi S, Andersson M, Herman JL, Gillespie TA, Caprioli RM. Anal. Chem. 2006;78:6448–6456. doi: 10.1021/ac060788p. [DOI] [PubMed] [Google Scholar]
- 15.Groseclose MR, Massion PP, Chaurand P, Caprioli RM. Proteomics. 2008;8:3715–3724. doi: 10.1002/pmic.200800495. [DOI] [PMC free article] [PubMed] [Google Scholar]
- 16.Yanes O, Aviles FX, Wenzel R, Nazabal A, Zenobi R, Calvete JJ. J. Am. Soc. Mass Spectrom. 2007;18:600–606. doi: 10.1016/j.jasms.2006.11.007. [DOI] [PubMed] [Google Scholar]
- 17.van Remoortere A, van Zeijl RJM, van den Oever N, Franck J, Longuespee R, Wisztorski M, Salzet M, Deelder AM, Fournier I, McDonnell LA. J. Am. Soc. Mass Spectrom. 2010;21:1922–1929. doi: 10.1016/j.jasms.2010.07.011. [DOI] [PubMed] [Google Scholar]
- 18.Franck J, Longuespee R, Wisztorski M, Van Remoortere A, Van Zeijl R, Deelder A, Salzet M, McDonnell L, Fournier I. Med Sci Monitor. 2010;16:Br293–Br299. [PubMed] [Google Scholar]
- 19.Lemaire R, Stauber J, Wisztorski M, Van Camp C, Desmons A, Deschamps M, Proess G, Rudlof I, Woods AS, Day R, Salzet M, Fournier I. J. Proteome Res. 2007;6:2057–2067. doi: 10.1021/pr0700044. [DOI] [PMC free article] [PubMed] [Google Scholar]
- 20.Thiery G, Shchepinov MS, Southern EM, Audebourg A, Audard V, Terris B, Gut IG. Rapid Commun. Mass Spectrom. 2007;21:823–829. doi: 10.1002/rcm.2895. [DOI] [PubMed] [Google Scholar]
- 21.Thiery G, Anselmi E, Audebourg A, Darii E, Abarbri M, Terris B, Tabet J-C, Gut IG. Proteomics. 2008;8:3725–3734. doi: 10.1002/pmic.200701150. [DOI] [PubMed] [Google Scholar]
- 22.Liu Y, Patricelli M, Cravatt B. Proc. Natl. Acad. Sci. U.S.A. 1999;96:14694–9. doi: 10.1073/pnas.96.26.14694. [DOI] [PMC free article] [PubMed] [Google Scholar]
- 23.Cravatt BF, Wright AT, Kozarich JW. Annu. Rev. Biochem. 2008;77:383–414. doi: 10.1146/annurev.biochem.75.101304.124125. [DOI] [PubMed] [Google Scholar]
- 24.Kolb HC, Finn MG, Sharpless KB. Angew. Chem., Int. Ed. Engl. 2001;40:2004–2021. doi: 10.1002/1521-3773(20010601)40:11<2004::AID-ANIE2004>3.0.CO;2-5. [DOI] [PubMed] [Google Scholar]
- 25.Shchepinov MS, Chalk R, Southern EM. Nucleic Acids Symp. Ser. 1990;42:107–108. doi: 10.1093/nass/42.1.107. [DOI] [PubMed] [Google Scholar]
- 26.Shchepinov MS, Korshun VA. Chem. Soc. Rev. 2003;32:170–180. doi: 10.1039/b008900l. [DOI] [PubMed] [Google Scholar]
- 27.DelMar EG, Largman C, Brodrick JW, Geokas MC. Anal. Biochem. 1979;99:316–320. doi: 10.1016/s0003-2697(79)80013-5. [DOI] [PubMed] [Google Scholar]
- 28.Ellison JP, Olander KW. Am. J. Anat. 1972;135:23–31. doi: 10.1002/aja.1001350104. [DOI] [PubMed] [Google Scholar]
- 29.Sabatini DD, Bensch K, Barrnett RJ. J Cell Biol. 1963;17:19–58. doi: 10.1083/jcb.17.1.19. [DOI] [PMC free article] [PubMed] [Google Scholar]
- 30.Bahl R, Bradley KC, Thompson KJ, Swain RA, Rossie S, Meisel RL. Mol. Brain Res. 2001;90:101–109. doi: 10.1016/s0169-328x(01)00089-4. [DOI] [PubMed] [Google Scholar]
- 31.Guenther S, Römpp A, Kummer W, Spengler B. Int. J. Mass Spectrom. 2011;305:228–237. [Google Scholar]
- 32.Martins-Green M, Erickson CA. J. Exp. Zool. 1988;247:62–68. doi: 10.1002/jez.1402470109. [DOI] [PubMed] [Google Scholar]
Associated Data
This section collects any data citations, data availability statements, or supplementary materials included in this article.


