

Abstract
The relationship between the genotype (sequence) and the phenotype (structure) of macromolecules affects their ability to evolve new structures and functions. We here compare the genotype space organization of proteins and RNA molecules to identify differences that may affect this ability. To this end, we computationally study the genotype-phenotype relationship for short RNA and lattice proteins of a reduced monomer alphabet size, to make exhaustive analysis and direct comparison of their genotype spaces feasible. We find that many fewer protein molecules than RNA molecules fold, but they fold into many more structures than RNA. In consequence, protein phenotypes have smaller genotype networks whose member genotypes tend to be more similar than for RNA phenotypes. Neighborhoods in sequence space of a given radius around an RNA molecule contain more novel structures than for protein molecules. We compare this property to evidence from natural RNA and protein molecules, and conclude that RNA genotype space may be more conducive to the evolution of new structure phenotypes.
Introduction
Protein and RNA perform myriad structural, regulatory, and enzymatic functions inside organisms. RNA may have played a more important role early in life's evolution, but this role has since been usurped by proteins, especially in catalysis (1). Both protein and RNA molecules have a primary structure—their amino acid and nucleotide sequence. This sequence can form secondary structures that comprise α-helices and pleated β-sheets for proteins, and planar folds that arise through intramolecular pairing of complementary bases for RNA. The secondary structure is the basis for a molecule's tertiary structure, that is, the three-dimensional fold required for many molecular functions, such as enzymatic catalysis.
To understand how the many known functions of protein and RNA arose in evolution, and to understand how new functions originate, it is insufficient to study individual molecules. One must study the collection of all known molecules in the context of an organizing framework. This framework is provided by the concept of sequence space or genotype space (2), the collection of all possible nucleotide or amino-acid sequences. Specifically, because evolution is driven by genotypic change, one must study how changes in a molecule's genotype affect its phenotype, that is, its fold and its function. Many past efforts were aimed at characterizing this genotype-phenotype relationship. In proteins, these efforts rely both on experimental data from known proteins and on simple models of protein folding, such as lattice proteins (3–5). In RNA, where many fewer tertiary structures are known than for proteins, such efforts have until recently (6) largely focused on RNA secondary structures (7–9). A limitation of this focus is that secondary structures are necessary but not sufficient for the function of many RNA molecules. Existing work indicates an important similarity between protein and RNA genotype spaces: molecules with the same structure can have widely divergent sequences (10,11); and these molecules can typically be connected by a series of single amino acid or nucleotide changes that leave the structure unchanged (12,13). In other words, molecules with the same structure form large connected networks in genotype space. These networks are variously called mutational networks, neutral networks (9,14), or genotype networks.
For proteins, pertinent evidence comes from phylogenetic analysis of many proteins with known structure and functions. An example is globin molecules, which are oxygen-binding globular proteins that probably have a common evolutionary origin (15). Throughout this evolutionary history, globins have preserved a common structure and biochemical activity, despite having diverged to a great extent in their sequences: Only 12% of amino acids are preserved among known globins (10). Previous work on simple exact models of protein structure formation explored the distribution and organization of genotype networks in sequence space (4,16), and suggest that genotype networks are densely connected and well separated in genotype space (4,17). In RNA molecules, most of the pertinent evidence about the organization of genotype space comes from computational predictions of RNA secondary structure (9). For example, RNA molecules that adopt the cloverleaf secondary structure characteristic of transfer RNAs may differ in >90% of their nucleotides (11,18).
The purpose of this contribution is to compare the relationship between sequence and structure for proteins and RNA. To be able to study this relationship systematically, we mostly use simple models of structure formation. Specifically, we study short proteins with a reduced amino-acid alphabet and their fold on a two-dimensional lattice, as well as short RNA molecules with a reduced nucleotide alphabet and their planar, secondary structure fold. Such models (3,8) allow one to explore the genotype-phenotype relationship of macromolecules for tens of thousands of genotypes and phenotypes. These models are relevant for understanding larger and more complex biological molecules, as shown by thermodynamical calculations, folding studies, and evolutionary studies (17,19,20).
With these models, we explore general folding statistics, and the organization of phenotypes into connected networks in sequence space. Most importantly, although similar work has been carried out for RNA and proteins separately (4,9,21,22), our main purpose is to juxtapose and compare RNA and proteins in this regard. We supplement this comparative analysis with a limited analysis of recent empirical data from natural protein and RNA structures.
Methods
RNA and protein lattice model
We enumerated all RNA sequences of length 25 composed of either AU or GC nucleotides. We determined the minimum free energy fold for each of the 33,554,432 (225) possible sequences in each set of sequences using the routine RNAfold from the Vienna RNA package (8) with default parameters. We call a sequence foldable if its minimum free energy structure is unique. We refer to the resulting data sets as the AU25 and GC25 data sets, respectively. Statistics on the fraction of foldable sequences are provided in Table 1, and Table S1, Table S2, and Table S3 in the Supporting Material.
Table 1.
General statistics of RNA and protein sequence-structure maps
| Model | Uniquely foldable | Number of structures | Foldable fraction |
|---|---|---|---|
| HP25 | 765,147 | 107,336 | 0.023 |
| GC25 | 33,544,758 | 31,727 | 0.999 |
We used the method reported by Irbaeck and Troein (23) to enumerate the all model protein polymers of length 25 on a two-dimensional lattice. This method encodes the conformational space in a set of allowed moves in space and reduces conformations to contact sets, or conserved combinations of contacts between pairs of hydrophobic amino acids. Sequences are folded consecutively into similar contact sets such that information about previously folded sequences can be used to infer the subsequent ones.
Irbaeck and Troein's (23) method is based on the classical hydrophobic-polar (HP) model, where only the contacts between hydrophobic monomers (H) contribute to stability. The total energy of a sequence S of length L, folded into a conformation C, is defined as
where Δij is equal to 1 if and only if monomers at position i and j contact each other, and are not adjacent on the chain; Δij = 0 otherwise. U(si,sj) is the energy function of the HP model, where si can take one of two values from the monomer alphabet A = {H,P}. U(H,H) equals −1 and is the only monomer interaction that contributes to the total energy of the confirmation C. Foldable sequences are those where only a single conformation has the minimum energy. We refer to the resulting data set as the HP25 data set. Statistics on the total fraction of foldable sequences are provided in Table 1 and see Table S1.
We note that we focused on two-dimensional models, because no simple three-dimensional folding model is available for RNA, and because our main purpose was to compare RNA and protein folds in their respective genotype spaces.
Sequence and structure data
In November 2010 we obtained 1883 single-chain proteins from the Protein Data Bank (24) solved by x-ray crystallography, with resolutions better than 3.0 Å, with no ligands, and with sizes between 100 and 200 amino acids. Structural alignments were produced with the software MAMMOTH (25) from a random sample of 10,000 protein pairs. The method (like the one on which our RNA alignments are based) uses the unit vector alignment strategy (26). From our protein sample we obtained 2760 highly significant alignments. The p-value of an alignment is calculated assuming that the accuracy of random structural alignments follows a Gumbel distribution (25,27). Data points shown in Fig. 5 A are highly significant alignments defined as those with a –ln(p-value) > 4.5.
Figure 5.

Comparison of sequence-structure relationships for natural proteins and RNA molecules. (A) Sequence identity versus tertiary structure identity for proteins. The figure shows sequence identity calculated over the structurally aligned residues (horizontal axis) versus structural identity (vertical axis). The figure is based on pairwise comparisons of 1883 single-chain proteins from the Protein Data Bank (24) that were solved by x-ray crystallography and that fulfilled the following criteria: The structure's resolution is at least 3.0 Å, the protein has no bound ligands, and it is a size that lies between 100 and 200 amino acids. Structural alignments were produced with the software MAMMOTH (25) from a random sample of 2760 protein pairs (see Methods). Data points shown in panel A were filtered at a logarithmically (base e) transformed p-value exceeding 5.0. (B) Sequence identity versus tertiary structure identity for RNA. The figure shows sequence identity over all structurally aligned residues (horizontal axis) versus percentage of structural identity (vertical axis). The data are based on 1210 alignments (158 structures) extracted from a larger data set of 451 structures with 101,475 alignments produced with the program SARA (28).
We obtained RNA structure information from the supplementary data of Capriotti and Marti-Renom (6). These data are composed of 451 structures that correspond to 101,475 alignments produced with the program SARA (28). Data points in Fig. 5 B (1210 alignments) are true positive alignments defined as those with a –ln(p-value) > 4.5 (6).
Results
The sequence space of RNA secondary structure and protein lattice models
An intrinsic problem of comparing RNA and protein sequence spaces is that they possess different dimensions. We here alleviate this problem by studying sequences with a reduced alphabet size A, that is, a reduced number of different monomers that can occur in a molecule. In general, the dimension of sequence space is given by L(A-1), where L corresponds to the length of a sequence, and A to the size of the monomer alphabet (A = 4 and A = 20 for biological RNA and protein molecules). In this work, we consider RNA and protein sequence spaces of dimension 25. Specifically, we analyze model proteins of length L = 25 that consist only of two types of amino acids, hydrophobic (H) and hydrophilic (P for polar). In other words, we use the well-studied HP model of protein folding (3) whose alphabet size is equal to A = 2. For RNA, we use molecules of length L = 25, and a reduced alphabet size of two instead of four (A,U,G,C) nucleotides. Specifically, we consider sequences composed only of G and C nucleotides (see the Supporting Material for a discussion of the AU alphabet). We compute the fold of HP model proteins on a protein off-lattice using standard methods (23), and we compute the minimum free energy secondary structures of RNA sequences using the Vienna RNA package ((8); see also Methods). Below, we refer to the two data sets that emerge from these computations as HP25 and GC25.
We are well aware that many researchers have studied RNA and protein sequence spaces individually (4,9,14,16,21,22). However, none of these studies have directly compared sequence-structure relations of proteins and RNA, which is the main purpose of our analyses.
The total number of possible protein or RNA sequences in our model system is 225. We first analyzed which of these sequences fold into a unique structure. In the protein (HP25) data set, only 2% of sequences do (Table 1). We call such sequences uniquely foldable. In the RNA (GC25) data set 99.9% of sequences fold into unique secondary structures (Table 1). These statistics and the numbers of different structures that these sequences form are summarized in Table 1.
The observation that there are many fewer foldable proteins than RNA molecules is perhaps the most prominent difference between proteins and RNA. This observation is consistent with experimental evidence from biological molecules. For example, soluble and compact protein structures are rare in random protein libraries (29,30), whereas RNA molecules taken from a random library collapse with high probability into compact and ordered structures (31). The ultimate causes of these differences lie in the chemistry and folding mechanisms of RNA and proteins (32). However, more than in the causes of different foldability, we are here interested in the consequences of these differences for RNA and proteins.
The distribution of sequences versus structures
Tables 1 and 2 show that in both our protein and RNA data sets, many more foldable sequences than structures exist. This implies that any one structure is typically formed by multiple uniquely foldable sequences. Fig. 1 shows the distribution of the number of sequences per structure for both proteins and RNA. The figure shows that the number of sequences per structure is highly heterogeneous and varies over several orders of magnitude for both proteins and RNA. Taken together, the sequences that form those structures with many associated sequences account for a majority of foldable sequences. For example, the structures whose associated number of sequences is in the top 10% (among all structures) account for 85% of foldable RNA sequences, and for 47% of foldable protein sequences. This property has been observed separately for both RNA (9) and proteins (33).
Table 2.
General statistics of RNA and protein genotype networks and genotype sets
| Model | Genotype sets |
Genotype networks |
Networks per set | ||
|---|---|---|---|---|---|
| Total sets | Sequences per set | Total networks | Sequences per network | ||
| HP25 | 107,336 | 7.1 (11.8) | 148,254 | 5.1 (9.8) | 1.3 (0.7) |
| GC25 | 31,727 | 1057 (4827) | 2,263,944 | 14.8 (43.8) | 71 (151) |
Figure 1.

There are many fewer sequences per structure in proteins than in RNA. The figure shows the distribution of the number of structures (vertical axis) that are formed by a given number of sequences (horizontal axis) for protein (HP25) and RNA (GC25) data set. Note the double-logarithmic scale. Data were obtained from exhaustive enumeration of RNA sequences composed of GC nucleotides and HP protein sequences. Statistics on the number of sequences and structures are presented in Table 1.
Fig. 1 also shows another important difference between RNA and proteins: except for those structures that are formed by the smallest number of sequences, protein structures are generally formed by fewer sequences than RNA structures. This is evident from the much steeper slope of the protein data in Fig. 1. It is a consequence of the fewer uniquely foldable sequences and the higher number of structures for proteins (Table 1) (31,34).
Neutral networks in sequence space
We next analyzed how different the sequences are that fold into any one structure. To this end, we first define a genotype set (or neutral set) as the collection of all sequences that fold into a given structure. We define a genotype network (or neutral network) as a collection of sequences that fold into the same structure and that can be connected to each other through a sequence of single monomer changes, none of which changes the structure (9,21). A single genotype set can contain one or more genotype networks.
Table 2 summarizes observations from this analysis. The first notable feature is that proteins form many more structures than RNA, and thus have many more neutral sets, but each such set has many fewer sequences (7.1 sequences per structure for HP25 proteins, versus >1000 sequences per structure for GC25 RNA, Table 2). The latter observation is another consequence of the fact that fewer proteins are uniquely foldable. The largest genotype set comprises 326 sequences for HP25 proteins, but 202,217 sequences for GC25 RNA molecules. In both proteins and RNA, however, the vast majority of genotype sets is small (Fig. 1, and see Fig. S1 in the Supporting Material).
We next asked in how many monomers the sequences within a genotype set typically differ. Fig. 2 shows the distributions of this average sequence distance. HP25 protein sequences with the same structure are typically much more similar to each other (mean ± SD: 1.3 ± 1.1 monomer differences) than GC25 RNA sequences (7.4 ± 3.3 differences). Maximum distances between sequences with the same structure are also much smaller in proteins than in RNA (mean ± SD 2.9 ± 2.7 and 15.9 ± 8.9 monomer differences, respectively; see Fig. 2, B and D). Whereas small maximal sequence distances dominate for proteins (50% of the HP25 genotype sets show maximum distances shorter than three-point mutations), this is not the case for RNA (50% of the GC25 genotype sets have maximum distances larger than 18-point mutations). Moreover, 32% of RNA genotype sets have a maximum distance of 25 and thus extend all the way through genotype space, but none do so for the HP25 proteins.
Figure 2.

Distribution of the mean and maximum distances of sequences in a genotype set. (Plots at the left) Distribution of the mean sequence distances (in number of monomer changes) observed per genotype set in the (A) HP25 and (C) GC25 data. (Plots at the right) Distributions of the maximum sequence distance between sequences in the same genotype set, for the (B) HP25 and (D) GC25 data sets.
As mentioned above, genotype sets may be composed of more than one connected component or genotype network. The number of genotype networks per genotype set is smaller in proteins than in RNA (Table 2), and genotype networks contain, on average, fewer sequences for proteins than for RNA. Fig. S2 shows the distribution of mean and maximum distances between sequences in a genotype network for both protein and RNA molecules. These distances are again smaller for proteins than for RNA. In contrast to many RNA genotype sets, however, RNA genotype networks do not traverse genotype space completely.
In sum, the sets of sequences forming any one structure differ between model protein and RNA molecules. Protein genotype sets and networks are smaller, and extend less far through sequence space than RNA genotype sets, which may traverse genotype space completely.
Shape space covering
From an evolutionary perspective, genotype networks are important, because they allow genotypic (sequence) change without phenotypic (structure) change. A genotype's neighborhood—all sequences that differ from it in one monomer—may contain different novel phenotypes, depending on the genotype's location on a genotype network (13,35,36). Thus, genotype networks may facilitate the exploration of novel phenotypes by evolving populations. Larger genotype networks may allow the exploration of more novel phenotypes than small genotype networks (37).
Past computational studies on RNA molecules have uncovered a peculiar feature of RNA secondary structures that has been called “shape space covering” and that has implications for phenotypic evolution (22,38). For example, a ball of merely r ≤ 15 changed nucleotides around RNA genotypes of length L = 100, contains all frequent RNA secondary structures (9,22), despite the fact that this ball comprises only a vanishing fraction (10−37th) of sequence space. Some work on the HP lattice model indicates that this property may be less pronounced or absent in proteins (4).
We took advantage of the direct comparability of the protein and RNA sequence spaces to characterize how shape space covering may differ between protein and RNA. Specifically, we first asked what fraction of all phenotypes is contained in a ball of a given radius around any one genotype.
In this analysis, we initially focused on genotypes chosen at random from genotype space. Fig. 3 A shows the total percentage of all phenotypes (vertical axis) that can be encountered in a ball of a given radius (horizontal axis) around a genotype. Observations are averaged over 103 randomly chosen genotypes. The figure shows that shape space covering is significantly lower in HP25 proteins than in GC25 RNA molecules. For example a ball with radius R = 5 nucleotides contains on average 12.3% of RNA phenotypes, whereas it contains on average only 1.1% of protein phenotypes (Fig. 3 A). At a radius of 10 monomer changes this ball would cover 72.8 and 38.9% of phenotypes for RNA and proteins, respectively. Fig. S3A shows results of a related analysis based on only those structures that are realized by only one sequence and whose genotype network size is therefore also equal to one. In both, RNA and proteins, the results are almost identical to randomly chosen genotypes.
Figure 3.

Shape space covering of short RNA and protein sequences with a binary alphabet. (A) Shape space covering in neighborhoods of 103 sequences sampled at random from genotype space, regardless of the size of the genotype network to which they belong. To estimate shape space covering of a particular sequence we determined the percentage of all structures that can be observed within a ball of a given radius (horizontal axis) around the sequence. (B) Shape space covering of the most populated genotype networks. We estimated the shape space covering of an entire network by counting the number of different phenotypes contained within a neighborhood of a given radius around random samples of sequences in the networks. The data shown are based on all genotype networks in the top 0.1 percentile of genotype network size. This percentile corresponds to 2260 and 148 RNA and protein genotype networks, respectively. A total of 103 randomly sampled sequences were obtained from RNA networks and because protein networks are considerably smaller than RNA networks, they were explored exhaustively. Error bars correspond to 1 SD.
A next analysis examined the phenotypes accessible within a neighborhood of a given radius around an entire genotype network. We focused on genotype networks in the 0.1 percentile of genotype network size, to estimate an upper bound on the percentage of new structures reachable from a genotype network. Because the most populated RNA genotype networks are very large, we sampled 103 random sequences from each network, and calculated the fraction of all RNA structures that are contained in neighborhoods of various sizes around these sequences. The largest genotype networks of proteins are smaller, which is why we were able to use all sequences on a protein genotype network for this analysis. The actual number of sequences accessible from a large RNA genotype network may be even greater than we found, because we were able to study only a sample of sequences from such a network. We note that this renders all differences we discuss below between RNA and protein shape space covering conservative.
The results of this analysis are shown in Fig. 3 B. A comparison with Fig. 3 A shows that a greater percentage of structures can be reached from a large genotype network. For example, whereas only 12.3% of RNA structures are reachable through no more than R = 5 nucleotide changes from a single randomly chosen genotype, 70.2% are reachable through no more than five changes from a large genotype network. The corresponding percentages are 1.1 and 14.0 for proteins.
Next, we studied the number of accessible phenotypes from an average-sized genotype network. For each RNA and proteins, we sampled 103 random genotypes, identified their genotype networks and, as before, explored the space covering of every sequence in the network. A greater percentage of structures is accessible at any given radius for RNA sequences than for protein sequences (see Fig. S3 B). For example, 23.2% of RNA structures but only 2.5% of protein structures are accessible within a radius R = 5 of the studied genotype networks.
In a complementary analysis, we ranked genotype networks by size and sampled the number of sequences in a given protein genotype network from an RNA genotype network of the same rank. The results of this analysis (not shown) were identical to the results we just discussed.
New structures in genotype neighborhoods
A genotype neighborhood or (k-mutant) neighborhood is the set of sequences that are no more than k point mutations away from a particular sequence. The novel phenotypes that are the most accessible from any one sequence are those that are a single nucleotide change away from this sequence, that is, they are within the immediate (one-mutant) neighborhood of this sequence. The neighborhoods of different genotypes G1 and G2 on the same genotype network can contain different new phenotypes. This is important from an evolutionary perspective, because it means that the existence of genotype networks facilitates phenotypic variability (39). Previous studies have analyzed these differences for RNA molecules as a function of the distance D (in nucleotide changes) between G1 and G2 (13,35). One of these studies showed that the diversity of phenotypes occurring in different neighborhoods increases rapidly as the distance D between genotypes increases (35).
We here wanted to compare this diversity between protein and RNA molecules. To this end, we studied pairs of genotypes G1 and G2 on the same genotype network that differed in D nucleotides. We denote as P1 and P2 the set of new structures that are found in the one-mutant neighborhoods of G1 and G2, respectively. We were especially interested in the fraction fD of these structures that occurred in the neighborhood of one but not the other genotype, i.e., we determined fD = 1− |P1 ∩ P2|/|P1|, where |X| denotes the number of elements in the set X. Note that this analysis of ours is restricted to sequences on the same genotype network. Thus, the maximally possible distance D between the pairs of genotypes we analyze is dictated by the diameter of the genotype network they are part of (see Fig. S2). We studied fD for genotype networks whose size was in the top 0.1 percentile of all genotype networks. Because large RNA genotype networks may contain thousands of sequences, we only sampled 103 genotypes from each genotype network, and calculated fD for all pairwise combinations of these genotypes. For proteins, we calculated fD for all protein pairs on a genotype network.
Fig. 4 shows the results of this analysis. We note three general features: First, at all distances D between two genotypes, a majority of new structures that occur in one neighborhood do not also occur in the other neighborhood (fD > 0.5). Second, the fraction fD of unique structures is statistically indistinguishable between proteins and RNA for D < 9, partly because it has a large standard deviation, especially for proteins. Third, for D > 9, fD remains close to one for proteins but decreases for RNA, even though it does stay markedly above fD = 0.5. For example, for HP25 proteins f9 > 0.99, more than 99% of structures found in neighborhoods of genotypes separated by nine-point mutations are unique to one neighborhood, whereas for GC25 RNA sequences f9 = 0.89 ± 0.09. In a complementary analysis, we ranked genotype networks by size, sampled the number of sequences in a given protein genotype network from an RNA genotype network of the same rank, and recalculated fD. The results of this analysis (not shown) were identical to the results we just discussed.
Figure 4.
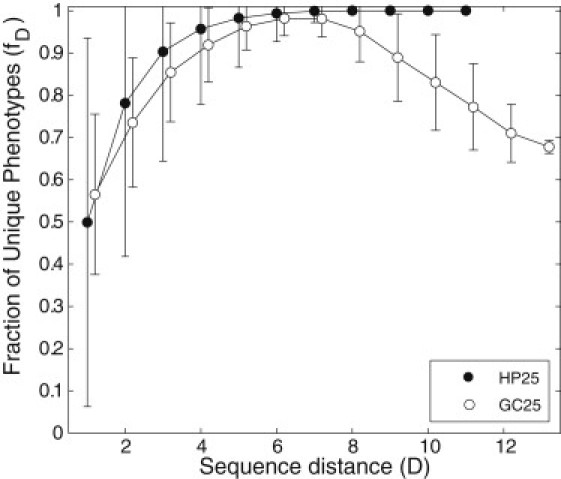
Novel structures in the neighborhood of different genotypes on the same genotype network. (Horizontal axis) Genotype distance D between two genotypes on the same protein (HP25) or RNA (GC25) genotype network. (Vertical axis) Fraction of new phenotypes (fD) that is unique to one neighborhood, in the sense that it occurs in the neighborhood of one of these genotypes but not the other. Data are based on genotype networks in the top 0.1 percentile of genotype network size. Sampling was carried out as described above (see Fig. 3B legend and main text for details). Error bars correspond to 1 SD.
In the Supporting Material (Fig. S5, Fig. S6, Fig. S7, Fig. S8, and Fig. S9, and Table S2 and Table S3), we discuss observations from RNA molecules using the other possible two-letter RNA alphabet, the AU alphabet. These observations show differences to HP25 proteins similar to those observed for GC25 RNA molecules (see Fig. S9). The one exception is the last analysis we reported here, where AU25 RNA molecules show much lower neighborhood diversity fD than GC25 RNA molecules. Neighborhood diversity may thus be highly specific to the RNA alphabet.
A comparison to natural RNA and protein molecules
The data we showed thus far reveal consistent differences between the organization of RNA and protein genotype spaces for our model molecules. Ideally, we would like to compare these data to information from natural RNA and protein molecules, but a thorough comparison is currently not possible: First, compared to the size of sequence space there are few natural molecules with known sequence and structure, and these known molecules are not necessarily an unbiased sample from sequence space. Second, several systematic analyses that are possible in the small sequence space we study here are currently impossible for natural molecules. These include the exhaustive analyses of a molecule's neighborhood, or an exploration of phenotypes in a specific region of genotype space. Third, many fewer RNA structures than protein structures are known.
Although these limitations are severe and should be kept in mind, information has recently become available that allows us to compare at least a few features of natural RNA (6) and protein structures. To this end, the panels of Fig. 5 plot the sequence identity between two molecules (horizontal axis) against the similarity of their tertiary structures (vertical axis). Fig. 5 A shows this relationship for 2760 protein pairs, and Fig. 5 B shows it for 1210 RNA pairs, all of which have known tertiary structures (6). For proteins, plots like this have been pioneered by Chothia and Lesk (40). The dashed vertical lines in both figures indicate sequence identities expected for proteins and RNA with random monomer compositions.
The figure demonstrates that protein sequences at any given sequence identity tend to have more conserved structure than RNA sequences. For example, proteins that share between 40 and 50% of their amino acids show 96% structural similarity on average, whereas RNA sequences at this divergence show only 84% structural similarity on average. Also, the greater the differences between two sequences become, the greater the range of structural similarities that their folds can have (Fig. 5 A).
A second observation is that for RNA, the structural similarity of the most diverged pairs of molecules at any one sequence identity decreases nearly linearly with sequence identity, which gives the data in Fig. 5 B its nearly triangular appearance. This is not true for proteins, where even the most diverged structures are highly similar down to ∼40% sequence identity. For example, for proteins at 50% sequence identity, structural similarities fall into a narrow interval ranging from 91 to 100%, whereas for RNA molecules at 50% sequence identity, structural similarities vary much more broadly, that is, between 57 and 96% (Fig. 5).
Because natural proteins have a much larger monomer alphabet size of |A| = 20 than natural RNAs with |A| = 4, the question arises whether these differences come from the different alphabet sizes. To address this concern, we have recalculated the data in Fig. 5 A for amino-acid alphabets of smaller size (see Fig. S4), including an alphabet of size four (see Fig. S4 C). This analysis largely preserved the shape of the sequence-structure relationship in Fig. 5A, and thus confirms that alphabet size does not determine the differences in this relationship for proteins and RNA structures.
The second of the two differences we discussed between RNA and proteins is consistent with our earlier observations on shape space covering. Specifically, our model molecules showed that regions of a given radius around a sequence contain more structures for RNA than for proteins (Fig. 3, and see Fig. S3). This observation is consistent with the triangular shape of the data in Fig. 5 B, which indicates that RNA molecules at any given sequence divergence adopt more diverse structures than protein molecules at the same sequence divergence.
Discussion
Our observations from tractable RNA and protein genotype spaces confirm two well-known commonalities of the relationship between genotype (sequence) and phenotype (structure) from previous work (9,14,33): First, many phenotypes are formed by more than one genotype. The genotypes adopting any one phenotype usually form connected networks of genotypes (Table 1 and Fig. 1). Second, some phenotypes are adopted by many more phenotypes than others.
The RNA and protein genotype-phenotype relationships also show major differences, which are the main focus of our work. The first of them is that only a small fraction of protein genotypes—0.02% for the HP25 model—adopts a unique fold. This is not the case for RNA, where most genotypes—99% in the GC25 data—adopt a unique fold (Table 1).
This observation is consistent with available information from real proteins and RNA molecules. Specifically, few random protein sequences fold into well-ordered structures (30,34). For example, it has been estimated that 20% of random protein sequences with 20 amino acids are soluble (41), and that 5% of proteins composed of three different amino acids can fold (34). In contrast, for RNA, a large fraction of random sequences collapse into compact secondary structures (31). We note in passing that foldability constraints may be imposed by the monomer composition of macromolecules. For example in the case of RNA, the alphabet size can have a strong impact on the fraction of foldable sequences (see the Supporting Material). In the case of proteins, not every foldable sequence possesses protein-like behavior, meaning folding kinetics that favor adoption of a well-defined structure. Such favorable kinetics may depend on the fraction of hydrophobic residues in a protein sequence (42).
A second major difference is that HP25 proteins form many more structures—even though fewer of their sequences fold—than GC25 RNA molecules. This property is likely to arise from the larger number of possible contacts that each monomer can have in a protein. Specifically, whereas RNA monomers in a secondary structure can have a maximum of one contact per monomer, protein monomers can have between zero and three contacts, even for the simple two-dimensional lattice proteins that we consider. These differences also exist for tertiary structures of natural RNA and protein molecules. For example, at radii >3.0 Å around any one nucleotide and amino-acid monomer, the number of other monomers one finds for RNA is on average less than half that observed for proteins (E. Ferrada and A. Wagner, unpublished observations). These differences are caused by intrinsic structural properties of monomers and how they interact. They have important consequences for the folding kinetics of proteins and RNA. Whereas protein folding has been described as a collapse process mainly driven by entropy, RNA can form stable secondary structures in the absence of tertiary contacts by an enthalpy-driven process (43). This difference in the folding mechanisms of RNA and proteins translates into differences between the energy of the folded versus the unfolded states, i.e., into differences in the energy gap.
Three more differences between RNA and protein follow from the first two differences: The number of genotypes that form a specific phenotype is smaller for proteins; the number of genotypes in any one genotype network is also smaller for proteins; and the average and maximum distances of genotypes with the same phenotype are smaller for proteins. For example, 32% of RNA genotype sets contain genotypes with the maximum distance of 25 nucleotide changes, but none do for proteins (Fig. 2, B and D). Thus, genotype sets and genotype networks are more fragmented for proteins than for RNA.
A last and important final difference regards shape space covering (21). A ball of a given radius around an RNA molecule in sequence space contains a larger percentage of phenotypes than a ball of the same radius around a protein molecule. This is not a self-evident consequence of the first two differences. It indicates that genotype networks are highly interwoven in the case of RNA (9), and less so in the case of proteins (16) (as indicated in Fig. 3 and see Fig. S3).
Any study that uses simplified models of phenotype formation like ours has limitations. Perhaps the most important limitation comes from the need to analyze short sequences with a reduced monomer alphabet to study genotype space exhaustively. This limitation can cause “finite size effects” that affect any observations regarding genotype space organization (5,44). Finite size effects may affect proteins and RNA to a different extent. We defer their analysis to future work, which may be able to study their importance systematically in genotype spaces of increasing size.
A second limitation comes from assumptions about how the phenotypes we study are formed. Central to any model of macromolecular phenotype formation is the use of energy functions and of monomer alphabet sizes. In this regard we note that the energy functions of our models reflect well-known biophysical principles. The HP model relies on the well-known role of amino-acid hydrophobicity in protein folding (3,45); and our energy function for RNA secondary structure formation is derived from empirical energy calculations (8). With respect to alphabet size, we note that using the same alphabet size is essential if one wants to compare the organization of genotype space for two different classes of molecules, because it ensures that the compared spaces have the same dimension. Functional proteins that contain amino acids drawn from a highly reduced alphabet have been successfully designed (46). Similarly, active RNA ribozymes that use two- and three-monomer alphabet sizes have been created in the laboratory (47–49).
We tentatively conclude, based on our limited analysis, that RNA genotype spaces are more conducive to evolutionary searches for novel RNA structure phenotypes by exploring small neighborhoods of genotypes and genotype networks. We are aware that a high diversity of easily accessible structure phenotypes does not imply a high diversity of biochemical functions. For example, it is thought that the larger size of the protein monomer alphabet allows proteins to catalyze more biochemical reactions (50,51). However, where structures and their accessibility matter, RNA may be the more versatile molecule. Candidate examples include many RNA molecules encoded in viral and other genomes, molecules whose secondary structures have regulatory functions (52,53). It is thus perhaps no coincidence that many such RNA molecules are continually being discovered.
Acknowledgments
We acknowledge support through Swiss National Science Foundation grants No. 315200-116814, No. 315200-119697, and No. 315230-129708, as well as through the YeastX project of SystemsX.ch, and the University Priority Research Program in Systems Biology at the University of Zurich. E.F. acknowledges support through UZH Forschungskredit.
Supporting Material
References
- 1.Wilson D.S., Szostak J.W. In vitro selection of functional nucleic acids. Annu. Rev. Biochem. 1999;68:611–647. doi: 10.1146/annurev.biochem.68.1.611. [DOI] [PubMed] [Google Scholar]
- 2.Smith J.M. Natural selection and the concept of a protein space. Nature. 1970;225:563–564. doi: 10.1038/225563a0. [DOI] [PubMed] [Google Scholar]
- 3.Lau K.F., Dill K.A. A lattice statistical mechanics model of the conformational and sequence spaces of proteins. Macromolecules. 1989;22:3986–3997. [Google Scholar]
- 4.Bornberg-Bauer E. How are model protein structures distributed in sequence space? Biophys. J. 1997;73:2393–2403. doi: 10.1016/S0006-3495(97)78268-7. [DOI] [PMC free article] [PubMed] [Google Scholar]
- 5.Buchler N.E.G., Goldstein R.A. Effect of alphabet size and foldability requirements on protein structure designability. Proteins. 1999;34:113–124. [PubMed] [Google Scholar]
- 6.Capriotti E., Marti-Renom M.A. Quantifying the relationship between sequence and three-dimensional structure conservation in RNA. BMC Bioinformatics. 2010;11:322. doi: 10.1186/1471-2105-11-322. [DOI] [PMC free article] [PubMed] [Google Scholar]
- 7.Fontana W., Konings D.A.M., Schuster P. Statistics of RNA secondary structures. Biopolymers. 1993;33:1389–1404. doi: 10.1002/bip.360330909. [DOI] [PubMed] [Google Scholar]
- 8.Hofacker I.L., Fontana W., Schuster P. Fast folding and comparison of RNA secondary structures. Monatsh. Chem. 1994;125:167–188. [Google Scholar]
- 9.Schuster P., Fontana W., Hofacker I.L. From sequences to shapes and back: a case study in RNA secondary structures. Proc. Biol. Sci. 1994;255:279–284. doi: 10.1098/rspb.1994.0040. [DOI] [PubMed] [Google Scholar]
- 10.Aronson H.E., Royer W.E., Jr., Hendrickson W.A. Quantification of tertiary structural conservation despite primary sequence drift in the globin fold. Protein Sci. 1994;3:1706–1711. doi: 10.1002/pro.5560031009. [DOI] [PMC free article] [PubMed] [Google Scholar]
- 11.Huynen M.A. Exploring phenotype space through neutral evolution. J. Mol. Evol. 1996;43:165–169. doi: 10.1007/BF02338823. [DOI] [PubMed] [Google Scholar]
- 12.Babajide A., Hofacker I.L., Stadler P.F. Neutral networks in protein space: a computational study based on knowledge-based potentials of mean force. Fold. Des. 1997;2:261–269. doi: 10.1016/S1359-0278(97)00037-0. [DOI] [PubMed] [Google Scholar]
- 13.Fontana W., Schuster P. Continuity in evolution: on the nature of transitions. Science. 1998;280:1451–1455. doi: 10.1126/science.280.5368.1451. [DOI] [PubMed] [Google Scholar]
- 14.Gruener W., Giegerich R., Schuster P. Analysis of RNA sequence structure maps by exhaustive enumeration I. Neutral networks. Monatsh. Chem. 1996;127:355–374. [Google Scholar]
- 15.Hardison R.C. A brief history of hemoglobins: plant, animal, protist, and bacteria. Proc. Natl. Acad. Sci. USA. 1996;93:5675–5679. doi: 10.1073/pnas.93.12.5675. [DOI] [PMC free article] [PubMed] [Google Scholar]
- 16.Bornberg-Bauer E., Chan H.S. Modeling evolutionary landscapes: mutational stability, topology, and superfunnels in sequence space. Proc. Natl. Acad. Sci. USA. 1999;96:10689–10694. doi: 10.1073/pnas.96.19.10689. [DOI] [PMC free article] [PubMed] [Google Scholar]
- 17.Chan H.S., Bornberg-Bauer E. Perspectives on protein evolution from simple exact models. Appl. Bioinformatics. 2002;1:121–144. [PubMed] [Google Scholar]
- 18.Saks M.E., Sampson J.R., Abelson J. Evolution of a transfer RNA gene through a point mutation in the anticodon. Science. 1998;279:1665–1670. doi: 10.1126/science.279.5357.1665. [DOI] [PubMed] [Google Scholar]
- 19.Dill K.A., Bromberg S., Chan H.S. Principles of protein folding—a perspective from simple exact models. Protein Sci. 1995;4:561–602. doi: 10.1002/pro.5560040401. [DOI] [PMC free article] [PubMed] [Google Scholar]
- 20.Schuster P., Stadler P.F. Discrete models of biopolymers. In: James M., Crabbe C., Konopka A., editors. Handbook of Computational Chemistry and Biology. Marcel Dekker; New York: 2004. pp. 187–221. [Google Scholar]
- 21.Lipman D.J., Wilbur W.J. Modeling neutral and selective evolution of protein folding. Proc. Biol. Sci. 1991;245:7–11. doi: 10.1098/rspb.1991.0081. [DOI] [PubMed] [Google Scholar]
- 22.Gruener W., Giegerich R., Schuster P. Analysis of RNA sequence structure maps by exhaustive enumeration II. Structures of neutral networks and shape space covering. Monatsh. Chem. 1996;127:375–389. [Google Scholar]
- 23.Irbaeck A., Troein C. Enumerating designing sequences in the HP model. J. Biol. Phys. 2002;28:1–15. doi: 10.1023/A:1016225010659. [DOI] [PMC free article] [PubMed] [Google Scholar]
- 24.Berman H.M., Westbrook J., Bourne P.E. The Protein Data Bank. Nucleic Acids Res. 2000;28:235–242. doi: 10.1093/nar/28.1.235. [DOI] [PMC free article] [PubMed] [Google Scholar]
- 25.Ortiz A.R., Strauss C.E.M., Olmea O. MAMMOTH (matching molecular models obtained from theory): an automated method for model comparison. Protein Sci. 2002;11:2606–2621. doi: 10.1110/ps.0215902. [DOI] [PMC free article] [PubMed] [Google Scholar]
- 26.Kedem K., Chew L.P., Elber R. Unit-vector RMS (URMS) as a tool to analyze molecular dynamics trajectories. Proteins. 1999;37:554–564. [PubMed] [Google Scholar]
- 27.Gumbel E. Columbia University Press; New York: 1958. Statistics of Extremes. [Google Scholar]
- 28.Capriotti E., Marti-Renom M.A. RNA structure alignment by a unit-vector approach. Bioinformatics. 2008;24:i112–i118. doi: 10.1093/bioinformatics/btn288. [DOI] [PubMed] [Google Scholar]
- 29.Davidson A.R., Lumb K.J., Sauer R.T. Cooperatively folded proteins in random sequence libraries. Nat. Struct. Biol. 1995;2:856–864. doi: 10.1038/nsb1095-856. [DOI] [PubMed] [Google Scholar]
- 30.Hecht M.H., Das A., Wei Y. De novo proteins from designed combinatorial libraries. Protein Sci. 2004;13:1711–1723. doi: 10.1110/ps.04690804. [DOI] [PMC free article] [PubMed] [Google Scholar]
- 31.Schultes E.A., Spasic A., Bartel D.P. Compact and ordered collapse of randomly generated RNA sequences. Nat. Struct. Mol. Biol. 2005;12:1130–1136. doi: 10.1038/nsmb1014. [DOI] [PubMed] [Google Scholar]
- 32.Thirumalai D., Hyeon C. RNA and protein folding: common themes and variations. Biochemistry. 2005;44:4957–4970. doi: 10.1021/bi047314+. [DOI] [PubMed] [Google Scholar]
- 33.Li H., Helling R., Wingreen N. Emergence of preferred structures in a simple model of protein folding. Science. 1996;273:666–669. doi: 10.1126/science.273.5275.666. [DOI] [PubMed] [Google Scholar]
- 34.Davidson A.R., Sauer R.T. Folded proteins occur frequently in libraries of random amino acid sequences. Proc. Natl. Acad. Sci. USA. 1994;91:2146–2150. doi: 10.1073/pnas.91.6.2146. [DOI] [PMC free article] [PubMed] [Google Scholar]
- 35.Sumedha O.C.M., Martin O.C., Wagner A. New structural variation in evolutionary searches of RNA neutral networks. Biosystems. 2007;90:475–485. doi: 10.1016/j.biosystems.2006.11.007. [DOI] [PubMed] [Google Scholar]
- 36.Ferrada E., Wagner A. Evolutionary innovations and the organization of protein functions in genotype space. PLoS ONE. 2010;5:e14172. doi: 10.1371/journal.pone.0014172. [DOI] [PMC free article] [PubMed] [Google Scholar]
- 37.Wagner A. Robustness and evolvability: a paradox resolved. Proc. Biol. Sci. London. B. 2008;275:91–100. doi: 10.1098/rspb.2007.1137. [DOI] [PMC free article] [PubMed] [Google Scholar]
- 38.Fontana W. Modeling ‘evo-devo’ with RNA. Bioessays. 2002;24:1164–1177. doi: 10.1002/bies.10190. [DOI] [PubMed] [Google Scholar]
- 39.Wagner A. Oxford University Press; Oxford, UK: 2011. The Origins of Evolutionary Innovations: A Theory of Transformative Change in Living Systems. [Google Scholar]
- 40.Chothia C., Lesk A.M. The relation between the divergence of sequence and structure in proteins. EMBO J. 1986;5:823–826. doi: 10.1002/j.1460-2075.1986.tb04288.x. [DOI] [PMC free article] [PubMed] [Google Scholar]
- 41.Prijambada I.D., Yomo T., Urabe I. Solubility of artificial proteins with random sequences. FEBS Lett. 1996;382:21–25. doi: 10.1016/0014-5793(96)00123-8. [DOI] [PubMed] [Google Scholar]
- 42.Camacho C.J., Thirumalai D. Minimum energy compact structures of random sequences of heteropolymers. Phys. Rev. Lett. 1993;71:2505–2508. doi: 10.1103/PhysRevLett.71.2505. [DOI] [PubMed] [Google Scholar]
- 43.Thirumalai D., Woodson S.A. Kinetics of folding of proteins and RNA. Acc. Chem. Res. 1996;29:433–439. [Google Scholar]
- 44.Sander C., Schneider R. Database of homology-derived protein structures and the structural meaning of sequence alignment. Proteins. 1991;9:56–68. doi: 10.1002/prot.340090107. [DOI] [PubMed] [Google Scholar]
- 45.Kauzmann W. Some factors in the interpretation of protein denaturation. Adv. Protein Chem. 1959;14:1–63. doi: 10.1016/s0065-3233(08)60608-7. [DOI] [PubMed] [Google Scholar]
- 46.Riddle D.S., Santiago J.V., Baker D. Functional rapidly folding proteins from simplified amino acid sequences. Nat. Struct. Biol. 1997;4:805–809. doi: 10.1038/nsb1097-805. [DOI] [PubMed] [Google Scholar]
- 47.Reader J.S., Joyce G.F. A ribozyme composed of only two different nucleotides. Nature. 2002;420:841–844. doi: 10.1038/nature01185. [DOI] [PubMed] [Google Scholar]
- 48.Schlosser K., Li Y. DNAzyme-mediated catalysis with only guanosine and cytidine nucleotides. Nucleic Acids Res. 2009;37:413–420. doi: 10.1093/nar/gkn930. [DOI] [PMC free article] [PubMed] [Google Scholar]
- 49.Rogers J., Joyce G.F. A ribozyme that lacks cytidine. Nature. 1999;402:323–325. doi: 10.1038/46335. [DOI] [PubMed] [Google Scholar]
- 50.Qi D., Tann C.M., Distefano M.D. Generation of new enzymes via covalent modification of existing proteins. Chem. Rev. 2001;101:3081–3111. doi: 10.1021/cr000059o. [DOI] [PubMed] [Google Scholar]
- 51.Hendrickson T.L., de Crécy-Lagard V., Schimmel P. Incorporation of nonnatural amino acids into proteins. Annu. Rev. Biochem. 2004;73:147–176. doi: 10.1146/annurev.biochem.73.012803.092429. [DOI] [PubMed] [Google Scholar]
- 52.Cuceanu N.M., Tuplin A., Simmonds P. Evolutionarily conserved RNA secondary structures in coding and non-coding sequences at the 3′ end of the hepatitis G virus/GB-virus C genome. J. Gen. Virol. 2001;82:713–722. doi: 10.1099/0022-1317-82-4-713. [DOI] [PubMed] [Google Scholar]
- 53.Thurner C., Witwer C., Stadler P.F. Conserved RNA secondary structures in Flaviviridae genomes. J. Gen. Virol. 2004;85:1113–1124. doi: 10.1099/vir.0.19462-0. [DOI] [PubMed] [Google Scholar]
- 54.Sharma P., Sharma S., Singh H. Base pairing in RNA structures: a computational analysis of structural aspects and interaction energies. J. Chem. Sci. 2007;119:525–531. [Google Scholar]
- 55.Etchebest C., Benros C., de Brevern A.G. A reduced amino acid alphabet for understanding and designing protein adaptation to mutation. Eur. Biophys. J. 2007;36:1059–1069. doi: 10.1007/s00249-007-0188-5. [DOI] [PubMed] [Google Scholar]
- 56.Murphy L.R., Wallqvist A., Levy R.M. Simplified amino acid alphabets for protein fold recognition and implications for folding. Protein Eng. 2000;13:149–152. doi: 10.1093/protein/13.3.149. [DOI] [PubMed] [Google Scholar]
Associated Data
This section collects any data citations, data availability statements, or supplementary materials included in this article.