

Abstract
Two major classes of small regulatory RNAs—small interfering RNAs (siRNAs) and microRNA (miRNAs)—are involved in a common RNA interference processing pathway. Small RNAs within each of these families were found to compete for limiting amounts of shared components, required for their biogenesis and processing. Association with Argonaute (Ago), the catalytic component of the RNA silencing complex, was suggested as the central mechanistic point in RNA interference machinery competition. Aiming to better understand the competition between small RNAs in the cell, we present a mathematical model and characterize a range of specific cell and experimental parameters affecting the competition. We apply the model to competition between miRNAs and study the change in the expression level of their target genes under a variety of conditions. We show quantitatively that the amount of Ago and miRNAs in the cell are dominant factors contributing greatly to the competition. Interestingly, we observe what to our knowledge is a novel type of competition that takes place when Ago is abundant, by which miRNAs with shared targets compete over them. Furthermore, we use the model to examine different interaction mechanisms that might operate in establishing the miRNA-Ago complexes, mainly those related to their stability and recycling. Our model provides a mathematical framework for future studies of competition effects in regulation mechanisms involving small RNAs.
Introduction
Eukaryotic cells harbor numerous small noncoding RNAs of 20–30 nucleotides in length, which play crucial roles in evolutionarily conserved RNA-mediated gene silencing pathways. Two classes of small RNA molecules, small interfering RNAs (siRNAs) and microRNAs (miRNAs), have been identified as important sequence-specific, post-transcriptional regulators of gene expression. Despite their different classification, both small RNAs are associated with a common RNAi processing pathway, which mainly involves Dicer, an RNase III enzyme, and the RNA-induced silencing complex (RISC). In this process, Dicer cleaves dsRNA and miRNA precursors into small RNA duplexes, of which one of the strands is assembled into RISC to either enhance degradation or inhibit the translation of target RNAs possessing complementary sequences. Members of the Argonaute (Ago) protein family emerged as core components of RISC (1) and were found to establish a minimal functional RISC when associated with small RNAs (2,3).
Several studies have demonstrated that excess amount of exogenously introduced siRNA can saturate the cellular RNAi pathway both in vivo and in vitro. One consequence of such saturation is a competition between different small RNAs in the cell over a fixed pool of shared components required for their processing and biogenesis. This usually results in a drop of efficacy of the small RNAs involved in the competition, evident by an increase in their target gene expression level. This phenomenon was widely reported in in vitro experiments using artificial siRNAs. It was found that simultaneous introduction of two or more artificial siRNAs resulted in reduced gene-silencing activity of one of the siRNAs whereas the other siRNA functioned normally (4–11).
Recently, miRNAs were also suggested to interfere with each other's activity. Genome-wide gene expression analysis after miRNA transfection revealed a statistically significant increase in the expression of target genes of cellular miRNAs, which was attributed to competition over the RNAi pathway's components (12). Moreover, a link between the two classes of small RNAs was found, as saturation of the endogenous RNAi machinery using siRNAs resulted in dysregulation of endogenous miRNA function (12,13). These findings are not surprising considering that miRNA and siRNA pathways share common components. In addition, in all cases the effect was found to be dose-dependent, implying there is a limiting factor in the system (12,13).
Accumulating evidence suggests that the interaction with Ago2, the catalytic component of RISC machinery, is a principal rate-limiting step of the RNAi pathway. It was argued that in several cell types there is limited supply of Ago proteins, limiting their capacity to assemble siRNA/miRNA (8,10,14–17). Interestingly, analysis of the expression profile of Ago proteins in various cell types revealed low levels of Ago2 in liver and lung tissues, in which siRNA and shRNA competition was previously detected (18).
Although the competition effects were broadly discussed, to our knowledge they have not been systematically analyzed using quantitative models. A recent computational study presented statistical analysis of si/miRNA transfection experiments along with a simple linear regression model to predict the effect of competition between miRNAs on individual genes based on the number of miRNA-binding sites they contain (12). Here we present an elaborate model based on rate equations for predicting the global change in gene expression due to competition between various small RNAs. We examine the effect on the transcript level, given that repressing properties of both siRNAs and miRNAs can be largely detected by changes in transcript abundance (19–21). We mainly focus on competition between miRNAs and study the change in the expression level of their target genes. The model provides quantitative results, enabling the examination of the effect of various key parameters of the system on global gene expression.
Methods
Model description
We constructed a mathematical model to quantitatively describe the changes in the expression level of mRNAs due to competition between small RNAs in the cell. A schematic illustration of the model is depicted in Fig. 1 A. The model includes four key components: 1), Free small RNAs of different types, denoted by sj (j = 1,…, Ns, where Ns is the number of small RNA encoding genes). 2), Free mRNAs of different types, denoted by mi (i = 1,…, Nm, where Nm is the number of different mRNA encoding genes). 3), Ago protein, denoted by a. 4), Complexes consisting of small RNAs bound to Ago proteins, denoted by asj. The number of molecules of type x in the cell is denoted by [x] (see Table 1). Note that in this model we assume that Ago, the central catalytic unit of RISC, is the only rate-limiting component. However, we are not arguing that there could not be other limiting factors in the system.
Figure 1.
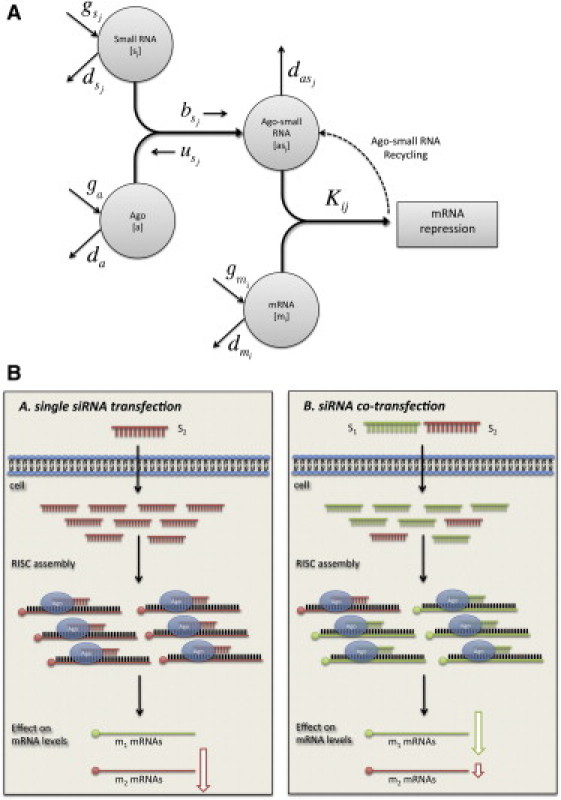
Schematic description of the competition between small RNAs. (A) Schematic drawing showing all variables and parameters used in the model to describe the competition between small RNAs. The model takes into account the copy number of small RNAs, mRNAs, and Ago proteins with specific generation and degradation rate for each. An Ago protein can bind a small RNA to generate an Ago-small RNA complex, depending on the association and dissociation rates between the two. The Ago-small RNA complex can bind mRNA target with specific binding rate and induces mRNA degradation. The Ago-small RNA complex can be degraded after zero or one round of activity or can be recycled and regulate several mRNAs. (B) Schematic drawing of the effect of competition between two cotransfected siRNAs on their single target gene expression levels. When only a single siRNA is transfected (left, s2, red), it binds Ago and downregulates its target gene (m2). When an additional siRNA is cotransfected (right, s1, green), it can saturate the system, hence preventing the other siRNA from binding Ago. As a result, less downregulation of the perturbed siRNA target gene (m2) is expected.
Table 1.
Variables of the mathematical model, where [x] is the number of molecules of type x in the cell
| Name | Description |
|---|---|
| [mi] | mRNA of type i |
| [sj] | Small RNA of type j |
| [a] | Argonaute |
| [asj] | Small RNA of type j bound to Argonaute |
A fundamental assumption of the model is that competition is triggered by excess amount of a single small RNA. We refer to this small RNA as the “trigger” and denote it by s1. The set of target genes of this small RNA is denoted by T. Small RNAs that are affected by the competition (s2,…,sNs) are referred to as the “perturbed” population and their target genes are defined as set P. The mRNAs that are not regulated by either the trigger or the perturbed small RNAs form a background group, and are defined as set B. mRNA targets are often regulated by several small RNAs (e.g., several miRNAs). Therefore, it is likely that some of the mRNA targets of the trigger small RNA will also be targets of the perturbed small RNAs. We denoted this set of common mRNA targets of both the trigger and perturbed small RNAs by C. Mathematically, this set is given by C = T ∩ P. In some cases we need to consider those targets of the perturbed small RNAs that are not targets of the trigger small RNA. The set of these mRNAs that are targeted only by the perturbed small RNAs was denoted by P′ (P′ = P−T).
The processes included in our model are summarized in Table S2 in the Supporting Material. Each type of molecule in the system is generated at rate g and is degraded at rate d. Although the generation and degradation are complex processes that include many intermediate steps for each type of molecule, we obtained a concise model by collapsing the many steps into a single step. The parameters gsj (s−1) and dsj (s−1) are the generation and degradation rates of small RNA j, respectively. Similarly, gmi (s−1) and dmi (s−1) are the generation and degradation rates of mRNA i, respectively. And finally, the parameters ga(s−1) and da(s−1) are the generation and degradation rates of the Ago proteins.
In addition, small RNAs in the cell can bind to Ago protein to create Ago-small RNA complex asj with association rate bj(s−1). This complex may dissociate to its original components with dissociation rate uj(s−1). A value of zero to uj implies that once a small RNA is loaded onto Ago it forms a stable complex that does not dissociate. The Ago-small RNA complex degrades at a rate denoted by dasj (s−1). Once assembled, the Ago-small RNA complex asj may bind to an mRNA target mi and induce mRNA degradation. Of particular importance is the binding rate matrix K. This is a matrix of dimensions Nm × Ns. Its matrix element Kij, i = 1,…,Nm, j = 1,…,Ns, represents the binding rate of the Ago-sRNA complex asj to the target mRNA mi. In case that Kij = 0, it implies that the mRNA mi is not a target of the small RNA sj. Typical values of the parameters used in our analysis are presented in Table S2.
We distinguished between two possibilities of RISC action. According to the first one, RISC can act only once on an mRNA, thereby the Ago-small RNA complex degrades together with its mRNA target. In this case, the effective rate coefficient accounting for the removal of the Ago-small RNA complex asj due to the interaction with its mRNA target mi is Kij′ = Kij. However, recent studies suggested that RISC is a multiple-turnover enzyme (22–25), implying that a small RNA can remain associated with the complex and carry out multiple rounds of RNA degradation. To account for this possibility, we allowed also the Ago-small RNA complex to interact with several mRNA targets before it degrades. Allowing the Ago-small RNA complex to act on average n times on mRNA targets, the rate coefficient of its removal due to the interaction with its targets is given by Kij′ = Kij/n.
The model we propose is an extension of previous models for the regulation by small RNAs (26–28). The model can be formulated quantitatively using rate equations. Rate equations are ordinary differential equations that account for the temporal variation in the concentrations of different molecules in the system. Our system can be described by the following set of rate equations:
| (1) |
In these equations, terms of the form gx account for the generation of molecule x, and terms of the form dx[x] account for the degradation of molecules x. The bj[sj][a] term accounts for the binding of small RNAs and Ago, forming an Ago-small RNA complex and uj[asj] for the dissociation of this complex. The interaction between the Ago-small RNA complex and its mRNA targets is accounted for by K′ij[mi][asj].
Analysis of the model
We used the model to investigate the change in gene expression level of mRNA after overexpression of the trigger small RNA. Rate equations (Eq. 1) were numerically integrated twice: First, we integrated the equations without the small RNA s1 that triggered the competition (its generation rate was set to zero or to a small value), and recorded the mRNA level after a period of a day, which we denote by [m1i]. The period of one day was chosen according to the experimental procedures. It should be noted that the rate equations do not always converge to steady state in such a period. In any case, the results obtained after one day are those that should be used for comparison with the experiment. The simulations were repeated several times with different initial conditions. It was found that the results do not depend on the choice of the initial conditions in any significant way. Second, we integrated the equations with the small RNA that triggered the competition (its production rate was set to some value gs1), and recorded the mRNA level also after a day, which we denote by [m2i]. Finally, we calculated the logarithm of the ratio of the mRNA level in the two runs. This is the log fold-change in expression after the perturbation by the trigger:
| (2) |
The rate equations are deterministic, and do not account for noise and fluctuations. However, biological systems are continuously challenged by variable environments, and noise is an important feature of living cells (29,30). In our system, noise in gene expression level may play an important role because it can mask the downregulation or upregulation effects. Additionally, noise should be considered for creating a population of mRNA levels for the background genes (B set), as the deterministic equations result in the same value for all genes in the set. Noise was considered by changing the generation rates between the two runs, multiplying it by 1 + ε, where ε denotes a small random number chosen from a normal distribution with a zero mean. The width of the distribution was adjusted so that the log ratio distribution for background genes will be similar to that observed in small RNA transfection experiments (12).
In addition to this treatment of noise, which corresponds to extrinsic noise, we also performed Monte Carlo simulations using the Gillespie algorithm (31,32) for a smaller set of small RNAs and mRNAs. These simulations, which take into account the intrinsic noise in a more rigorous way, yielded similar results to the ones obtained from the rate equations with added noise (data not shown). It is likely that both types of noise, extrinsic and intrinsic, exist in the experimental system, and it is not clear which one is more dominant. We chose to present the results of the rate equations with added noise through the parameter values (modeling extrinsic noise) because this method enables us to deal with much larger networks (corresponding to the size of the experimental network) and to obtain better statistics.
Gene expression data
Lim et al. (33) performed microarray experiments in human cells at 12 or 24 h after transfection with hsa-miR-124. Gene expression data were retrieved from the NCBI Gene Expression Omnibus (34) with accession No. GSE2075.
Results
We have constructed a mathematical model that enables systematic and quantitative analysis of the changes in gene expression due to competition between small RNAs. The system we study includes a single small RNA whose excess amount triggers the competition (the trigger) and a population of small RNAs that are perturbed due to the competition (perturbed small RNAs). The effect of the competition is examined via the change in expression level (log ratio) of the sets of target genes of the trigger and perturbed small RNAs (see Methods). The set of target genes of the trigger small RNA is denoted by T. The set of targets of the perturbed small RNAs is denoted by P. Note that there may be targets that are shared by the trigger and perturbed small RNAs. The set of these common targets is denoted by C, while the set of genes that are targets only of the perturbed small RNAs and not of the trigger small RNA is denoted by P′. The set of background genes that are not regulated by any small RNA is denoted by B.
We expect to observe downregulation of the target genes of the trigger (T set), upregulation of the target genes of the perturbed small RNAs (P′ set), and no effect, only noise, for background genes that are not targets of any small RNA (B set). The downregulation is a direct result of the effect of the trigger small RNA. The upregulation is a secondary effect mediated by the competition, because the effect of cellular small RNAs is reduced and downregulation of their targets is not as effective as before the perturbation.
Minimalistic system: competition between two small RNAs
It is informative to start exploring the system using a restricted number of variables. To this end we limited the system, which may include hundreds of small RNAs and thousands of mRNA targets, to only two types of small RNAs: one trigger small RNA (s1) and one perturbed small RNA (s2), each one with a single mRNA target (m1 and m2, respectively). In this case, the sets T and P consist of only one element each, namely T = {m1} and P = {m2}. We refer to this system as minimalistic and examine it under different conditions. Interestingly, this model describes the competition between two cotransfected siRNAs, given that both siRNAs are ideally target-specific and regulate only a single target gene. We examined the change in the expression levels of m1 and m2 due to the addition of the trigger siRNA (Fig. 2). We found that increasing the transcription rate of s1 leads to a stronger downregulation of its target gene (m1) and to a stronger upregulation of the target gene (m2) of the perturbed small RNA (Fig. 2). These results indicate that the proposed minimalistic model captures the experimentally observed upregulation of the target gene of the perturbed small RNA.
Figure 2.
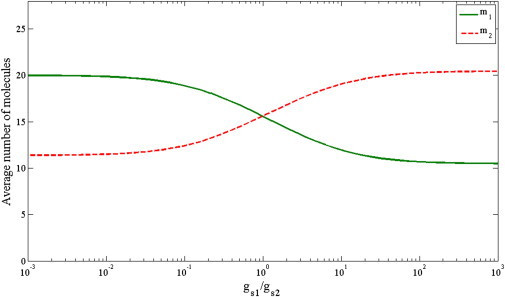
Results for a minimalistic model of two competing small RNAs. In this minimal model, each small RNA has one target mRNA. Shown are the average numbers of target mRNA molecules as a function of the ratio of the generation rates of the small RNAs controlling them (X axis in log scale). As the generation rate of the trigger s1 increases, the level of its target mRNA m1 decreases, whereas the level of the perturbed mRNA m2 increases.
Extended system: competition between a large number of miRNAs
We now extend the model to include several small RNAs with many target genes, focusing on miRNAs. Biologically, because miRNAs are known to target multiple genes, the extended model is capable of describing the competition between miRNAs. As a first validation step, we compared the output of this model to microarray expression data from miRNA transfection experiments. These experiments were previously used to demonstrate the competition exerted by transfection of exogenous miRNAs (12). Here, we demonstrate the results for hsa-miR-124. Microarray data of the change in gene expression after transfection (log10 ratio) were obtained from Lim et al. (33), and divided into the three sets (T, P′, and B) based on Khan et al. (12) and Lewis et al. (35) (see Table S1). The binding rate matrix K was adjusted based on the gene classification. The parameters of the miRNAs and their target genes were taken from Table S2. However, we had to account for the noise in the system and for the fact that different genes exhibit different dynamical parameters. To this end, in each run of the simulation the parameters of each miRNA and each target gene were drawn from log-normal distributions, whose mean values were taken from Table S2, and their widths were used as fitting parameters (for more details, see the section on parameter values in the Supporting Material).
We compared the model results to the experimental data. In Fig. 3 A, we present histograms of log mRNA expression ratio for the T, P′, and B sets. The shape of the histogram, the average log-ratio, and the expected trend of gene expression changes are consistent with the experimental data. The B set is distributed symmetrically around zero, the T set is downregulated, and the P′ set is upregulated (Fig. 3 A). The differences between the distributions are statistically significant (Fig. 3 B). These results are in very good agreement with the results of hsa-miR-124 transfection performed by Lim et al. (33). We also applied the same analysis to other miRNA transfection experiments and obtained similar qualitative results.
Figure 3.
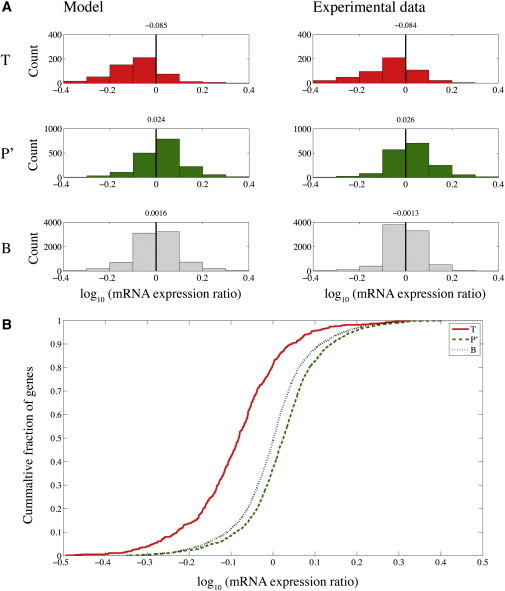
Transfection of miRNA results in downregulation of its targets and upregulation of targets of endogenous miRNAs, due to competition for Ago binding. The model captures the principal characteristics of the competition. (A) Histograms of log expression fold change, defined in Eq. 2, for transfection experiment of hsa-miR-124 (right) and model (left). Changes in expression in three sets of genes are presented: T, targets of trigger miRNA (top panel), P′, targets of perturbed miRNAs (middle panel, only targets that do not overlap T targets are included), and B, background (bottom panel, genes that are not targets of either miRNA). The average log mRNA expression ratio is presented above each histogram. (B) Cumulative distribution function for T, P′, and B sets produced by the model. The plot shows statistically significant downregulation by Kolmogorov-Smirnov test of T set (p-value = 10−51) and statistically significant upregulation of P′ set (p-value = 10−27) relative to the B set.
The downregulation of the targets of the trigger miRNA is a direct effect of the transfection, whereas the upregulation of the targets of the perturbed miRNAs is an indirect effect, which is mediated by the competition for a limited supply of Ago proteins. For the parameters examined, the direct effect appears to be stronger than the indirect effect, in agreement with the experimental results.
The effect of cell-specific parameters and experiment-specific parameters
To quantitatively evaluate the effect of different parameters on competition between miRNAs, we altered the level of each parameter in the system while fixing all other parameters. We focused on two key factors: the amount of trigger miRNA and the amount of Ago in the cell. In addition, we examined the effect of changes in the amount of mRNAs, as well as the effect of different features regarding the Ago-miR complex, such as its dissociation rate and possible turnover. For each set of target genes, we examined the number of downregulated and upregulated genes following the transfection of trigger miRNA with respect to the reference state in which there is no trigger miRNA. We define fD as the fraction of downregulated genes and fU as the fraction of upregulated genes in a target set, such that fU + fD = 1. We define
| (3) |
as a measure of the general trend of regulation within a set of target genes. A positive value of Δ implies that most genes in the set are upregulated, whereas a negative value implies that most genes are downregulated. The dependence of Δ on the transcription rates of the trigger and perturbed miRNAs, as well as on the synthesis rate of the Ago molecules, was examined in detail. The calculated values of Δ presented in the article were obtained by averaging over 10 realizations for each set of parameters.
The generation rate of the trigger miRNA
We first tested how the amount of the trigger miRNA affects the results. We focused on the generation rather than the degradation rate, because it was previously shown to be the more relevant parameter for this analysis (22,26,36). The generation rate of the trigger miRNA is characterized as high or low by comparison to the total generation rate of all perturbed miRNAs. As expected, higher generation rate and thereby higher amounts of trigger miRNA resulted in a stronger competition (Fig. 4). For a small amount of the trigger miRNA we observed almost no effect. The value of Δ obtained for the T and P′ groups was close to zero. This implies that in our model, in the limit of vanishing amount of trigger miRNA, half of the target genes are upregulated and half are downregulated, indicating that the upregulation and downregulation are dominated by noise. As the generation rate of trigger increased, and hence the amount of the trigger increased, a stronger effect was detected for both the T and the P′ groups. The T genes were mostly downregulated, leading to Δ < 0 whereas the P′ genes were mostly upregulated, yielding Δ > 0. Both effects saturate when the trigger miRNA reaches a sufficiently high generation rate and hence a sufficiently high level. Notably, the upregulation of the P′ genes saturates at Δ = 0.6, which means that only 80% of the P′ genes are upregulated and 20% are downregulated. The downregulation of the T genes saturates at Δ = 0, which means that nearly 100% of the T genes are downregulated.
Figure 4.
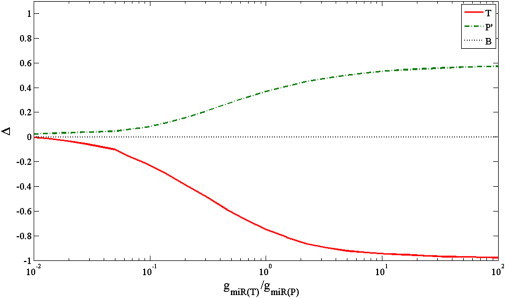
Effect of the trigger miRNA generation rate on the expression level of T, P′, and B gene sets. The X axis is the ratio between the generation rates of trigger miRNA and total perturbed miRNAs (miR-T/miR-P, log scale). The Y axis shows the change in expression level as represented by Δ, the difference between the fractions of upregulated and downregulated genes in a set. The background genes show Δ of zero, as their fractions of upregulated and downregulated genes are equal. As the generation rate of the trigger increases, more of its target genes (T) are downregulated (Δ < 0), and more of the perturbed target genes (P′) are upregulated (Δ > 0). For a very large amount of trigger, all of its target genes are downregulated, whereas the upregulation of the perturbed target genes saturates at a lower level. The results are based on averaging 10 runs, where the generation rate of Ago was equal to the total generation rate of the perturbed miRNAs.
The synthesis rate of Ago molecules
Next, we examined the downregulation and upregulation effects as functions of the synthesis rate of the Ago molecules (Fig. 5 A). As before, the generation rate of Ago was determined relatively to the total generation rate of all the perturbed miRNAs. When only a small amount of Ago is present, the miRNA regulation pathway is suppressed, and thus the system is not affected by the trigger miRNA. As a result, both T genes and P′ genes are not downregulated or upregulated after the transfection of the trigger miRNA (Δ ≈ 0). An increase in the level of Ago leads to elevated miRNA activity and stronger downregulation of the T genes (Δ < 0). Consequently, the competition for Ago rises, leading to upregulation of the P′ genes (Δ > 0). Finally, with Ago amounts sufficient to repress both T and P′ genes, the competition decreases and subsequently the upregulation of P′ genes decreases.
Figure 5.
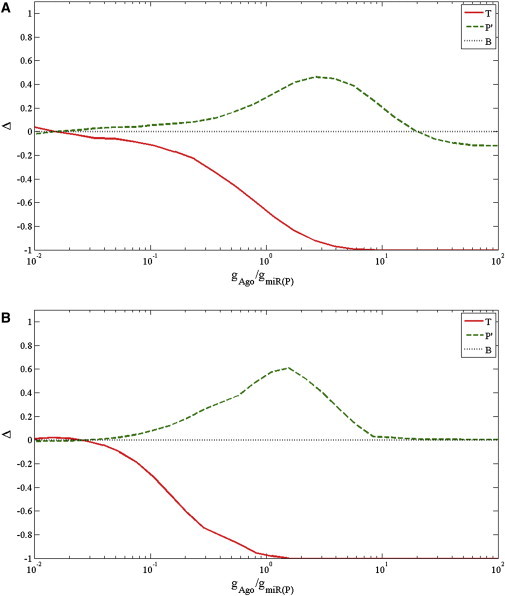
Effect of Ago generation rate on the expression level of T, P′, and B groups. The X axis shows the ratio between Ago generation rate and the generation rate of total perturbed miRNAs (Ago/miR-P, log scale). The Y axis shows the change in expression level as represented by Δ, the difference between the fractions of upregulated and downregulated genes in a set. (A) As the amount of Ago increases, more trigger target genes (T) are downregulated (Δ < 0). For the perturbed target genes (P′), increasing the Ago amount first leads to upregulation (Δ > 0), but at some point the upregulation become less dominant and even turns to downregulation (Δ < 0). The results are based on averaging 10 runs with miR-T/miR-P = 1. (B) Results of simulations that did not include the common target genes of the perturbed and trigger miRNAs. Excluding the common target genes from the simulation abolished the observed downregulation of the perturbed targets genes (P′) under high Ago amounts. Thus, the phenomenon observed in panel A is due to competition on targets between the trigger and perturbed miRNAs under high Ago amount. When the level of trigger miRNA is high it targets the common targets, while the endogenous miRNAs are free to target additional mRNAs, resulting in overall downregulation of their targets.
Naively, one would expect that under an extremely large amount of Ago, noise should dominate and Δ should tend to zero for the P′ genes. However, we find that the value of Δ for the P′ group drops below zero in this limit, which indicates that more genes are downregulated than upregulated. This surprising result can be explained by what to our knowledge is a novel type of competition that takes place when Ago proteins are highly abundant. Under these conditions, the common target genes of the trigger and perturbed miRNAs (C group), which were regulated by the perturbed miRNAs before the transfection, switched their regulators to the trigger miRNA. Once the perturbed miRNAs became free they could regulate their other targets, hence the overall number of repressed P′ genes increased. To verify this hypothesis, we repeated the simulation under conditions in which the C genes are removed from the network. Indeed we found that removing these genes from the simulation abolished the downregulation of the P′ genes (Fig. 5 B). Taken together, our findings reveal that with sufficient amount of Ago, the competition turns out to be competition for target genes rather than for Ago.
In addition, we studied the effect of Ago amount for different amounts of trigger miRNA (see Fig. S1 in the Supporting Material). For increasing amounts of the trigger we obtained two major results: First, the height of the peak rises but eventually saturates as already observed in Fig. 4. A Higher peak implies stronger competition, as is expected when using a higher level of trigger. Second, the width of the peak is broadened, even when the height saturates. The broadening indicates that for a large amount of trigger miRNA, the competition takes place for a broader range of Ago amounts.
Generation and degradation rates of mRNAs
We examined the dependence of the downregulation of the T genes and the competition-induced upregulation of the P′ genes on the generation rate and degradation rate of these target mRNAs. It was found that increasing the generation rate or decreasing the degradation rate of T genes resulted in reduced downregulation (37,38). The results of our simulations reproduce this effect. However, we find that changing the parameters of the T genes has little effect on the expression levels of the P′ genes. This is due to the fact that the regulation of the P′ genes is mainly affected by the competition between the trigger and perturbed miRNAs for the limited supply of Ago proteins.
Stability and recycling of the Ago-miRNA complex
Although the miRNA pathway has been widely investigated, the interaction mechanisms between miRNAs, their target RNAs, and Ago are only poorly characterized. We used our model to examine several unknown parameters in the context of the competition between miRNAs for a limited supply of Ago proteins.
First, we examined the effect of the stability of the Ago-miRNA complex. To this end, we varied the rate of dissociation of the Ago-miRNA complex. Within the biologically relevant range of parameters, it was found that the results are not sensitive to this dissociation rate. In principle, the dissociation of the Ago-miRNA complex may reduce the strength of the regulation, because it lowers the number of available complexes. However, it turns out that under biologically relevant conditions in which the concentration of mRNA targets is sufficiently large, it is unlikely that the Ago-miRNA complex will dissociate before it binds another mRNA target. We expect that in the limits of very fast dissociation or very low concentration of target mRNAs, the dissociation would indeed lower the strength of the post-transcriptional regulation.
Second, we examined the ability of the Ago-miRNA complex to bind multiple times to target mRNAs. The fate of the Ago-miRNA complex after it acts on a single mRNA molecule is still unknown. It may degrade or become inactive, or still be available in the cells. We examined the upregulation effect as a function of the number of times the Ago-miRNA complex can act on mRNA molecules (see Fig. S2). Our simulations revealed that if the miRNA remains associated with Ago and carries out multiple rounds of RNA degradation, the upregulation effect becomes stronger and is present also for a lower amount of Ago in the cell. This result is biologically reasonable, because if Ago can be used more than once, then a lower amount of Ago is sufficient to perform the same task. In fact, the recycling involves not only the Ago proteins but also the small RNAs. Therefore, enhancement of the recycling is somewhat analogous to increasing the synthesis rate of both the Ago molecules and the small RNAs. In principle, it could be that the level of recycling differs between different small RNAs. Thus, only the small RNAs that are recycled are likely to exhibit such enhanced regulation capability.
Discussion
Several studies supported the idea of competition between small RNAs, but quantitative aspects of this mechanism were not yet put forward. We presented here a mathematical model describing the changes in expression level of mRNAs due to competition between small RNAs. We first showed that a simple system that includes Ago as the only limiting factor and two small RNAs with one target gene for each could explain the observed upregulation of perturbed target genes. Notably, this model can be used to represent competition between two cotransfected siRNAs. In addition, we used an extended system including multiple small RNAs and multiple target genes, to investigate competition between miRNAs. Here, we focus in particular on competition between miRNAs due to overexpression of a single miRNA trigger.
Competition between miRNAs has been previously reported to occur due to transfection of exogenous miRNA, but it may occur also naturally. Such competition can theoretically result from infection of viruses that encode their own miRNAs. Recent findings revealed that certain viruses (mostly members of the herpesvirus and polyomavirus families) encode miRNAs, which appear to play roles in infection (39–41). Exogenous viral miRNAs have the ability to exploit the cellular miRNA pathway in a similar way to transfected miRNA. Indeed, human Adenovirus VA RNA-derived miRNAs were found to subvert the cellular miRNA pathway by successfully competing for central miRNA pathway components (42,43). Competition can occur also due to endogenous miRNA aberrant expression, as in cancer cells that overexpress a specific endogenous miRNA or a series of miRNAs (reviewed in Esquela-Kerscher and Slack (44)). The model presented in this study is general and relevant to any of these biological conditions.
The model provides several fundamental principles that should be taken into account when investigating miRNAs and the competition among them. First, we showed that elevated levels of the trigger miRNA enhance the competition and result in impairment of other cellular miRNAs, as indicated by a stronger upregulation of their target gene levels. Second, we showed that Ago as the single rate-limiting factor is a critical key player in the competition. Competition occurs in a specific range of Ago amounts, when its cellular level is not particularly low or particularly high. In this range, as expected, the lower the Ago amount is, the stronger is the competition. These results suggest that cellular high Ago level is an important factor for preventing competition effect in any cell, biological condition, or experimental procedure. Our simulation can be used to estimate the proper level of Ago that is needed for avoiding competition, considering the level of the trigger and perturbed miRNAs in the cell. Likewise, for a given amount of Ago in the cell, our model can be used to predict the amount of miRNAs required for achieving a certain effect. Furthermore, the strong dependence of the system's behavior on Ago and miRNA amounts indicates that it is cell- and condition-dependent. Therefore, conclusions based on gene expression change after cotransfection of two or more miRNAs in a given cell should be taken with caution when extrapolated to other cell types.
Interestingly, our model revealed what to our knowledge is a novel type of competition that prevails when high Ago amounts are present in the system. Theoretically, when Ago is abundant, the trigger miRNA should have no effect on the other miRNAs and on the expression level of their target genes. However, our model predicted that under high enough amounts of Ago, a substantial fraction of the perturbed miRNA target genes are downregulated. Further examination revealed that the effect is mediated through a specific set of target genes, which contain miRNA-binding sites for both the trigger and at least one of the perturbed miRNAs. Hence, we suggest that these common targets switch their regulators, from the perturbed miRNAs to the trigger miRNA. As a result, the perturbed miRNAs are free to regulate other target genes that were not regulated before.
We further used the model to investigate the poorly understood interaction properties between miRNAs and Ago. Specifically, we focused on the recycling and stability properties of the complex. Recent articles reported that RISC acts as a multiple-turnover enzyme that catalyzes multiple rounds of RNA cleavage (22–25). However, little is known about the details of the recycling mechanism. Here we asked how the competition would be affected under different numbers of recycling rounds. The results indicated that recycling of Ago creates beneficial conditions for competition in the cell. For example, for high number of recycling rounds, competition was found to exist even for very low amounts of Ago, and the effect of competition was found to be stronger than in the case in which Ago is not recycled.
Additionally, we examined how Ago-miRNA complex stability affects the competition outcome. To our knowledge, no reliable data for the turnover or lifetime of an Ago-miRNA complex are currently available. The common assumption is that the complex is highly stable and that Ago protects the bound miRNAs from degradation (45). However, because Ago and the miRNA are not covalently bound, disassembly of the complex can theoretically occur. Interestingly, under our examined range of dissociation rates, we did not observe any change in the competition outcome. Despite these results, it is possible that the dissociation rate does have a significant effect, but only under highly extreme dissociation values.
During our modeling process and analysis, we have made two fundamental assumptions. Each of these assumptions can be altered to further expand the model in future studies: 1), We assumed that the model describes competition between small RNAs in eukaryotes. However, competition between small RNAs was recently found to occur also in Escherichia coli. The RNA chaperone Hfq was reported as the limiting factor in the system (46). Hfq is required for the activity of many small regulatory RNAs in bacteria. It stabilizes the small RNAs and mediates their interaction with their target mRNAs (47). Our model can be easily adjusted to study competition between small RNAs in bacteria. 2), Based on previous studies, the model considers the binding to Ago as the main rate-limiting step of the system (8,10,14,16,17). It is very likely that other miRNA biogenesis machinery components, such as Dicer and Exportin-5, can serve as limiting factors as well (48,49). Both Dicer and Exportin-5 can yield competition through the miRNA biogenesis pathway, so that more trigger miRNAs but fewer perturbed miRNAs are produced. Ago, in contrast, yields competition that affects the functionality of the miRNA, thus the biogenesis pathway remains undisturbed and the same amounts of perturbed miRNAs are produced. Nevertheless, the miRNAs cannot assemble to Ago and cannot regulate their target genes. Here, we decided to construct a simplified model that includes only Ago as the limiting factor, because it can create a better understanding of the basic key parameters of the system. Further extension of the model regarding other machinery components can be implemented based on this initial study.
The modeling provides a systematic analysis of the effects of the transfection of trigger miRNA. It provides a mathematical and conceptual framework in which a large number of experimental results can be combined and understood on a common basis. The model enables us to test both the qualitative features and the magnitude of the response of different targets and its dependence on the number of Ago molecules and other conditions. The modeling also enables us to identify the range of parameters in which the effect takes place. In general, using this modeling approach one can examine the effect of different microscopic features on measured quantities and formulate predictions for future experiments. In some cases, it also leads to unexpected results and insight. This is, in fact, the case with our observation that under conditions in which the Ago molecules are highly abundant, the transfection of trigger miRNA causes a decrease in the expression level not only of its own target genes but also in genes that are targets of endogenous miRNAs. This is due to the fact that the trigger miRNAs bind to those targets that are common to the trigger and endogenous miRNAs. This enables the other miRNAs to focus on their own specific targets and lower their expression level.
In summary, the mathematical model presented in this study suggests a complementary view and a system-level understanding of the effect of competition over miRNA pathway components on the target mRNA levels. Although the precise mechanistic details of this competition remain to be established, the model provides what to our knowledge is a novel insight as well as predicted effects attributed to the change in key parameters of the system.
Acknowledgments
We thank Yael Altuvia for helpful discussions.
This work was supported by the US-Israel Binational Science Foundation and the Israel Cancer Research Fund (H.M.) and by the France-Israel Research Network Program (H.M. and O.B.).
Supporting Material
References
- 1.Peters L., Meister G. Argonaute proteins: mediators of RNA silencing. Mol. Cell. 2007;26:611–623. doi: 10.1016/j.molcel.2007.05.001. [DOI] [PubMed] [Google Scholar]
- 2.Rivas F.V., Tolia N.H., Joshua-Tor L. Purified Argonaute2 and an siRNA form recombinant human RISC. Nat. Struct. Mol. Biol. 2005;12:340–349. doi: 10.1038/nsmb918. [DOI] [PubMed] [Google Scholar]
- 3.Liu J., Carmell M.A., Hannon G.J. Argonaute2 is the catalytic engine of mammalian RNAi. Science. 2004;305:1437–1441. doi: 10.1126/science.1102513. [DOI] [PubMed] [Google Scholar]
- 4.McManus M.T., Haines B.B., Sharp P.A. Small interfering RNA-mediated gene silencing in T lymphocytes. J. Immunol. 2002;169:5754–5760. doi: 10.4049/jimmunol.169.10.5754. [DOI] [PubMed] [Google Scholar]
- 5.Hutvágner G., Simard M.J., Zamore P.D. Sequence-specific inhibition of small RNA function. PLoS Biol. 2004;2:E98. doi: 10.1371/journal.pbio.0020098. [DOI] [PMC free article] [PubMed] [Google Scholar]
- 6.Bitko V., Musiyenko A., Barik S. Inhibition of respiratory viruses by nasally administered siRNA. Nat. Med. 2005;11:50–55. doi: 10.1038/nm1164. [DOI] [PubMed] [Google Scholar]
- 7.Formstecher E., Reverdy C., Colland F. Combination of active and inactive siRNA targeting the mitotic kinesin Eg5 impairs silencing efficiency in several cancer cell lines. Oligonucleotides. 2006;16:387–394. doi: 10.1089/oli.2006.16.387. [DOI] [PubMed] [Google Scholar]
- 8.Koller E., Propp S., Dean N.M. Competition for RISC binding predicts in vitro potency of siRNA. Nucleic Acids Res. 2006;34:4467–4476. doi: 10.1093/nar/gkl589. [DOI] [PMC free article] [PubMed] [Google Scholar]
- 9.Stierlé V., Laigle A., Jollès B. Modulation of the efficiency of a siRNA directed against MDR1 expression in MCF7-R cells when combined with a second siRNA. Biochimie. 2007;89:1033–1036. doi: 10.1016/j.biochi.2007.03.011. [DOI] [PubMed] [Google Scholar]
- 10.Castanotto D., Sakurai K., Rossi J.J. Combinatorial delivery of small interfering RNAs reduces RNAi efficacy by selective incorporation into RISC. Nucleic Acids Res. 2007;35:5154–5164. doi: 10.1093/nar/gkm543. [DOI] [PMC free article] [PubMed] [Google Scholar]
- 11.Holen T., Amarzguioui M., Prydz H. Similar behavior of single-strand and double-strand siRNAs suggests they act through a common RNAi pathway. Nucleic Acids Res. 2003;31:2401–2407. doi: 10.1093/nar/gkg338. [DOI] [PMC free article] [PubMed] [Google Scholar]
- 12.Khan A.A., Betel D., Marks D.S. Transfection of small RNAs globally perturbs gene regulation by endogenous microRNAs. Nat. Biotechnol. 2009;27:549–555. doi: 10.1038/nbt.1543. [DOI] [PMC free article] [PubMed] [Google Scholar]
- 13.Grimm D., Streetz K.L., Kay M.A. Fatality in mice due to oversaturation of cellular microRNA/short hairpin RNA pathways. Nature. 2006;441:537–541. doi: 10.1038/nature04791. [DOI] [PubMed] [Google Scholar]
- 14.Vickers T.A., Lima W.F., Crooke S.T. Reduced levels of Ago2 expression result in increased siRNA competition in mammalian cells. Nucleic Acids Res. 2007;35:6598–6610. doi: 10.1093/nar/gkm663. [DOI] [PMC free article] [PubMed] [Google Scholar]
- 15.Li X., Yoo J.W., Lee D.K. Identification of sequence features that predict competition potency of siRNAs. Biochem. Biophys. Res. Commun. 2010;398:92–97. doi: 10.1016/j.bbrc.2010.06.041. [DOI] [PubMed] [Google Scholar]
- 16.Yoo J.W., Kim S., Lee D.K. Competition potency of siRNA is specified by the 5′-half sequence of the guide strand. Biochem. Biophys. Res. Commun. 2008;367:78–83. doi: 10.1016/j.bbrc.2007.12.099. [DOI] [PubMed] [Google Scholar]
- 17.Tanudji M., Machalek D., Rivory L. Competition between siRNA duplexes: impact of RNA-induced silencing complex loading efficiency and comparison between conventional-21 bp and Dicer-substrate siRNAs. Oligonucleotides. 2010;20:27–32. doi: 10.1089/oli.2009.0195. [DOI] [PubMed] [Google Scholar]
- 18.Sasaki T., Shiohama A., Shimizu N. Identification of eight members of the Argonaute family in the human genome small star, filled. Genomics. 2003;82:323–330. doi: 10.1016/s0888-7543(03)00129-0. [DOI] [PubMed] [Google Scholar]
- 19.Elbashir S.M., Harborth J., Tuschl T. Duplexes of 21-nucleotide RNAs mediate RNA interference in cultured mammalian cells. Nature. 2001;411:494–498. doi: 10.1038/35078107. [DOI] [PubMed] [Google Scholar]
- 20.Hendrickson D.G., Hogan D.J., Brown P.O. Concordant regulation of translation and mRNA abundance for hundreds of targets of a human microRNA. PLoS Biol. 2009;7:e1000238. doi: 10.1371/journal.pbio.1000238. [DOI] [PMC free article] [PubMed] [Google Scholar]
- 21.Guo H., Ingolia N.T., Bartel D.P. Mammalian microRNAs predominantly act to decrease target mRNA levels. Nature. 2010;466:835–840. doi: 10.1038/nature09267. [DOI] [PMC free article] [PubMed] [Google Scholar]
- 22.Filipowicz W. RNAi: the nuts and bolts of the RISC machine. Cell. 2005;122:17–20. doi: 10.1016/j.cell.2005.06.023. [DOI] [PubMed] [Google Scholar]
- 23.Filipowicz W., Jaskiewicz L., Pillai R.S. Post-transcriptional gene silencing by siRNAs and miRNAs. Curr. Opin. Struct. Biol. 2005;15:331–341. doi: 10.1016/j.sbi.2005.05.006. [DOI] [PubMed] [Google Scholar]
- 24.Hutvágner G., Zamore P.D. A microRNA in a multiple-turnover RNAi enzyme complex. Science. 2002;297:2056–2060. doi: 10.1126/science.1073827. [DOI] [PubMed] [Google Scholar]
- 25.Haley B., Zamore P.D. Kinetic analysis of the RNAi enzyme complex. Nat. Struct. Mol. Biol. 2004;11:599–606. doi: 10.1038/nsmb780. [DOI] [PubMed] [Google Scholar]
- 26.Levine E., Zhang Z., Hwa T. Quantitative characteristics of gene regulation by small RNA. PLoS Biol. 2007;5:e229. doi: 10.1371/journal.pbio.0050229. [DOI] [PMC free article] [PubMed] [Google Scholar]
- 27.Shimoni Y., Friedlander G., Margalit H. Regulation of gene expression by small non-coding RNAs: a quantitative view. Mol. Syst. Biol. 2007;3:138. doi: 10.1038/msb4100181. [DOI] [PMC free article] [PubMed] [Google Scholar]
- 28.Mehta P., Goyal S., Wingreen N.S. A quantitative comparison of sRNA-based and protein-based gene regulation. Mol. Syst. Biol. 2008;4:221. doi: 10.1038/msb.2008.58. [DOI] [PMC free article] [PubMed] [Google Scholar]
- 29.Elowitz M.B., Levine A.J., Swain P.S. Stochastic gene expression in a single cell. Science. 2002;297:1183–1186. doi: 10.1126/science.1070919. [DOI] [PubMed] [Google Scholar]
- 30.Swain P.S., Elowitz M.B., Siggia E.D. Intrinsic and extrinsic contributions to stochasticity in gene expression. Proc. Natl. Acad. Sci. USA. 2002;99:12795–12800. doi: 10.1073/pnas.162041399. [DOI] [PMC free article] [PubMed] [Google Scholar]
- 31.Gillespie D. Exact stochastic simulation of coupled chemical reactions. J. Phys. Chem. 1977;81:2340–2361. [Google Scholar]
- 32.Gillespie D. A general method for numerically simulating the stochastic time evolution of coupled chemical reactions. J. Comput. Phys. 1976;22:403–434. [Google Scholar]
- 33.Lim L.P., Lau N.C., Johnson J.M. Microarray analysis shows that some microRNAs downregulate large numbers of target mRNAs. Nature. 2005;433:769–773. doi: 10.1038/nature03315. [DOI] [PubMed] [Google Scholar]
- 34.Barrett T., Edgar R. Gene expression omnibus: microarray data storage, submission, retrieval, and analysis. Methods Enzymol. 2006;411:352–369. doi: 10.1016/S0076-6879(06)11019-8. [DOI] [PMC free article] [PubMed] [Google Scholar]
- 35.Lewis B.P., Shih I.H., Burge C.B. Prediction of mammalian microRNA targets. Cell. 2003;115:787–798. doi: 10.1016/s0092-8674(03)01018-3. [DOI] [PubMed] [Google Scholar]
- 36.Buchler N.E., Louis M. Molecular titration and ultrasensitivity in regulatory networks. J. Mol. Biol. 2008;384:1106–1119. doi: 10.1016/j.jmb.2008.09.079. [DOI] [PubMed] [Google Scholar]
- 37.Arvey A., Larsson E., Marks D.S. Target mRNA abundance dilutes microRNA and siRNA activity. Mol. Syst. Biol. 2010;6:363. doi: 10.1038/msb.2010.24. [DOI] [PMC free article] [PubMed] [Google Scholar]
- 38.Larsson E., Sander C., Marks D. mRNA turnover rate limits siRNA and microRNA efficacy. Mol. Syst. Biol. 2010;6:433. doi: 10.1038/msb.2010.89. [DOI] [PMC free article] [PubMed] [Google Scholar]
- 39.Scaria V., Hariharan M., Brahmachari S.K. Host-virus genome interactions: macro roles for microRNAs. Cell. Microbiol. 2007;9:2784–2794. doi: 10.1111/j.1462-5822.2007.01050.x. [DOI] [PubMed] [Google Scholar]
- 40.Pfeffer S., Sewer A., Tuschl T. Identification of microRNAs of the herpesvirus family. Nat. Methods. 2005;2:269–276. doi: 10.1038/nmeth746. [DOI] [PubMed] [Google Scholar]
- 41.Skalsky R.L., Cullen B.R. Viruses, microRNAs, and host interactions. Annu. Rev. Microbiol. 2010;64:123–141. doi: 10.1146/annurev.micro.112408.134243. [DOI] [PMC free article] [PubMed] [Google Scholar]
- 42.Andersson M.G., Haasnoot P.C., Akusjärvi G. Suppression of RNA interference by adenovirus virus-associated RNA. J. Virol. 2005;79:9556–9565. doi: 10.1128/JVI.79.15.9556-9565.2005. [DOI] [PMC free article] [PubMed] [Google Scholar]
- 43.Lu S., Cullen B.R. Adenovirus VA1 noncoding RNA can inhibit small interfering RNA and MicroRNA biogenesis. J. Virol. 2004;78:12868–12876. doi: 10.1128/JVI.78.23.12868-12876.2004. [DOI] [PMC free article] [PubMed] [Google Scholar]
- 44.Esquela-Kerscher A., Slack F.J. Oncomirs—microRNAs with a role in cancer. Nat. Rev. Cancer. 2006;6:259–269. doi: 10.1038/nrc1840. [DOI] [PubMed] [Google Scholar]
- 45.Martinez J., Tuschl T. RISC is a 5′ phosphomonoester-producing RNA endonuclease. Genes Dev. 2004;18:975–980. doi: 10.1101/gad.1187904. [DOI] [PMC free article] [PubMed] [Google Scholar]
- 46.Hussein R., Lim H.N. Disruption of small RNA signaling caused by competition for Hfq. Proc. Natl. Acad. Sci. USA. 2011;108:1110–1115. doi: 10.1073/pnas.1010082108. [DOI] [PMC free article] [PubMed] [Google Scholar]
- 47.Jousselin A., Metzinger L., Felden B. On the facultative requirement of the bacterial RNA chaperone, Hfq. Trends Microbiol. 2009;17:399–405. doi: 10.1016/j.tim.2009.06.003. [DOI] [PubMed] [Google Scholar]
- 48.Yi R., Doehle B.P., Cullen B.R. Overexpression of exportin 5 enhances RNA interference mediated by short hairpin RNAs and microRNAs. RNA. 2005;11:220–226. doi: 10.1261/rna.7233305. [DOI] [PMC free article] [PubMed] [Google Scholar]
- 49.Sakurai K., Amarzguioui M., Rossi J.J. A role for human Dicer in pre-RISC loading of siRNAs. Nucleic Acids Res. 2011;39:1510–1525. doi: 10.1093/nar/gkq846. [DOI] [PMC free article] [PubMed] [Google Scholar]
Associated Data
This section collects any data citations, data availability statements, or supplementary materials included in this article.