

Abstract
The curvature of biological membranes is controlled by membrane-bound proteins. For example, during endocytosis, the sorting of membrane components, vesicle budding, and fission from the plasma membrane are mediated by adaptor and accessory proteins. Endophilin is a peripherally binding membrane protein that functions as an endocytic accessory protein. Endophilin's membrane tubulation capacity is well known. However, to understand the thermodynamic and mechanical aspects of endophilin function, experimental measurements need to be compared to quantitative theoretical models. We present measurements of curvature sorting and curvature generation of the endophilin A1 N-BAR domain on tubular membranes pulled from giant unilamellar vesicles. At low concentration, endophilin functions primarily as a membrane curvature sensor; at high concentrations, it also generates curvature. We determine the spontaneous curvature induced by endophilin and observe sigmoidal curvature/composition coupling isotherms that saturate at high membrane tensions and protein solution concentrations. The observation of saturation is supported by a strong dependence of lateral diffusion coefficients on protein density on the tether membrane. We develop a nonlinear curvature/composition coupling model that captures our experimental observations. Our model predicts a curvature-induced phase transition among two states with varying protein density and membrane curvature. This transition could act as a switch during endocytosis.
Introduction
The alterations of cellular membrane curvature (MC) that accompany phenomena such as endocytic vesicle budding and fission are regulated by a plethora of peripheral proteins (1). The BAR-domain (Bin/Amphiphysin/Rvs) superfamily constitutes an important class of MC sensing and generating proteins. BAR-domain-containing proteins are involved in many cellular processes (1–5). BAR domains are characterized by monomer units that consist of coiled coils that dimerize into modules with a positively charged membrane-binding interface. The BAR-domain family is composed of subfamilies with different crystal structures, including classical BAR (6), N-BAR (3), F-BAR (Fes/CIP4 homology-BAR) (7), and I-BAR (inverse-BAR) (8). The crystal structures of BAR- and N-BAR-domain dimers display crescent shapes with high positive curvature.
Endophilin is an N-terminal BAR-domain-containing protein (9–12) that is enriched at neural synapses. Endophilin assembles with dynamin and synaptojanin around the neck of clathrin-coated membrane invaginations (9,13). Endophilin also has been found to be involved in a clathrin-independent endocytic pathway that is faster than clathrin-dependent endocytosis (14).
The endophilin N-BAR domain (ENBAR) contains a BAR domain, an N-terminal helix adjacent to the BAR domain (helix H0), and an additional amphipathic helix (H1 insert helix, residues ∼62–86) (15–17). These amphipathic helices are disordered in aqueous solution and form an α-helix upon membrane insertion (16,18).
In vitro research has shown that endophilin senses MC and induces the deformation and tubulation of liposomes (2,15,16). The mechanism of MC generation and sensing by endophilin is not fully understood. Liposome-binding and tubulation assays, as well as results based on electron paramagnetic resonance spectroscopy, have suggested that the concave surface of its BAR domain acts as a rigid, positively charged scaffold (15,16) that electrostatically interacts with negatively charged liposomes (1,3,19). Electron paramagnetic resonance spectroscopy measurements showed that the concave surface of the endophilin BAR domain does not penetrate into the acyl-chain level of the curved bilayer, implying that the BAR domain only peripherally interacts with the membrane (18). The rigidity and spontaneous curvature of the crescent shape are assumed to bend the membrane (20).
Interestingly, a recently developed single-liposome membrane-binding assay reported that the crescent-shaped BAR domain dimer is not able to sense MC; instead, MC sensing was suggested to depend solely on the insertion of amphipathic helices into lipid-packing defects (21). Indeed, H0 and the H1 insert helices are believed to drive MC (15,16,22) via their hydrophobic insertion into the membrane (1,18,19,23). Furthermore, molecular dynamics simulations have shown that the H1 insert helix orients perpendicularly to the long axis of the N-BAR domains during membrane binding, and that the degree of membrane deformation is connected with H1-helix orientation (24).
Besides scaffolding and hydrophobic insertion, higher-order oligomerization of BAR domain dimers may contribute to MC generation (1). Consistent with this hypothesis, striations have been observed on tubules generated via ENBAR domains (2). Theoretical characterization of the process of liposome tubulation (25) and vesiculation by N-BAR domains via mesoscopic simulations and electron microscopy imaging indicate an intricate coupling between protein density, degree of N-BAR oligomerization, and membrane deformation (26).
In this contribution, we first experimentally characterize the effect of MC on both ENBAR localization at different protein solution concentrations and translational diffusion of ENBAR. We then derive an analytical curvature-sorting model that we compare to our data. Implications of this model for physiologically important membrane shape transitions are also discussed.
Materials and Methods
Materials
1,2-dioleoyl-sn-glycero-3-phosphocholine (DOPC), 1,2-dioleoyl-sn-glycero-3-phospho-(1′-rac-glycerol) (DOPG) and distearoylphosphatidylethanolamine-N-(biotinyl(polyethylene glycol)2000) (DSPE-Bio-PEG2000) were obtained from Avanti Polar Lipids (Alabaster, AL). Fatty-acid-free bovine serum albumin (BSA) was from Sigma Chemical (St. Louis, MO). Rat endophilin A1 N-BAR-AlexaFluor 488 (ENBAR-A488, amino acids 1–247, labeled at C108) was obtained from R. Langen (University of Southern California, Los Angeles, CA) and stored in buffer (20 mM HEPES, pH 7.4, 150 mM NaCl). Using vesicle spin-down assays (27), we confirmed that fluorescence labeling at position C108 does not alter membrane binding (data not shown). Texas Red-1,2-dihexadecanoyl-sn-glycero-3-phosphoethanolamine triethylammonium salt (TR-DHPE) was from Invitrogen (Carlsbad, CA). Streptavidin-conjugated microspheres with a diameter of 6 μm were from Polysciences (Warrington, PA).
Preparation of giant unilamellar vesicles
Giant unilamellar vesicles (GUVs) were prepared by electroformation in solutions of 300 mM sucrose as described (28). Lipids were mixed in chloroform at a total concentration of 1 mM. DOPG was used at 25 mol %, DOPC at 74 mol %, TR-DHPE at 0.3 mol %, and DSPE-Bio-PEG2000 at 0.7 mol %. ENBAR-A488 was added after electroswelling (so proteins bind to the exterior leaflet of GUV membrane only) but immediately before micropipette aspiration experiments, to yield final solution concentrations indicated below.
Micropipette aspiration
Micropipettes were fabricated and used for GUV aspiration as described (29–32). The lateral membrane tension, Σ, was related to the pipette aspiration pressure as described (30). For further description of pipette aspiration see the Supporting Material.
Imaging
Vesicles and tethers were imaged with a fluorescence confocal microscopy (FV3000) scanning system integrated with a motorized inverted microscope IX81, Olympus, Center Valley, PA, using a 60×, 1.2 NA water immersion lens (Olympus). Image analysis was carried out via IMAGEJ (National Institutes of Health, Bethesda, MD). Vesicle fluorescence intensity values were measured after background subtraction from an average of four randomly chosen equal-area regions of interest on the vesicle equator.
Tether cross-section fluorescence intensity measurements
To investigate protein partitioning driven by MC, we monitored the local fluorescence intensities on the tubular membrane under varying membrane tensions. We changed membrane tension by adjusting the height of a water reservoir. Fluorescence intensities of tethers were measured by obtaining Kalman-averaged images of the tether cross section (xz plane), which is orthogonal to the axis of the tether (contained in the xy plane; Fig. 1 A), at a stepwidth of 0.15 μm to yield a total imaging depth of 6 μm. Cross-sectional fluorescence intensity profiles (Fig. 1 B) were background-corrected, and intensity was evaluated in an elliptical region of interest.
Figure 1.
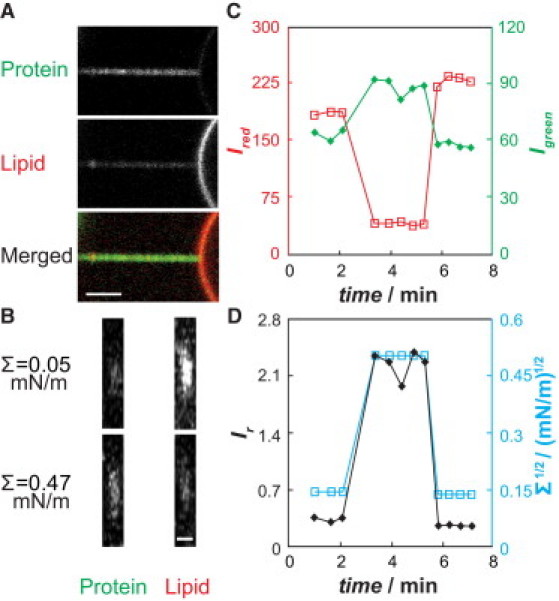
Rat endophilin A1 NBAR domains (ENBAR) partition in curvature gradients generated by tether membranes pulled from GUVs. (A) Confocal xy images of a protein channel (upper), a lipid channel (middle), and a merged channel (lower), demonstrating AlexaFluor-488-labeled ENBAR (green) enrichment on a tether pulled from micropipette-aspirated GUV membrane (red) with composition 74% DOPC, 25% DOPG, 0.3% TR-DHPE, and 0.7% DSPE-Bio-PEG2000. Σ = 0.166 mN/m; 150 nM ENBAR in 33 mM NaCl, HEPES, pH 7.4. Scale bar, 3 μm. (B) Cross-section confocal xz line-scan images of a membrane tether under varying tensions, demonstrating the curvature preference of ENBAR. Scale bar, 2 μm. (C) Demonstration of reversibility and equilibration for quantitative fluorescence measurements of ENBAR curvature partitioning. Protein (green) and lipid probe (red) fluorescence intensities measured during cyclic rapid membrane-tension changes (corresponding to tension values in D). Left axis, red squares, Ired; right axis, green diamonds, Igreen. (D) Ir = Igreen/Ired values for the data in C (left axis, black diamonds), with indicated tension levels (right axis, blue squares).
For us to be able to correlate membrane-tether fluorescence intensity changes with changes in protein coverage fraction, we determined the linear range of fluorescence. For this purpose, tethers were pulled from pipette-aspirated GUVs incubated with ENBAR-A488 at a concentration of 150 nM. Intensities of tethers at fixed membrane tension were measured for varying laser powers (see Fig. S1 in the Supporting Material). The laser power range left of the vertical line in Fig. S1 indicates the linear range, whereas at larger laser power the fluorescence response deviates from the linear tendency due to fluorescence photobleaching. Consequently, all measurements in this report were obtained using laser powers within the indicated linear range.
Diffusion measurements on tethers via fluorescence recovery after photobleaching
For fluorescence recovery after photobleaching (FRAP) measurements on the membrane tether, tethers with lengths of 12 ± 1 μm were pulled and kept at fixed membrane tension. Except for a short stretch amounting to a length of ∼0.5 μm measured from the tether/vesicle junction, the entire tether (including the pulling bead) was photobleached by repeated scanning at maximal laser intensity (488 nm illumination). Prebleach and postbleach intensities were measured using excitation with small laser power (0.1∼0.3% of full power) at 488 nm. The relative photobleaching recovery ratio, R(t), at a given time, t, was defined as
| (1) |
where I(t), I(0), and I(–) are the fluorescence intensities of the tether integrated along length increments dx at time t, at a time immediately after bleaching (t = 0), and before bleaching, respectively. A one-dimensional diffusion model (33) was fit to the photobleaching recovery ratio, R(t):
| (2) |
where D is the diffusion coefficient, ρ0 is the maximal local recovery ratio, which is positive and no larger than 1. L1 and L2 are the beginning and ending positions of the analysis range on the tether. L is the total length of the region of interest, and h is the position of an image source accounting for the presence of an impermeable boundary at the bead position (33). Fitting was done via the software Mathematica (Wolfram Research, Champaign, IL).
Error analysis and numerical calculations
For details on error analysis, please see the Supporting Material. Numerical solutions of coupled equations of our curvature-sorting model were obtained via the software MATLAB (The MathWorks, Natick, MA).
Results
An important goal of this study was to investigate to what extent and under which conditions the N-BAR domain of the peripheral protein endophilin A1 (ENBAR, from rat) binds to tubular membranes with variable curvature. Electron microscopy observations (15,16,26) combined with computational studies (24,34,35) have already demonstrated that ENBAR can deform membranes into high-curvature assemblies (with varying curvature radii typically significantly below 50 nm at multimolar protein concentrations). To be able to understand thermodynamic and mechanical aspects of ENBAR domain function, however, requires a comparison of measurements to quantitative models. To quantitatively characterize the curvature sensing of ENBAR, we incubated ENBAR-A488 with negatively-charged GUVs containing the lipid fluorophore TR-DHPE and pulled cylindrical tethers from pipette-aspirated vesicles using streptavidin-conjugated microspheres. Fig. 1 A demonstrates qualitatively that green (ENBAR protein) fluorescence is enriched on highly curved tubular membranes rather than on the quasiflat vesicular membrane (partially shown on the righthand side in the fluorescence micrographs of Fig. 1 A).
The curvature-induced partitioning of ENBAR was determined by confocal microscopy fluorescence imaging of membrane-tether cross sections (Fig. 1 B) and analyzed as described in the Materials and Methods section (ensuring linear response to illumination; see Fig. S1). Fig. 1 C shows that green fluorescence intensity (ENBAR) increases on the tether as membrane tension is increased, whereas the lipid membrane-tether fluorescence decreases as a consequence of the shrinking tubular radius (30).
Thermodynamic interpretation of our data (see below) requires assessment of reversibility and equilibration times of fluorescence intensities of the protein and the lipid probe under varying membrane tension. Both green and red fluorescence signals respond to large, rapid (∼0.5 mN/m/min) increases of membrane tension within ∼1 min and reach equilibrium (see Fig. 1 C and fluorescence intensity ratio shown in Fig. 1 D). Subsequently lowering tension causes corresponding fluorescence intensity changes, which demonstrates reversibility of the measurements.
In Fig. 2 A, we display the analysis of a typical ENBAR curvature-sorting experiment using a protein solution concentration of 40 nM. With increasing lateral tension, fluorescence intensity in the green (protein) fluorescence channel monotonically increases, whereas the opposite is observed in the red (lipid) channel. In Fig. 2, fluorescence intensity measurements are plotted against the square root of lateral tension for the following reason. For the case of linear curvature sorting, the square root of lateral tension can be shown to be proportional to membrane curvature (36). The plots in Fig. 2 therefore allow assessment of the linearity of curvature sorting. It is important to note that the results shown here demonstrate nonlinear curvature/composition coupling; hence, they deviate from those found for the epsin N-terminal homology (ENTH) domain, where sorting was observed to be proportional to the square root of membrane tension (37).
Figure 2.
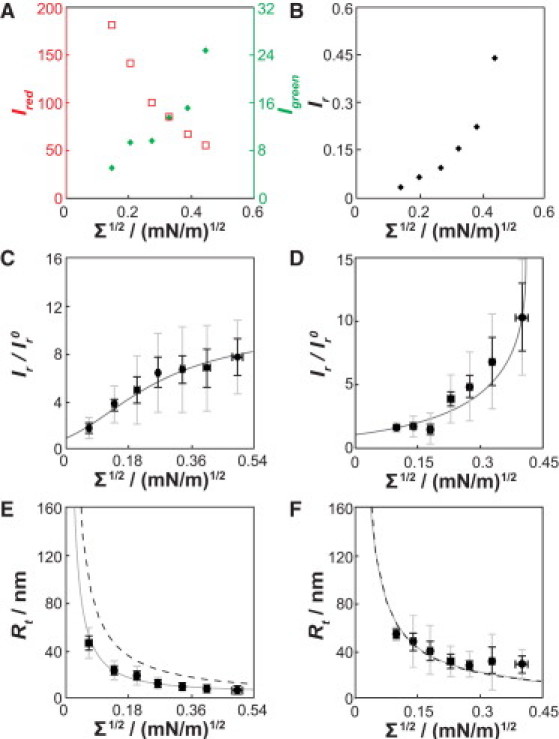
ENBAR localization depends on membrane curvature. (A) Plot of separate green and red channel fluorescence intensities from images equivalent to those shown in Fig. 1B for multiple tension levels from one tether membrane. While the red (lipid) fluorescence intensity decreases as membrane tension is increased, the green (protein) fluorescence increases. ENBAR concentration is 40 nM in 10 mM NaCl. (B) Plot of ratio of green and red channel fluorescence intensities for the data shown in Fig. 2A. (C) Data from seven vesicles were binned (gray and black vertical error bars represent standard deviations and standard errors of mean, respectively, of ; horizontal error bars show standard errors of mean of square root of tension). ENBAR concentration is 1 μM. The gray solid line shows the fit with the van der Waals curvature-sorting model described in the main text. (D) Curvature sorting results as in C for an ENBAR concentration of 40 nM. Seven vesicles were analyzed. The gray line shows a fit with the van der Waals sorting model. (E and F) Tether radii changing as a function of membrane tension for ENBAR concentrations of 1 μM (E) and 40 nM (F), respectively. The gray solid lines show fit results via the van der Waals model. The black dashed lines are the expected tube radii in the absence of protein.
The fluorescence intensity of lipid probes in high-curvature tether membranes used in this work is linearly proportional to the MC (see Fig. S2, consistent with our previous findings (30,31)); fluorescent lipids therefore are not significantly sorted by membrane curvature and here serve as a reference for ratiometric fluorescence intensity measurements. Fig. 2 B shows the ratio, Ir, of protein and lipid probe fluorescence intensities (Ir = Igreen/Ired) for the data shown in Fig. 2 A.
To facilitate the comparison of our data to a thermodynamic model (see below), the relative fluorescence intensities, Ir, were normalized to values of ( = Ives-green/Ives-red) measured on the vesicle (described in Materials and Methods). A series of individual sorting experiments were carried out at two different protein solution concentrations, 1 μM and 40 nM, respectively. The results were normalized, binned, and averaged for multiple tethers; see Fig. 2, C and D. Again in contrast to the curvature sorting observed for ENTH, the measurements in Fig. 2, C and D, show significant deviations from linearity. Fig. 2 C shows that for low values of the square root of tension, the ratiometric parameter increases almost linearly for the case of 1 μM protein solution concentration. As curvature is further increased, the sorting ratio becomes nearly constant (Fig. 2 C). At low protein solution concentration and low membrane tension (Fig. 2 D), curvature sorting is significantly weaker than it is at higher tensions (at the same solution concentration). For this concentration, although the membrane tension increases, the curvature/composition coupling also increases, as indicated by the larger slope of the fluorescence intensity ratios. We note that Fig. 2, C and D, displays relatively large standard deviations comparing different vesicles. The sources for this variability may include differences in individual vesicle lipid compositions. However, the main features of our measurements, i.e., nonlinear sorting and saturation of sorting at high membrane curvature and protein solution concentration, were reproducible for all individual vesicles. From fluorescence-intensity values of the lipid dye measured on vesicle and tether, it is possible to estimate the radius of the tether ((38); also see Materials and Methods). The results for our two solution conditions are shown in Fig. 2, E and F, for the same vesicles shown in Fig. 2, C and D. The comparison of the experimental radii to those calculated assuming a bending stiffness of 0.8 × 10⁻¹⁹ J (30) and absence of spontaneous curvature (Fig. 2, E and F, dashed lines), reveals curvature generation at the higher, but not at the lower, protein solution concentration. These curvature-generation measurements, along with the curvature-sorting results, were fitted with a theory (Figs. 2, C–F, solid lines), detailed below.
In addition to the equilibrium curvature-sorting measurements described above, we assessed curvature-dependent diffusion of ENBAR on tubular membranes via FRAP measurements. Fig. 3, A and B, shows examples of the time-dependent recovery after photobleaching of ENBAR on the tether membrane, demonstrating the mobility of ENBAR on membranes. Individual measurements at a protein solution concentration of 1 μM were recorded for varying membrane tensions and analyzed as described in the Materials and Methods section. A one-dimensional diffusion model was then fit to the time-dependent recovery ratios. Fig. 3, A and B, shows experimental results compared to fitted curves for the smallest and largest membrane tensions, respectively. The diffusion coefficient for the measurement displayed in Fig. 3 A is 1.47 μm2/s, and the result for the data in Fig. 3 B is 0.13 μm2/s. Quantitative photobleaching recovery measurements were obtained from image analysis of time-lapse recordings of tether membrane fluorescence (see Fig. 3 C). The results of FRAP measurements for a series of different membrane tensions are summarized in Fig. 3 D. As membrane tension increases, the diffusion coefficient of ENBAR on membrane tethers decreases. As further discussed below, we hypothesize that the decrease in diffusion coefficients results from an increase in molecular crowding, as the density of protein increases with rising curvature. We confirmed the hypothesis of protein density affecting diffusion by the following experiment.
Figure 3.
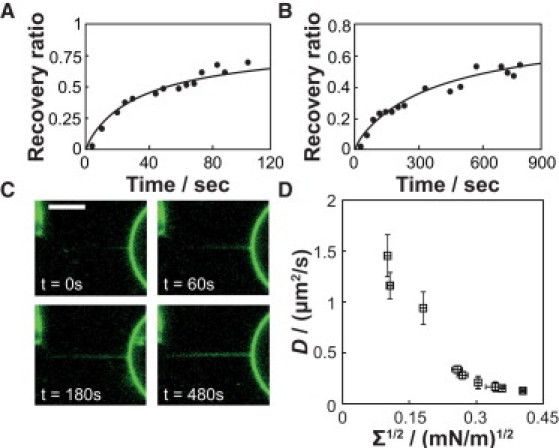
ENBAR diffusion on membrane tethers measured via fluorescence recovery after photobleaching (FRAP) slows with increasing curvature. Analyzed bleach lengths amounted to 10 μm, and ENBAR concentration was 1 μM in 10 mM NaCl. Diffusion coefficients were obtained from a one-dimensional diffusion model, and continuous lines represent the fitting results. (A) Relative fluorescence recovery (defined in the Materials and Methods section) of a membrane tether for membrane tension Σ = 0.010 mN/m, D = 1.47 μm2/s. (B) Relative fluorescence recovery of a membrane tether for membrane tension Σ = 0.153 mN/m, D = 0.13 μm2/s. (C) Fluorescence images showing photobleaching recovery of a tether at membrane tension Σ = 0.120 mN/m, D = 0.15 μm2/s. Scale bar, 5 μm. (D) Summary of ENBAR diffusion coefficients on tether membranes with varying degrees of lateral tension and therefore varying degrees of curvature. Errors were determined as explained in the Supporting Material.
The lateral mobility of ENBAR on tubular membranes was monitored by an alternative method that consisted of stepwise tether elongations. Membrane tethers previously equilibrated in the presence of ENBAR (1 μM) were rapidly (10 μm/s) extended by 10 μm, which resulted in a tether region with low protein coverage being pulled from the aspirated vesicle. ENBAR was observed to diffuse from the vesicle onto the tether (Fig. 4 A), consistent with the photobleaching results discussed above (see Fig. 3 C). This phenomenon could be reproduced several times by repeating the elongation process described above. Note that therefore, exchange of protein between vesicle and tether appears to be significantly faster compared to exchange between tether and aqueous solution.
Figure 4.
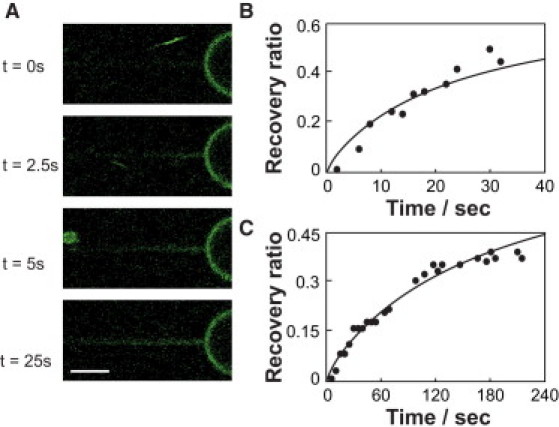
Diffusion of ENBAR on membrane tethers is faster in tether elongation experiments compared to FRAP experiments at similar membrane tension. Elongation, as well as bleached, lengths are 10 μm and ENBAR concentration is 1 μM in solution of 10 mM NaCl. Diffusion coefficients were obtained from a one-dimensional diffusion model, and continuous lines represent the fit results. (A) Fluorescence images showing time dependence of protein fluorescence increase of a tether membrane stretch that was rapidly pulled from a GUV with a tether that had previously been equilibrated with ENBAR at membrane tension Σ = 0.110 mN/m; D = 1.86 μm2/s. Scale bar, 3 μm. (B) Fluorescence recovery after tether elongation. Fit results in diffusion coefficient of D = 2.17 μm2/s at membrane tension Σ = 0.076 mN/m. (C) Fluorescence recovery after photobleaching. Fit results in diffusion coefficient of D = 0.28 μm2/s at membrane tension Σ = 0.068 mN/m.
Furthermore, it is observed that for comparable membrane tensions, the diffusion of ENBAR onto the tubular membrane after tether elongation (Fig. 4 B) is significantly faster compared to diffusion observed after photobleaching (Fig. 4 C). This observation supports our hypothesis that the lateral mobility of membrane-bound ENBAR depends on the free area available for diffusion. In this view, diffusion kinetics at high lateral tensions are slowed (Fig. 3 D) due to molecular crowding. Further research will be required to investigate whether slowing down of diffusion kinetics at high curvature may be amplified by the finite-size effect expected for diffusion in a cylindrical membrane geometry (39,40).
Discussion
In the following sections, we outline the derivation of a curvature-sorting model that captures several of our experimental observations. We compare this model to our data, and discuss the possibility of curvature-induced phase transitions predicted by this model.
Introduction of a nonlinear curvature/composition coupling model
Classical analytical curvature/composition coupling models assume a linear coupling between local composition and local MC (41). Similar models have recently been used to interpret the partitioning of peripheral proteins in curvature gradients (30,37,38). Our findings for the curvature partitioning of ENBAR (Fig. 2, C and D) clearly deviate from linear sorting (note that in linear sorting models the curvature is proportional to (37)). Thermodynamic terms in linear curvature/composition coupling models can be interpreted as terms resulting from second-order Taylor expansion in composition and curvature of the free energy (30,37). In such models, the coefficients of these expansions are evaluated for the thermodynamic reservoir (i.e., the GUV) that pulled tethers are in contact with. In the following, we replace the expansion term squared in composition change by Γ, which is a function of fractional protein coverage, θ (ranging from 0 to 1), to define the tube free energy, Ft:
| (3) |
where R and L are tether radius and length, respectively, κ is the membrane bending stiffness, Cp is a spontaneous curvature of the membrane induced by protein binding, Σ is the lateral tension, and f is the pulling force acting on the tether. We note that this highly simplifying model neglects aspects such as the area difference elasticity (42), osmotic effects (43), membrane undulations, and the possibility of more than one protein-binding mode (26). We also assume that the phenomenological spontaneous curvature, Cp, does not depend on membrane curvature.
In Eq. 3, the function Γ results from Legendre transform of a van der Waals free-energy density, f0, that describes the thermodynamics of the protein on the membrane:
| (4) |
where f0 is the mixing free-energy density of a two-dimensional van der Waals gas:
| (5) |
Here, kB is Boltzmann's constant, T is temperature, b is the excluded area for protein coverage, and a is a van der Waals interaction term (which here characterizes protein/protein interactions).
The function Γ shows a nonparabolic dependence on composition (as opposed to the usual Taylor expansion term (37,38,41)). This expansion term, which replaces Γ in Eq. 3, is written for the van der Waals model as follows:
| (6a) |
with
| (6b) |
where χ is the inverse osmotic compressibility of the van der Waals model. In Fig. 5 A, Eq. 6a is compared to Eq. 4. For chemical potential and pressure of the van der Waals gas on a flat membrane, we have
| (7a) |
| (7b) |
where μves is the (fixed) chemical potential of proteins bound to the vesicle (and in the aqueous solution), and Πves is a two-dimensional van der Waals pressure of the protein on the vesicle (where curvature is assumed to be negligible). With this definition of Π, Σ is the lateral tension in the vesicle membrane measured by micropipette aspiration.
Figure 5.
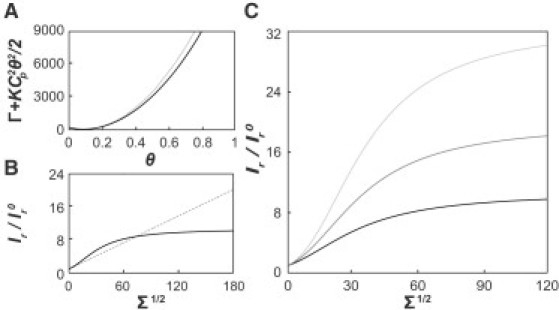
Comparison of curvature/composition coupling model to experimental data. (A) Black solid line, function using a vesicle coverage of θves = 0.093, and nondimensionalized parameters , , and (equivalent to b = 50 nm2 and Cp = 1/6 nm−1 at room temperature), which are values corresponding to a stable (i.e., homogenous) regime at the equilibrium concentration. As expected, the harmonic approximation (gray dashed line) is accurate near the vesicle (equilibrium) coverage. (B) Plot of the ratio θtether/θves as a function of lateral tension. The exact expression is shown by the black solid line and the gray dashed line shows the linear sorting resulting from the Taylor expansion approximation for the same set of parameters as in A. (C) Van der Waals model isotherms evaluated for the same values for as in A, but with different vesicle coverage fractions of 0.03 (light gray), 0.05 (medium gray), and 0.093 (black).
Mechanical balance is obtained from minimization of Eq. 3 with respect to R:
| (8) |
We note that in the absence of a reservoir (in which case Γ disappears), the familiar mechanical balance of a tube with spontaneous curvature is recovered from Eq. 8 (44,45). Furthermore, in the absence of spontaneous curvature, the last two terms in Eq. 8 (and therefore temperature and composition dependence) disappear at equilibrium, as required. Using the chemical equilibrium condition obtained from Eq. 3 through minimization with respect to θ, we can express Σ as a function of θ:
| (9) |
Eq. 9 is an analytically tractable relationship that can be compared to our experimental data. Fig. 5 B compares Taylor expansion solution (leading to linear curvature sorting) to the exact solution of the van der Waals model (which displays sigmoidal curvature sorting) for identical parameters.
Comparison of analytical model to experimental data
In the following, we demonstrate that in addition to its apparent simplifications, our van der Waals curvature-sorting model captures our experimental observations.
As mentioned above, the relative sorting ratio displayed in Fig. 2, C and D, is a ratio of the fluorescence intensity of a protein (Igreen) to that of a lipid probe (Ired) in the highly curved tether (Ir = Igreen/Ired) normalized by the ratio ( = Ives-green/Ives-red) found on the vesicle. This normalized sorting ratio is equivalent to the ratio of coverage fractions on tether and vesicle (37) and can also be interpreted as the relative increase of protein density compared to the vesicle reservoir. A comparison of Fig. 2, C and D. suggests that the relative enrichment of ENBAR on the tubular membrane is smaller at higher solution concentration (1 μM, Fig. 2 C) compared to lower concentration (40 nM, Fig. 2 D). Fig. 5 C theoretically confirms this observation: for otherwise identical parameters of the model the relative enrichment increases with decreasing vesicle protein coverage fraction (which is related to the protein solution concentration by a binding isotherm (see Fig. S3)).
The van der Waals curvature-sorting model contains four fit parameters. These are the interaction term, a, the excluded area, b, the spontaneous curvature, Cp, and the vesicle coverage fraction, θves, which is related to μves (see Eq. 7a). The fit lines shown in Fig. 2 result from simultaneous fitting of sorting and radius values (via Eqs. 8 and 9; see Fig. 2, C and E, as well as Fig. 2, D and F). We obtain spontaneous curvatures of 0.14 ± 0.007 nm−1 and 0.019 ± 0.0002 nm−1 for high and low protein concentrations, respectively. The fit values for b are in good agreement with the protein cross-section area (16); see the Supporting Material for all fit parameters and uncertainties.
Possibility of curvature-induced phase transitions
Evidence from electron microscopy imaging suggests that membrane tether regions covered by BAR domain proteins can show differing, potentially coexisting, degrees of curvature (26,46). We show in the following that, as expected for any van der Waals-type mixing model, our curvature/composition coupling model predicts the existence of a first-order phase transition.
Equating to zero, the determinant of the stability matrix resulting from Eq. 3 yields the spinodal line (i.e., the local stability limit) for our model (see Fig. 6 A, thin black line).
| (10) |
Figure 6.
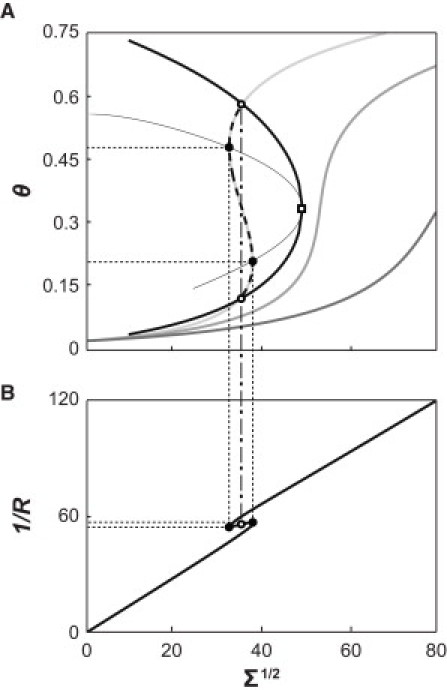
Van der Waals curvature/composition coupling model predicts curvature-driven phase transition. (A) Binodal (thick black line) and spinodal (thin black line) for the van der Waals curvature/composition coupling model, for varying molecular interaction parameter (equivalent to varying temperature, see Eq. 10). Parameters , θves, and were 0.0012, 0.0189, and 19.513, respectively, close to the fitting parameters for experimental outcomes of curvature-sorting and radius measurements at a protein concentration of 40 nM. Open square refers to the critical point where . The intersections of the curvature isotherm (light gray line) and the binodal curve for are the phase coexistence points (open circles). The dashed line represents a branch on the isotherm that lies within the coexistence regime. The intersections of the isotherm and the spinodal line represent the stability limits (solid circles). Isotherms with (darker gray lines) are stable over the entire curvature range. (B) Relationship between inverse tether radius (curvature) and membrane tension. The branch between the solid black points corresponds to the instable region shown in Fig. 6A. The open circles are coexistence points (corresponding to open dots on the binodal line in Fig. 6A). At the phase boundary, the tether radius shows a discontinuous jump.
In Fig. 6 A, the spinodal is expressed as a function of lateral tension by solving Eq. 10 for θ (for a set of variable temperatures) and evaluating the associated lateral tensions by means of Eq. 9. It is observed (and can be shown analytically) that the limit of stability is reached when the slope of the curvature adsorption isotherm of Fig. 6 A is infinite, i.e., where (Fig. 6 A, solid circles). The critical point of phase coexistence (Fig. 6 A, square), is found from Eq. 10 evaluated at the critical composition, θcrit = 1/3; .
The phase boundary (i.e., the binodal line (Fig. 6, thick black line)) is obtained by numerically solving the equations for chemical potentials of the tube, μt, and pulling force, f,
| (11a) |
| (11b) |
| (11c) |
for the three unknowns, θ1 and θ2 (the compositions of coexisting phases) and associated lateral tension Σ, for given values of a, b, Cp, and μves. The first two conditions result from chemical equilibrium in the coexistence regime, and the last condition ensures mechanical balance (i.e., the pulling force on the membrane tether is equivalent in coexisting phases). The pulling force is obtained from Eq. 3 as
| (12) |
Fig. 6 B demonstrates that a curvature-induced phase transition leads to a discontinuous jump in tether radius (Fig. 6 B, open circles) associated with a discontinuous jump in protein density (Fig. 6 A, open circles). Furthermore, tiny changes in curvature (from 17.6 to 18.1 nm) can lead to substantial protein density changes (θ = 0.21–0.48; see Fig. 6). Our curvature-sorting data do not yet reveal such a transition; potentially because curvature changes during this transition may be hard to resolve experimentally. It is, however, tempting to speculate that such curvature-induced phase transitions might play the role of a curvature-dependent protein-density switch in processes that involve membrane deformation, such as the generation of tubular or vesicular membrane trafficking vehicles during endocytosis.
Conclusions
We have experimentally characterized the curvature sorting of the N-BAR domain of endophilin A1. Consistent with earlier findings from our group, the N-BAR domain is observed to sense membrane curvature at low concentration, and to generate curvature at higher concentrations (32,36). Our measurements reveal a sigmoidal curvature/composition coupling isotherm and suggest that attractive protein/protein interactions (implying positive cooperativity) can be amplified through curvature/composition coupling. This may imply that an ENBAR protein membrane coverage fraction regime exists where small changes in MC lead to large changes in membrane coverage, in a synergistic effect that increases the sensitivity of curvature sorting, as has previously been suggested (16). We furthermore have developed an analytical model that captures the observed sigmoidal curvature sorting and predicts the existence of a protein density switch that may function to determine the fate of maturing endocytic membrane pits.
Acknowledgments
We acknowledge discussions with Ralf Langen and his group and are thankful to them for providing us with protein. Matthew Turner is acknowledged for discussions of diffusion models, and we thank Benjamin Capraro for a critical reading of the manuscript text.
This work was supported by National Science Foundation grant MCB-0718569, National Institutes of Health grant R01GM097552, and the Alfred P. Sloan Foundation.
Appendix
For calculations based on the van der Waals curvature-sorting model introduced here, the following nondimensionalized parameters (indicated by a hat) were used:
| (13) |
Here, R0 is a reference length, and κ is the bending stiffness of the tether membrane. We note that recent measurements have shown that membrane bending stiffness can be modulated by the peripheral membrane binding of the protein Sar1 (47). Future measurements will have to investigate whether that is the case for BAR domain proteins.
Supporting Material
References
- 1.McMahon H.T., Gallop J.L. Membrane curvature and mechanisms of dynamic cell membrane remodelling. Nature. 2005;438:590–596. doi: 10.1038/nature04396. [DOI] [PubMed] [Google Scholar]
- 2.Farsad K., Ringstad N., De Camilli P. Generation of high curvature membranes mediated by direct endophilin bilayer interactions. J. Cell Biol. 2001;155:193–200. doi: 10.1083/jcb.200107075. [DOI] [PMC free article] [PubMed] [Google Scholar]
- 3.Peter B.J., Kent H.M., McMahon H.T. BAR domains as sensors of membrane curvature: the amphiphysin BAR structure. Science. 2004;303:495–499. doi: 10.1126/science.1092586. [DOI] [PubMed] [Google Scholar]
- 4.Suetsugu S., Toyooka K., Senju Y. Subcellular membrane curvature mediated by the BAR domain superfamily proteins. Semin. Cell Dev. Biol. 2010;21:340–349. doi: 10.1016/j.semcdb.2009.12.002. [DOI] [PubMed] [Google Scholar]
- 5.Itoh T., De Camilli P. BAR, F-BAR (EFC) and ENTH/ANTH domains in the regulation of membrane-cytosol interfaces and membrane curvature. Biochim. Biophys. Acta. 2006;1761:897–912. doi: 10.1016/j.bbalip.2006.06.015. [DOI] [PubMed] [Google Scholar]
- 6.Tarricone C., Xiao B., Smerdon S.J. The structural basis of Arfaptin-mediated cross-talk between Rac and Arf signalling pathways. Nature. 2001;411:215–219. doi: 10.1038/35075620. [DOI] [PubMed] [Google Scholar]
- 7.Shimada A., Niwa H., Yokoyama S. Curved EFC/F-BAR-domain dimers are joined end to end into a filament for membrane invagination in endocytosis. Cell. 2007;129:761–772. doi: 10.1016/j.cell.2007.03.040. [DOI] [PubMed] [Google Scholar]
- 8.Frost A., Unger V.M., De Camilli P. The BAR domain superfamily: membrane-molding macromolecules. Cell. 2009;137:191–196. doi: 10.1016/j.cell.2009.04.010. [DOI] [PMC free article] [PubMed] [Google Scholar]
- 9.Schuske K.R., Richmond J.E., Jorgensen E.M. Endophilin is required for synaptic vesicle endocytosis by localizing synaptojanin. Neuron. 2003;40:749–762. doi: 10.1016/s0896-6273(03)00667-6. [DOI] [PubMed] [Google Scholar]
- 10.Ringstad N., Gad H., De Camilli P. Endophilin/SH3p4 is required for the transition from early to late stages in clathrin-mediated synaptic vesicle endocytosis. Neuron. 1999;24:143–154. doi: 10.1016/s0896-6273(00)80828-4. [DOI] [PubMed] [Google Scholar]
- 11.Verstreken P., Kjaerulff O., Bellen H.J. Endophilin mutations block clathrin-mediated endocytosis but not neurotransmitter release. Cell. 2002;109:101–112. doi: 10.1016/s0092-8674(02)00688-8. [DOI] [PubMed] [Google Scholar]
- 12.Dickman D.K., Horne J.A., Schwarz T.L. A slowed classical pathway rather than kiss-and-run mediates endocytosis at synapses lacking synaptojanin and endophilin. Cell. 2005;123:521–533. doi: 10.1016/j.cell.2005.09.026. [DOI] [PubMed] [Google Scholar]
- 13.Sundborger A., Soderblom C., Shupliakov O. An endophilin-dynamin complex promotes budding of clathrin-coated vesicles during synaptic vesicle recycling. J. Cell Sci. 2011;124:133–143. doi: 10.1242/jcs.072686. [DOI] [PMC free article] [PubMed] [Google Scholar]
- 14.Llobet A., Gallop J.L., McMahon H.T. Endophilin drives the fast mode of vesicle retrieval in a ribbon synapse. J. Neurosci. 2011;31:8512–8519. doi: 10.1523/JNEUROSCI.6223-09.2011. [DOI] [PMC free article] [PubMed] [Google Scholar]
- 15.Masuda M., Takeda S., Mochizuki N. Endophilin BAR domain drives membrane curvature by two newly identified structure-based mechanisms. EMBO J. 2006;25:2889–2897. doi: 10.1038/sj.emboj.7601176. [DOI] [PMC free article] [PubMed] [Google Scholar]
- 16.Gallop J.L., Jao C.C., McMahon H.T. Mechanism of endophilin N-BAR domain-mediated membrane curvature. EMBO J. 2006;25:2898–2910. doi: 10.1038/sj.emboj.7601174. [DOI] [PMC free article] [PubMed] [Google Scholar]
- 17.Weissenhorn W. Crystal structure of the endophilin-A1 BAR domain. J. Mol. Biol. 2005;351:653–661. doi: 10.1016/j.jmb.2005.06.013. [DOI] [PubMed] [Google Scholar]
- 18.Jao C.C., Hegde B.G., Langen R. Roles of amphipathic helices and the bin/amphiphysin/rvs (BAR) domain of endophilin in membrane curvature generation. J. Biol. Chem. 2010;285:20164–20170. doi: 10.1074/jbc.M110.127811. [DOI] [PMC free article] [PubMed] [Google Scholar]
- 19.Zimmerberg J., Kozlov M.M. How proteins produce cellular membrane curvature. Nat. Rev. Mol. Cell Biol. 2006;7:9–19. doi: 10.1038/nrm1784. [DOI] [PubMed] [Google Scholar]
- 20.Zimmerberg J., McLaughlin S. Membrane curvature: how BAR domains bend bilayers. Curr. Biol. 2004;14:R250–R252. doi: 10.1016/j.cub.2004.02.060. [DOI] [PubMed] [Google Scholar]
- 21.Bhatia V.K., Madsen K.L., Stamou D. Amphipathic motifs in BAR domains are essential for membrane curvature sensing. EMBO J. 2009;28:3303–3314. doi: 10.1038/emboj.2009.261. [DOI] [PMC free article] [PubMed] [Google Scholar]
- 22.Campelo F., Fabrikant G., Kozlov M.M. Modeling membrane shaping by proteins: focus on EHD2 and N-BAR domains. FEBS Lett. 2010;584:1830–1839. doi: 10.1016/j.febslet.2009.10.023. [DOI] [PubMed] [Google Scholar]
- 23.Campelo F., McMahon H.T., Kozlov M.M. The hydrophobic insertion mechanism of membrane curvature generation by proteins. Biophys. J. 2008;95:2325–2339. doi: 10.1529/biophysj.108.133173. [DOI] [PMC free article] [PubMed] [Google Scholar]
- 24.Cui H.S., Ayton G.S., Voth G.A. Membrane binding by the endophilin N-BAR domain. Biophys. J. 2009;97:2746–2753. doi: 10.1016/j.bpj.2009.08.043. [DOI] [PMC free article] [PubMed] [Google Scholar]
- 25.Ayton G.S., Lyman E., Voth G.A. New insights into BAR domain-induced membrane remodeling. Biophys. J. 2009;97:1616–1625. doi: 10.1016/j.bpj.2009.06.036. [DOI] [PMC free article] [PubMed] [Google Scholar]
- 26.Mizuno N., Jao C.C., Steven A.C. Multiple modes of endophilin-mediated conversion of lipid vesicles into coated tubes: implications for synaptic endocytosis. J. Biol. Chem. 2010;285:23351–23358. doi: 10.1074/jbc.M110.143776. [DOI] [PMC free article] [PubMed] [Google Scholar]
- 27.Hokanson D.E., Ostap E.M. Myo1c binds tightly and specifically to phosphatidylinositol 4,5-bisphosphate and inositol 1,4,5-trisphosphate. Proc. Natl. Acad. Sci. USA. 2006;103:3118–3123. doi: 10.1073/pnas.0505685103. [DOI] [PMC free article] [PubMed] [Google Scholar]
- 28.Mathivet L., Cribier S., Devaux P.F. Shape change and physical properties of giant phospholipid vesicles prepared in the presence of an AC electric field. Biophys. J. 1996;70:1112–1121. doi: 10.1016/S0006-3495(96)79693-5. [DOI] [PMC free article] [PubMed] [Google Scholar]
- 29.Heinrich M., Tian A., Baumgart T. Dynamic sorting of lipids and proteins in membrane tubes with a moving phase boundary. Proc. Natl. Acad. Sci. USA. 2010;107:7208–7213. doi: 10.1073/pnas.0913997107. [DOI] [PMC free article] [PubMed] [Google Scholar]
- 30.Tian A., Baumgart T. Sorting of lipids and proteins in membrane curvature gradients. Biophys. J. 2009;96:2676–2688. doi: 10.1016/j.bpj.2008.11.067. [DOI] [PMC free article] [PubMed] [Google Scholar]
- 31.Tian A.W., Capraro B.R., Baumgart T. Bending stiffness depends on curvature of ternary lipid mixture tubular membranes. Biophys. J. 2009;97:1636–1646. doi: 10.1016/j.bpj.2009.07.012. [DOI] [PMC free article] [PubMed] [Google Scholar]
- 32.Heinrich M.C., Capraro B.R., Baumgart T. Quantifying membrane curvature generation of Drosophila amphiphysin N-BAR domains. J. Phys. Chem. Lett. 2010;1:3401–3406. doi: 10.1021/jz101403q. [DOI] [PMC free article] [PubMed] [Google Scholar]
- 33.Crank J. Oxford University Press; New York: 2004. The Mathematics of Diffusion. [Google Scholar]
- 34.Arkhipov A., Yin Y., Schulten K. Four-scale description of membrane sculpting by BAR domains. Biophys. J. 2008;95:2806–2821. doi: 10.1529/biophysj.108.132563. [DOI] [PMC free article] [PubMed] [Google Scholar]
- 35.Blood P.D., Voth G.A. Direct observation of Bin/amphiphysin/Rvs (BAR) domain-induced membrane curvature by means of molecular dynamics simulations. Proc. Natl. Acad. Sci. USA. 2006;103:15068–15072. doi: 10.1073/pnas.0603917103. [DOI] [PMC free article] [PubMed] [Google Scholar]
- 36.Baumgart T., Capraro B.R., Das S.L. Thermodynamics and mechanics of membrane curvature generation and sensing by proteins and lipids. Annu. Rev. Phys. Chem. 2011;62:483–506. doi: 10.1146/annurev.physchem.012809.103450. [DOI] [PMC free article] [PubMed] [Google Scholar]
- 37.Capraro B.R., Yoon Y., Baumgart T. Curvature sensing by the epsin N-terminal homology domain measured on cylindrical lipid membrane tethers. J. Am. Chem. Soc. 2010;132:1200–1201. doi: 10.1021/ja907936c. [DOI] [PMC free article] [PubMed] [Google Scholar]
- 38.Sorre B., Callan-Jones A., Roux A. Nature of curvature coupling of amphiphysin with membranes depends on its bound density. Proc. Natl. Acad. Sci. USA. 2012;109:173–178. doi: 10.1073/pnas.1103594108. [DOI] [PMC free article] [PubMed] [Google Scholar]
- 39.Domanov Y.A., Aimon S., Bassereau P. Mobility in geometrically confined membranes. Proc. Natl. Acad. Sci. USA. 2011;108:12605–12610. doi: 10.1073/pnas.1102646108. [DOI] [PMC free article] [PubMed] [Google Scholar]
- 40.Daniels D.R., Turner M.S. Diffusion on membrane tubes: a highly discriminatory test of the Saffman-Delbruck theory. Langmuir. 2007;23:6667–6670. doi: 10.1021/la0635000. [DOI] [PubMed] [Google Scholar]
- 41.Leibler S. Curvature instability in membranes. J. Phys. 1986;47:507–516. [Google Scholar]
- 42.Seifert U., Berndl K., Lipowsky R. Shape transformations of vesicles: phase diagram for spontaneous-curvature and bilayer-coupling models. Phys. Rev. A. 1991;44:1182–1202. doi: 10.1103/physreva.44.1182. [DOI] [PubMed] [Google Scholar]
- 43.Lipowsky R., Dobereiner H.G. Vesicles in contact with nanoparticles and colloids. Europhys. Lett. 1998;43:219–225. [Google Scholar]
- 44.Bukman J., Yao J.H., Wortis M. Stability of cylindrical vesicles under axial tension. Phys. Rev. E. 1996;54:5463–5468. doi: 10.1103/physreve.54.5463. [DOI] [PubMed] [Google Scholar]
- 45.Li Y.H., Lipowsky R., Dimova R. Membrane nanotubes induced by aqueous phase separation and stabilized by spontaneous curvature. Proc. Natl. Acad. Sci. USA. 2011;108:4731–4736. doi: 10.1073/pnas.1015892108. [DOI] [PMC free article] [PubMed] [Google Scholar]
- 46.Henne W.M., Kent H.M., McMahon H.T. Structure and analysis of FCHo2 F-BAR domain: a dimerizing and membrane recruitment module that effects membrane curvature. Structure. 2007;15:839–852. doi: 10.1016/j.str.2007.05.002. [DOI] [PubMed] [Google Scholar]
- 47.Settles E.I., Loftus A.F., Parthasarathy R. The vesicle trafficking protein Sar1 lowers lipid membrane rigidity. Biophys. J. 2010;99:1539–1545. doi: 10.1016/j.bpj.2010.06.059. [DOI] [PMC free article] [PubMed] [Google Scholar]
- 48.Bevington P.R., Robinson D.K. McGraw-Hill; Boston: 2003. Data reduction and error analysis for the physical sciences. [Google Scholar]
Associated Data
This section collects any data citations, data availability statements, or supplementary materials included in this article.