

Abstract
Puffs are local Ca2+ signals that arise by Ca2+ liberation from the endoplasmic reticulum through concerted opening of tightly clustered inositol trisphosphate receptor/channels (IP3R). They serve both local signaling functions and trigger global Ca2+ waves. The numbers of functional IP3R within clusters differ appreciably between different puff sites, and we investigated how the probability of puff occurrence varies with cluster size. We imaged puffs in SH-SY5Y cells using total internal fluorescence microscopy, and estimated cluster sizes from the magnitude of the largest puff observed at each site relative to the signal from a single channel. We find that the initial triggering rate of puffs following photorelease of IP3, and the average frequency of subsequent repetitive puffs, vary about linearly with cluster size. These data accord well with stochastic simulations in which opening of any individual IP3R channel within a cluster triggers a puff via Ca2+-induced Ca2+ release. An important consequence is that the signaling power of a puff site (average amount of Ca2+ released per puff × puff frequency) varies about the square of cluster size, implying that large clusters contribute disproportionately to cellular signaling and, because of their higher puff frequency, preferentially act as pacemakers to initiate Ca2+ waves.
Introduction
Puffs are transient, localized intracellular Ca2+ elevations that arise from the liberation of Ca2+ ions sequestered in the endoplasmic reticulum (ER) through the concerted opening of tightly clustered inositol trisphosphate (IP3) receptor/channels (IP3R) (1,2). In addition to serving local signaling functions in their own right, calcium puffs constitute the building blocks for saltatory propagation of global Ca2+ waves, and are the triggers that initiate Ca2+ waves (3,4). It is thus important to understand the factors that regulate the triggering of puffs themselves, because they are ultimately responsible for shaping IP3-mediated cellular Ca2+ signals (5).
The opening of an IP3R requires the binding of both IP3 and Ca2+ to activating sites on the cytosolic face of the tetrameric receptor (6). The latter endows IP3-mediated signaling with a regenerative property of Ca2+-induced Ca2+ release (CICR), because Ca2+ ions released from one IP3R channel diffuse into the cytosol and promote the opening of neighboring channels. Furthermore, the spatial patterns of Ca2+ signals are shaped by the localization of IP3R within clusters a few hundred nm across, that are typically separated a few μm from one another (7,8). Depending upon conditions such as the concentration of IP3 (3) and presence of cytosolic Ca2+ buffers (9), CICR may remain localized to a single cluster to generate a puff, or propagate as a Ca2+ wave by a fire-diffuse-fire mechanism between clusters (10).
Analogous to the way in which a puff may trigger a wave, we have proposed that the puff is itself triggered by the stochastic opening of a single IP3R channel within the cluster (11). Factors that determine the occurrence of puffs thus include the probability that Ca2+ ions released by one channel will evoke CICR at adjacent IP3R channels in the cluster; the number of channels present in the cluster; and the open probability of each channel (12). The latter, in turn, is a function of the concentrations of IP3 and Ca2+ (6). Concordant with this model, and as would be intuitively expected, the observed frequency of puffs at a given site increases with increasing [IP3] (1,13), and the latency to the first puff evoked at a site following photorelease of IP3 shortens (12).
Here, we consider the complementary issue of how puff triggering is determined by the number of IP3R that are present in a cluster. This question is of physiological, as well as theoretical importance, because observations that the amplitudes of Ca2+ fluorescence signals vary appreciably between different puff sites, even in the same cell, point to considerable heterogeneity in numbers of IP3R within different clusters (1,14). Until recently it was difficult to quantify from fluorescence images the number of channels that opened to generate a puff. However, by applying total internal reflection fluorescence (TIRF) microscopy in conjunction with cytosolic loading of the slow Ca2+ buffer EGTA it has now become possible to resolve fluorescence signals corresponding to the opening of individual channels, and to visualize steps during the decay of puffs that reflect the closings of individual IP3R channels (2). Hence, we are able to determine the peak number of channels open during a puff by using the unitary single-channel amplitude as a yardstick by which to calibrate the peak fluorescence amplitude, and by directly counting the total number of closing steps. The largest puff observed at a site then provides a minimal estimate of the number of IP3R channels in that cluster (the cluster size).
Our principle experimental findings are that the probability with which puffs are triggered at a given site increases in direct proportion to the number of IP3R channels estimated to be in that cluster, and as a corollary, that the signaling power of a puff site in terms of cumulative Ca2+ liberation varies about the square of the number of channels. These results are supported by model simulations that replicate the observed relationships between puff frequency and latency on cluster size, and show that puff frequency and latency are determined by the mean number of activatable receptors within a cluster that have bound IP3 and require only the stochastic binding of activating Ca2+ ions to open.
Methods
Cell culture and preparation of cells for imaging
Human neuroblastoma SH-SY5Y cells were cultured as described (13) in a mixture (1:1) of Ham's F12 medium and Eagle's minimal essential medium, supplemented with fetal calf serum (10%, v/v), and nonessential amino acids (1%, v/v). Cells were incubated at 37°C in a humidified incubator gassed with 95% air and 5% CO2, passaged every 2–3 days, and used for up to 20 passages. Four days before imaging, cells were harvested in phosphate-buffered saline without Ca2+ or Mg2+, and were added to petri dishes with glass coverslips as the base (MatTek, Ashland, MA) at a density of 3 × 10⁴ cells/ml. Cells were loaded with membrane-permeant esters of EGTA, Fluo-4, and ci-IP3 by incubation in Hepes-buffered saline (HBS; composition in mM): NaCl 135, KCl 5, MgSO4 1.2, CaCl2 2.5, Hepes 5, glucose 10, pH 7.4. Cells were first loaded into HBS containing ciIP3-PM (1 μM, SiChem, Bremen, Germany) at 20°C for 45 min, and then with ciIP3-PM (1 μM) and Fluo-4-AM (5 μM; Invitrogen, Carlsbad, CA) for 45 min, and finally with HBS containing EGTA-AM for 45 min (5 μM, Invitrogen) before washing with HBS ready for imaging.
TIRF microscopy
Changes in intracellular free Ca2+ concentration ([Ca2+]i) were imaged using a home-built TIRF microscope system based on an Olympus IX 70 microscope with a ×60 TIRF objective (NA, 1.45) (2,13). Fluo-4 fluorescence was excited at 488 nm, and images of emitted fluorescence (λ > 510 nm) were captured at a resolution of 128 × 128 pixels (1 pixel = 0.33 μm) at 500 frames s−1 using a Cascade 128 EMCCD camera (Roper Scientific, Tucson, AZ). Photolysis of ciIP3 was evoked by flashes of ultraviolet light (350–400 nm) from an arc lamp adjusted to uniformly irradiate a region slightly larger than the imaging frame. Except for one experiment (see Fig. 3 E), cells in a given imaging field were exposed to only a single flash. We note that photolysis of ciIP3 does not release IP3 itself, but an analog (iIP3) in which the 2- and 3-OH groups of IP3 are linked by an isopropylidene group, which is more metabolically stable and evokes puff activity continuing for a few minutes. Image data were acquired and stored as stack files using MetaMorph (Universal Imaging/Molecular Devices, Sunnyvale, CA).
Figure 3.
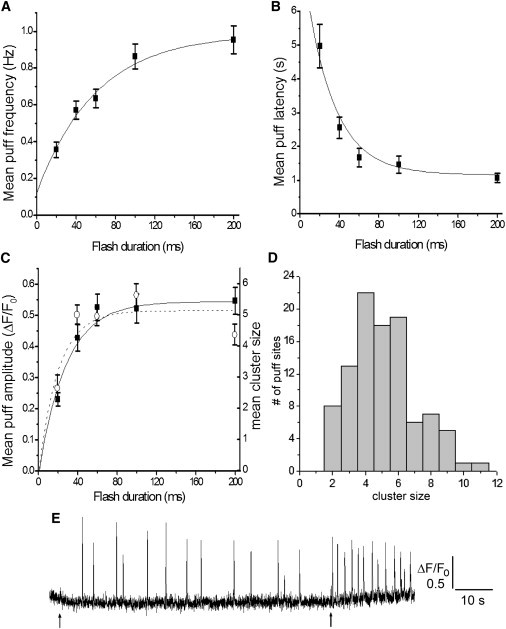
Dependence of mean amplitude and kinetic parameters of puffs on the duration of the photolysis flash. Data in A–C are pooled from all (n = 155) puff sites irrespective of their size; error bars indicate mean ± 1 SE; curves (exponential regression fits) are drawn merely to guide the eye. (A) The puff frequency at a site was calculated as the average of the instantaneous frequencies corresponding to intervals between successive puffs. The graph plots mean frequencies evoked in response to photolysis flashes with durations of 20, 40, 60, 100, and 200 ms (respective numbers of puff sites = 11, 36, 37, 40, and 31). (B) Corresponding measurements of mean first-puff latency, plotted as a function of flash duration. (C) Means of the amplitudes of the largest puffs observed at each given site as a function of flash duration. Amplitudes are expressed as both raw fluorescence amplitude (ΔF/F0: solid squares, left axis), and as counts of the estimated numbers of channels contributing to the puff (cluster size: open circles, right axis). (D) Histogram showing the distribution of cluster sizes among 101 puff sites in response to 60, 100, and 200 ms photolysis flashes. (E) Representative fluorescence trace showing puffs arising at a single site in response to an initial photolysis flash of 60 ms duration, followed by a second flash of 70 ms duration ∼80 s later. The frequency of puffs increased markedly following the second flash, whereas the puff amplitude did not.
Image analysis
Image processing and analysis were done offline using MetaMorph v.7.5. After subtraction of the camera black offset level, image sequences were processed by dividing each frame by an average of ∼50 frames captured before the photolysis flash, so that fluorescence represents a ratio (ΔF/F0) of the fluorescence change (ΔF) at each pixel relative to the mean resting fluorescence (F0) before stimulation. Fluorescence traces such as those in Figs. 1 and 2 A were derived by measuring the average signal within 1 × 1 μm (3 × 3 pixel) regions of interest centered on visually identified Ca2+ release sites that were selected as being sufficiently isolated to avoid bleed-through of signals from adjacent sites. Measurements of the timing and amplitude of events were made by visual inspection of these traces.
Figure 1.
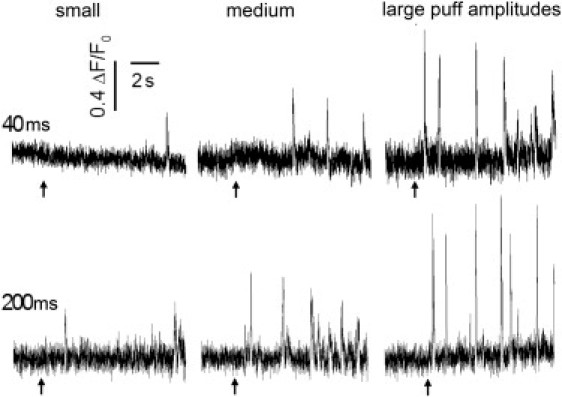
Variability in puff sizes and kinetics among different puff sites. Traces show representative fluorescence records from sites giving small, medium, and large puffs (left to right), evoked by photolysis flashes with durations as indicated in ms. Each trace was obtained from a different puff site, and shows average fluorescence within a 1 × 1 μm region of interest expressed as a ratio of fluorescence change (ΔF) relative to the resting fluorescence (F0) before stimulation. Traces were smoothed by a running average of 3 data points, and were corrected for baseline drift. Arrows mark times of the photolysis flashes.
Figure 2.
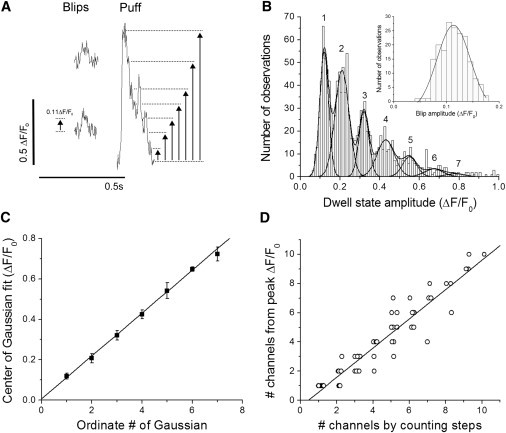
Estimating the numbers of IP3R channels contributing to puffs. (A) Traces show examples of blips (left) and a large puff (right) on an expanded timescale. Dwell-state amplitudes were measured from the baseline (F0) to visually identified step levels (arrows). (B) Inset shows distribution of blip amplitudes among 187 events; mean = ΔF/F0 0.114 ± 0.002 SE. The curve is a Gaussian fit with center = ΔF/F0 0.113 and standard deviation 0.063. Main graph shows the distribution of amplitudes for 1243 dwell-state levels derived from 155 puff sites. The upper curve is a multi-Gaussian distribution fitted to the data, formed from the sum of 7 individual Gaussian distributions with respective means and standard deviations of ΔF/F0 (1): 0.121 ± 0.043 (2); 0.212 ± 0.069 (3); 0.318 ± 0.050 (4); 0.423 ± 0.088 (5); 0.552 ± 0.072 (6); 0.67 ± 0.093; and (7) 0.780 ± 0.093. (C) Solid symbols plot the center values (mean ± 1 SE) of the individual Gaussian distributions against their ordinate number, derived by fitting to an expanded data set of 3230 dwell-state levels from 252 puff sites. The line is a regression fit with a slope of ΔF/F0 = 0.107 ± 0.01 per unitary step level. (D) Scatter plot of estimated numbers of channels open at the peak of a puff obtained by directly counting unitary steps during the falling phase (x axis), and by dividing the peak fluorescence amplitude of that puff by the mean blip amplitude (y axis). Measurements are from 62 puffs. Data on the y axis are rounded to the nearest integer value, and for clarity symbols have been displaced slightly along the x axis to reveal overlapping points. The line is a regression fit, with a slope of 1.002 ± 0.04 and a correlation coefficient R = 0.95; P < 0.0001.
Stochastic puff modeling
The behavior of clusters containing some number, N, of IP3R channels was stochastically simulated as previously described (15,16), based on the De-Young-Keizer (DYK) scheme of the receptor subunit (17).
In brief, the spatiotemporal dynamics of cytosolic Ca2+ (c) were mathematically modeled by the following reaction-diffusion equation:
| (1) |
where D is the effective diffusion coefficient for calcium, Jcluster represents the calcium flux into the cytosol from the ER through a cluster of N IP3R, of which No are open at any given instant. JSERCA describes the action of SERCA pumps and Jleak is the leak from the ER into the cytosol. The cluster is placed at the center of the grid at x0, mathematically realized by using the delta function. A homogenous spread of the pump and leak flux terms are assumed. Expressions for Jcluster, JSERCA, and Jleak are described in references (15,16).
We modified the original DYK model (which assumed three subunits) in light of the known tetrameric structure of the IP3R. Each of four independent subunits has three binding sites, one for activation by IP3, one for activation by Ca2+, and a third for inhibition of the subunit by Ca2+. Transitions between subunit states are stochastic in nature and governed by binding/unbinding rates of IP3 and Ca2+. The channel is open when three or four subunits are in the active configuration (binding IP3 and activating Ca2+, but not inactivating Ca2+). Eq. 1 was stochastically simulated at 25 μs time steps on a two-dimensional membrane of 5 × 5 μm, discretized into a grid of size δx = 100 nm. Equations were numerically solved using a fully explicit forward difference partial differential equation solver. No flux was allowed to enter or exit the boundaries of the area being simulated. All N channels were assigned to a single, central grid element, and all channels experienced the same local [Ca2+]. Parameters in Table 1 were chosen to provide a close simulation of the experimental data, but should not necessarily be taken to represent physiological values. Basal resting free cytosolic [Ca2+] was 53 nM. Further discussion of parameter selections is given in (15,16).
Table 1.
Modeling parameters
| Parameter∗/Units | Value | Description |
|---|---|---|
| vchannel s−1 | 2000 | Maximum channel flux |
| vleak s−1 | 0.0615 | [Ca2+] leak flux |
| vSERCAμMs−1 | 45 | Maximum [Ca2+] update |
| kpμM | 0.03 | Activation constant for calcium pump |
| cERμM | 500 | Lumenal [Ca2+] |
| D μm2s−1 | 25 | Effective [Ca2+] diffusion coefficient |
| p μM | 3 | IP3 concentration |
| a1 (μMs)−1 | 400.0 | IP3 activation association constant |
| a2 (μMs)−1 | 3.0 | Ca2+ inhibition association constant |
| a3 (μMs)−1 | 400.0 | IP3 activation association constant |
| a4 (μMs)−1 | 4.0 | Ca2+ inhibition association constant |
| a5 (μMs)−1 | 40.0 | Ca2+ activation association constant |
| d1 μM | 0.13 | Affinity, IP3 activation |
| d2 μM | 1.049 | Affinity, Ca2+ inhibition |
| d3 μM | 0.9434 | Affinity, IP3 activation |
| d4 μM | 0.1445 | Affinity, Ca2+ inhibition |
| d5 μM | 0.247 | Affinity, Ca2+ activation |
| N | 2–10 | Number of IP3R in a cluster |
See (15–17) for further explanation of parameter nomenclature and theoretical considerations for parameter selection. Though individual binding/unbinding rates have been adjusted to optimize model fits to experimental data, affinities (d1–d4) are maintained as in the original DYK model (17). Detailed balance is maintained.
For measurements of puff latency, subunits were allowed to equilibrate at the resting Ca2+ level, and [IP3] was stepped from zero to various fixed concentrations. The time to occurrence of a first puff (defined as simultaneous opening of ≥2 channels for consistency with the identification criterion used for analyzing experimental records) was determined, the program was reset to the initial conditions, and simulations were repeated 1000 times to obtain a mean latency for given combinations of N and [IP3]. To determine puff frequencies the model was run continuously for a simulated time of 1000 s with [IP3] maintained at fixed levels, and interpuff intervals were determined as the times (peak-to-peak) between successive puffs involving openings of ≥2 channels. Measurement of numbers of activatable channels were made by taking the mean number of channels in the cluster for which three or four subunits had IP3 (but not inactivating Ca2+) bound during 9 ms periods immediately preceding each puff.
We also performed simulations using a six-state model of the IP3R subunit which, in contrast to the DYK model, involves binding of activating Ca2+ only if IP3 is first bound, thereby enforcing sequential binding. Details of the subunit model are presented in (16), and simulations were otherwise performed as previously described for the DYK model.
Results
Puffs evoked by photorelease of iIP3 in neuroblastoma cells
We studied the autonomous activity of individual Ca2+ puff sites in SH-SY5Y cells by inhibiting Ca2+-mediated cluster-cluster interactions (Ca2+ waves) by cytosolic loading of the slow Ca2+ buffer EGTA (13), and imaged local Ca2+ events evoked by photorelease of iIP3 from a caged precursor using TIRF microscopy (2). Fig. 1 shows representative fluorescence traces of responses at individual puff sites to photorelease of differing amounts of iIP3 by flashes of constant intensity and short (40 ms) or long (200 ms) duration. The traces are grouped (left to right) according to the amplitude of the largest puff observed at each site. Qualitatively, it is apparent that greater photorelease of iIP3 resulted in a proportionally higher frequency of puffs at all sites, and to a shortening in the latency from the time of the photolysis flash to the occurrence of the first puff. Moreover, for each of the flash durations, the puff frequency was typically greater at sites that showed large puffs, and the first-puff latency was shorter.
Estimating cluster size from maximal puff amplitudes
To estimate the number of functional IP3R channels contributing to a puff, we examined the fluorescence signals on an expanded timescale to visually identify and measure stepwise transitions that we interpret to reflect the gating of individual IP3R channels (2). We first identified small square events (blips), like those illustrated in the left panel of Fig. 2 A, which are proposed to arise through the opening of single IP3R channels (2). Measurements of 187 events showed a Gaussian distribution of blip amplitudes (Fig. 2 B, inset), with a mean of ΔF/F0 = 0.114 ± 0.002. We then measured the amplitudes of stepwise dwell-state levels, visually identified on the falling phases of puffs as illustrated in the right panel of Fig. 2 A. The resulting distribution of dwell-state amplitudes displayed a multimodal distribution, which fit well to the sum of 7 Gaussian functions with progressively increasing mean amplitudes and decreasing areas (numbers of observations) (Fig. 2 B, main graph). The mean of the first Gaussian (ΔF/F0 = 0.12) corresponded closely to that of the blips, and the means of the successive Gaussian fits incremented as almost integer multiples. To examine this further, we plot in Fig. 2 C the center value of each Gaussian fit against the ordinate number of that Gaussian (first, second, third, etc.; as numbered in Fig. 2 B). The measurements in Fig. 2 B were obtained from the data set of events used for analysis in the remainder of this work, which contained too few events to reliably fit >5 Gaussians. Fig. 2 C instead shows measurements from a larger data set, to which we were able to fit 7 Gaussians. The results show that the amplitudes of discrete dwell-state levels during puffs (as determined from the means of Gaussian fits) increment linearly, and the slope of a regression fit corresponds to ΔF/F0 = 0.107 per quantal step. Thus, the fluorescence signals generated by synchronous opening of multiple channels during a puff scale linearly with the number of open channels up to at least n = 7. Moreover, the widths (standard deviations) of the Gaussian fits were narrow and increased only slightly with an increasing numbers of open channels (Fig. 2 B, main graph), so there is relatively little overlap between adjacent Gaussian distributions even at higher values of n. We therefore conclude that it is possible to reliably estimate the number of channels open at the peak of a puff by dividing the peak fluorescence amplitude (ΔF/F0) by that of the single-channel blip: taken as ΔF/F0 = 0.11 in our experiments. To further validate this method, we directly counted the numbers of unitary steps during the falling phases of well-resolved puffs and compared these estimates with those obtained from the peak amplitudes of the same puffs. Fig. 2 D presents a scatter plot of channel numbers estimated by these two approaches, revealing a close agreement. A regression fit to the data gave a slope of 1.002, and a correlation coefficient R = 0.95; P < 0.0001.
To estimate the number of functional IP3R channels present in a particular cluster we then took the largest puff observed at that cluster and derived the number of simultaneously open channels from the fluorescence amplitude at the peak of the puff. In the ideal case of an infinitely long train of puffs with stochastically varying amplitudes (numbers of open channels), it follows that the largest events must reflect opening of all functional channels present in the cluster. However, our records necessarily sampled only a limited number of events and, especially in the case of sites showing a low frequency of puffs (typically 2 or 3 puffs per 10 s record), the small sample size would tend to underestimate the maximal puff amplitude. A further complication is that sites that responded with a high frequency of puffs to strong flashes sometimes showed a systematic run-down in puff amplitudes over the first few events. The first puff would often be the largest observed at that site, effectively reducing the sample size. To evaluate the extent of these errors, we took random samples of n = 1, 2, or 3 consecutive puffs from 11 traces each containing >10 puffs that did not show any systematic rundown. The mean maximal puff sizes derived from these samples were respectively 83%, 90%, and 91% of that obtained sampling of all puffs in the records. Thus, sizes of small clusters showing low frequencies of puffs would likely be underestimated on average by only around 10–15%.
Dependence of puff kinetics and amplitude on flash duration
To quantify the kinetics of puff occurrence at a given site, we determined the mean interpuff interval from the intervals between successive puffs, and calculated the mean puff frequency as an average of the instantaneous frequencies (1/interval) corresponding to each interval. Puff latency was measured as the time from the onset of the photolysis flash to the onset of the first puff. For these analyses we defined puffs as events involving a synchronous opening of two or more channels (ΔF/F0 > 0.15), and excluded blips because of the likelihood that an appreciable proportion of these small events would have been undetectable above the noise floor.
Fig. 3 A plots the mean puff frequency across 155 puff sites (in 63 SH-SY5Y cells) as a function of photolysis flash duration. This shows a graded relationship, with puff frequency approaching a maximal value of ∼1 Hz with the strongest (200 ms duration) flash. Fig. 3 B shows corresponding measurements of mean puff latencies. Again, these show a progressive relationship, with the latency shortening with increasing flash duration. In Fig. 3 C we plot the dependence of puff amplitude on flash duration in terms of the fluorescence amplitude of the largest puff at a site, and as the estimated number of channels simultaneously open during that puff. Both measures follow a similar relationship, but one which is appreciably steeper than the dependence of puff frequency and latency upon flash duration (compare Fig. 3, A and C).
In contrast to the progressive changes in kinetic properties, puff amplitudes grew steeply with increasing flash duration from 20 to 40 ms, but then showed little or no additional increase as flash durations were lengthened up to 200 ms. The disconnect between puff frequency and amplitude is further illustrated in Fig. 3 E, showing the response of a representative puff site to an initial photolysis flash followed by a second flash to cause photorelease of iIP3 that would summate with the (slowly metabolized) iIP3 remaining in the cytosol following the first flash. The second flash evoked a marked increase in puff frequency, but without any appreciable increase in puff amplitude.
This result further indicates that the saturation of puff amplitudes with stronger flashes did not result from consumption of ciIP3: a conclusion further supported by other experiments where identical, paired strong photolysis flashes delivered to the same cells at an interval of 1 h evoked puffs (n = 11 puff sites) of similar mean amplitudes (response to second flash 108 ± 7% of that to the first). Moreover, puff frequencies in response to the second flash were similar to those evoked by the first flash (0.76 +0.11 Hz following first flash, 0.58 ± 0.12 Hz following second flash), demonstrating that the plateau in the relationship between flash duration and puff frequency in Fig. 3 A also did not occur as a result of exhaustion of available caged iIP3.
Given that puff amplitudes were close to maximal for all flash durations of 60 ms and longer, we pooled measurements from the 60, 100, and 200 ms records to obtain a larger data set from which to estimate cluster sizes on the basis of the largest puff observed at each site. Fig. 3 D shows the resulting distribution of cluster sizes among the population of 101 puff sites examined. Similar to our previous findings in SH-SY5Y cells (2) this revealed a wide spread, with a majority of sites showing puffs involving a maximum of 4 channels, but others with as few as 2 or as many as 11 channels. We did not include single-channel events (blips) in this analysis, because difficulty in discriminating these small events from background noise likely would have led to an appreciable undercount.
Dependence of puff frequency, interpuff interval, and latency on cluster size
We then used the data set of puff sites in Fig. 3 D to examine how puff triggering varies with cluster size. Fig. 4, A–C, show plots of puff frequency (Fig. 4 A); interpuff interval (Fig. 4 B); and first-puff latency (Fig. 4 C) against the estimated cluster size. There is considerable scatter in the raw data from individual puff sites (small gray symbols), as expected for stochastic events. However, regression analysis revealed significant correlations. The solid line in Fig. 4 A is a linear regression fit to the raw data, and the solid curves in Fig. 4, B and C are regression fits to reciprocal relationships (e.g., cluster size versus 1/latency in Fig. 4 C). In all cases, dotted curves indicate 95% confidence intervals.
Figure 4.
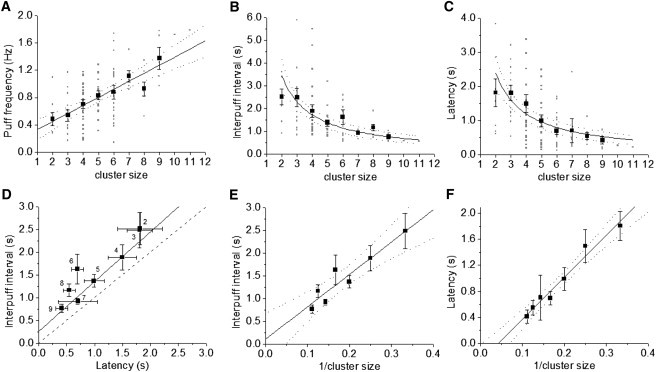
Dependence of puff frequencies and latencies on cluster size. Data are from 101 puff sites, pooling responses obtained with 60, 100, and 200 ms photolysis flashes. Measurements from individual puff sites are plotted as small gray squares, and mean values as large black squares. Fitted relationships are shown in black, with 95% confidence intervals represented by dotted lines. (A) Dependence of puff frequency on cluster size. Data are fit with a linear regression to individual puff sites. Note that the average puff frequency at a given site was calculated from the instantaneous frequency of successive puffs, so the data are not simply the reciprocal of that in B. (B) Corresponding dependence of interpuff interval on cluster size. The curve is a reciprocal fit to individual puff sites. (C) Mean puff latency as a function of cluster size, showing a reciprocal fit to individual puff sites. (D) Scatter plot of interpuff interval versus latency. Data points indicate mean ± 1 SE from clusters with sizes (number of channels contributing to the largest puff) as indicated. The black line is a linear regression fit to the mean values (R2 = 0.89). The dashed line indicates a one-to-one relationship. (E and F) Plots of respectively mean interpuff interval and first-puff latency as functions of reciprocal cluster size. Linear regressions are shown, together with 95% confidence intervals (dotted curves).
To better visualize the dependence of interpuff interval and first-puff latency on cluster size, we further show mean values from the pooled data (large black squares in Fig. 4, A–C). Fig. 4 A shows a plot of mean puff frequency as a function of cluster size among sites estimated to contain between 2 and 11 channels, and Fig. 4 B plots corresponding measurements of the mean interpuff intervals against cluster size. The puff frequency data closely follow a linearly increasing relationship with an estimated number of channels in the cluster, and the interpuff interval correspondingly shortened progressively with increasing cluster size. Fig. 4 C plots the mean latency from photorelease of iIP3 to the occurrence of the first puff at a site as a function of cluster size. Similar to the dependence of interpuff interval, this showed a progressive shortening with increasing cluster size, and the mean data fit well to a reciprocal relationship.
In Fig. 4 D, we plot the mean interpuff interval against the mean latency for sites with cluster sizes of N = 2, 3, 4…11, as indicated. A linear regression fit to the data yielded a slope of close to unity, but was displaced upward from a one-to-one relationship and intercepted the y (interpuff interval) axis at ∼0.25 s. On the assumptions that iIP3 is instantly photoreleased and that the binding of IP3 and Ca2+ ions to the IP3R is always in a stochastic equilibrium, a perfect 1:1 relationship with zero intercept would be predicted. (An intuitive explanation for this is that, given the preceding assumptions, the IP3R has no memory of prior events. Thus, the occurrence of the photolysis flash and the occurrence of any puff can be considered simply as random times at which a clock is started to record the interval until the next puff.) The displacement from a one-to-one relationship and the nonzero intercept thus indicate that some additional process contributes to the interpuff interval; most likely recovery from inhibition resulting from high local [Ca2+] during the puff (18).
Mean interpuff interval and latency vary as 1/cluster size
We had previously described that the mean initial puff latency following photorelease of IP3 varies in proportion to the reciprocal of the amount of IP3 released, and interpreted this in terms of the mean number of activatable channels within a cluster that have bound IP3 and which will thus open in response to stochastic binding of Ca2+ (12). In Fig. 4, E and F, we extend this analysis by replotting respectively the mean interpuff interval and the initial puff latency against 1/cluster size. Both of these measures closely follow a linear relationship with 1/cluster size, consistent with the notion that the probability of puff triggering is dependent on both the number of channels in a cluster and the proportion of those channels that are binding IP3.
Are puff sites functionally equivalent?
It is apparent from Fig. 4 A that there is a wide scatter in mean puff frequencies, even between sites estimated to have the same cluster size. We were therefore interested to determine whether this may reflect inherent functional differences between sites, or whether the variability resulted simply because each trace sampled only a small number of stochastically occurring puffs.
We analyzed the variation (standard deviation) among interpuff intervals at a given site, and compared this to the variation of interpuff intervals among different sites. We restricted analysis to records from sites that gave ≥7 puffs, and further narrowed these to a group of 17 sites with cluster sizes between 6 and 9. The standard deviation of intervals between puffs at a given site varied between 203 and 852 ms across the different sites, with a mean standard deviation of 535 ms. For comparison, we then took 17 samples, each containing seven randomly selected interpuff intervals from different sites. The standard deviation of interpuff intervals varied between 119 and 723 ms across the different samples, with a mean of 483 ms. Given that the mean standard deviation of interpuff intervals between different sites was not significantly greater than that of intervals between puffs at a given site, we conclude that if any systematic differences exist between clusters they are small and are masked by statistical variation in puff occurrence at a given site.
Model simulations
We compared our experimental findings with the predictions of a simulated model, using the De Young/Keizer binding scheme for the IP3R (17) in conjunction with a computationally inexpensive point-source approximation for local [Ca2+] at a cluster (15). Parameter values were chosen to provide an approximate fit to the experimental results, but our primary objective was to explore the relationship between cluster size and puff kinetics rather than to precisely replicate the data. Fig. 5, A and B, show the mean puff frequencies and latencies from simulations of clusters containing varying numbers N of IP3R from 2 to 10. These model predictions are in good agreement with our experimental findings in predicting a close to linear relationship between puff frequency and cluster size, and between puff latency and 1/cluster size; and with other modeling studies predicting a shortening in puff latency with increasing cluster size (12,19).
Figure 5.
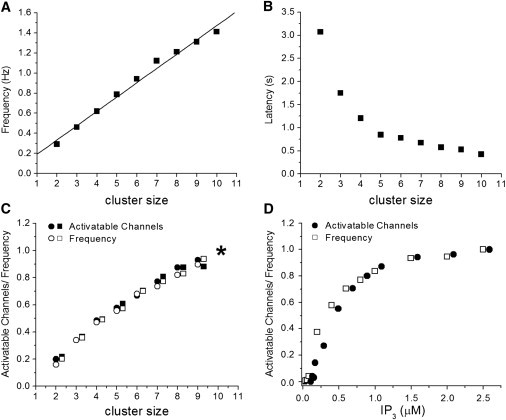
Results from stochastic model simulations employing a De Young/Keizer model of the IP3R to investigate how puff triggering varies as functions of cluster size and [IP3]. (A) Mean puff frequency plotted as a function of cluster size. Frequencies were determined from intervals between successive puffs evoked during 1000 s simulations with [IP3] held at 3 μM. Simulations were run for clusters containing N = 2, 3…10 IP3R; error bars are not shown in this and other panels because the standard errors were generally smaller than the symbol sizes. (B) Mean puff latency as a function of cluster size. Each data point is a mean from 1000 runs, in which [IP3] was stepped from 0 to 3 μM after 1 s, and the first-puff latency was determined as the subsequent time to when a puff involving simultaneous opening of ≥2 channels was observed. (C) Puff frequency correlates closely with the number of activatable channels. Open symbols show mean puff frequencies for different cluster sizes, determined as in A for separate simulation runs at IP3 concentrations of 0.8 μM (squares) and 3 μM (circles). Solid symbols indicate the mean numbers of channels in a cluster that were in an activatable state (with three or all subunits binding only IP3) during 9 ms preceding each puff. Data are normalized relative to the maximum frequency and number of activatable channels observed for a cluster size of 10 channels (asterisk). Data points for 0.8 and 3 μM IP3 are separated horizontally for clarity. (D). Analogous plot of normalized puff frequency (open squares) and number of activatable channels (solid circles) as functions of [IP3] for a simulated cluster containing 6 channels.
We also performed simulations employing a six-state sequential binding scheme for the IP3R (16). The results with this model (data not shown) closely matched those obtained with the DYK model. Thus, the simulation results in Fig. 5, A and B, are substantially independent of choice of any particular IP3 receptor model.
Having validated our experimental findings with a model in which the cluster size is explicitly known, we then tested the hypothesis that puff frequency is closely related to the mean number of activatable channels in a cluster immediately before puffs occurred. Fig. 5, C and D, show results of simulations in which puffs were recorded for 1000 s in the presence of a given, fixed [IP3]. Open squares plot the mean frequency of puffs throughout each run, and solid circles plot the mean number of activatable channels during 9 ms intervals immediately preceding each successive puff. Data are normalized so that the maximum frequency and maximum number of activatable channels in each panel are set to 1. Fig. 5 C shows results obtained varying the number of channels in the cluster while maintaining [IP3] fixed at 0.8 μM (circles) and 3 μM (squares). Fig. 5 D correspondingly shows results of simulating a cluster containing a fixed number of N = 6 channels, for various concentrations of [IP3]. In both cases, the relationships for puff frequency and number of activatable channels closely overlap one another.
Discussion
Puffs are local cytosolic Ca2+ signals that arise through the concerted openings of IP3R Ca2+ release channels that are organized in tight clusters in the ER membrane. Our principal finding here is that the probability of triggering local Ca2+ puffs varies as a close to linear function of the number of functional IP3R channels within a cluster. Specifically, both the triggering rate (1/mean latency) of the first puff evoked following photorelease of IP3 and the mean frequency of successive puffs in the subsequent train vary in linear proportion to the number of functional channels estimated to be at a site.
A physiologically important consequence of this result is that the signaling power of a puff site (defined as the mean amount of Ca2+ liberated per unit time at given concentrations of IP3 and basal cytosolic Ca2+) will increase on average as about the square of the number of IP3R channels present. For example, doubling the number of channels will both increase the mean frequency of puffs, and double the Ca2+ flux during puffs because on average twice as many channels open. We estimate that a majority of puff sites in SH-SY5Y cells are composed of clusters containing around 4–6 functional IP3R channels, but there is a wide variability even between sites in a given cell, with a few clusters containing 10 or more functional channels and others with only two or three. Although sparse in number, the largest clusters may then be expected to contribute disproportionately to local Ca2+ signaling in a cell and, because of their higher average frequency of puffs, also serve preferentially as pacemakers to initiate global Ca2+ waves (20). In addition to the variability in cluster size within cells of the same type, there is a wide variability in mean cluster sizes across different cell types and species. For example, puffs in HeLa cells typically involve only 2 or 3 IP3R channels (21), whereas puffs in immature Xenopus oocytes are estimated to involve around 20 channels (7). Hence, variation in cluster size may serve as a powerful mechanism, in addition to factors such as expression of Ca2+ buffers with varying properties (9), by which cells tailor the spatiotemporal patterning of Ca2+ signals to their particular needs. For example, a dynamic remodeling of the ER during maturation of Xenopus oocytes has been proposed to sensitize IP3-mediated Ca2+ signaling by increasing the local density of IP3R (19).
Overall, our findings experimentally validate and extend the conclusion of a modeling study by Shuai and Jung (22) indicating that a clustered organization of IP3Rs is optimal for cellular signaling. Because of the square-law dependence of Ca2+ liberation on the number of IP3R channels in a cluster, a given number of channels will yield a much larger signal if arranged into clusters where they may activate one another via CICR, rather than if distributed uniformly as lone channels, functionally uncoupled from one another.
Our approach of using the largest puff at a site to estimate the number of channels in that cluster is subject to several uncertainties, as considered in the Results. For example, errors would be introduced during the calibration of fluorescence signals in terms of multiples of the single channel signal, and because the largest possible puff may have been be missed because of the limited number of puffs sampled. Nevertheless, the largest observed puff provides a minimal measure of the number of IP3R present in a cluster, and on average is expected to be proportional—even if not precisely equal—to the true cluster size. This assumption is supported by the close correspondence between our experimental data where cluster size was estimated from puff amplitude with model simulations in which the numbers of IP3R physically present in a cluster were explicitly defined.
Our experimental results and simulations largely accord with a simple scheme, wherein Ca2+ released by the opening of a single IP3R channel triggers the opening of other channels in a cluster to generate a puff (12). The occurrence of a puff is then determined by when any of one of the N channels in the cluster happen to open. On average that is determined by the mean time, τchannel, between openings of an individual channel, in turn, a function of IP3 and basal resting Ca2+ concentrations. Thus, the mean time, τcluster, before a puff is triggered is given by τcluster = τchannel/N, and the mean frequency of puffs is given by N/τchannel.
This description applies to mean behaviors averaged over many events. However, because puff triggering arises at the single-molecule level, the occurrence of individual puffs is stochastic. If channels are assumed to be in a dynamic equilibrium with respect to binding of IP3 and Ca2+, the probability of a channel opening would be the same at any given time or at any other time, yielding an exponential distribution of latencies to puff occurrence (23). Indeed, both the experimental (Fig. 6, A and B), and simulated (Fig. 6, C and D), distributions of both initial puff latency and interpuff intervals fit well to exponentials with similar time constants, when matched for cluster size and [IP3]. Thus, puff triggering appears to be largely determined by the stochastic binding of activating Ca2+ ions. The puff latency might be expected to be further determined by the binding of IP3 following an abrupt increase in concentration during the photolysis flash. However, rapid concentration jump studies of single IP3R in the presence of optimal [Ca2+] show that this process is rapid (<100 ms) (24), and likely would not be evident on the timescale of our recordings. In the case of the interpuff interval, IP3 binding is in equilibrium, but the recovery of IP3R from a refractory state induced by Ca2+ inhibition during the preceding puff introduces an additional term into the interval distribution (18,23). This likely accounts for the fall-off we observe for interpuff intervals shorter than ∼0.5 s, and for observations that mean interpuff intervals are ∼0.5 s longer than corresponding first-puff latencies for all cluster sizes. However, even following strong photorelease of IP3 that evoked puffs with high frequency, stochastic Ca2+ binding appears to remain the major determinant of puff frequency.
Figure 6.
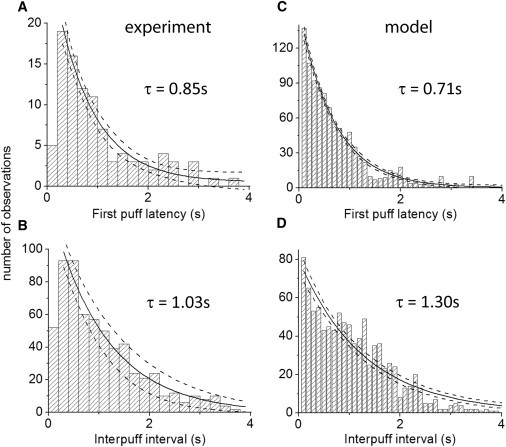
Distribution histograms of experimental and simulated first puff latencies and interpuff intervals. (A and B) Experimental data from 101 puff sites plotting respectively the distributions of first puff latencies and interpuff intervals. Measurements were pooled from sites with cluster sizes between 4 and 8, and with flash durations of 60, 100, and 200 ms. Solid curves are single-exponential fits with time constants as indicated; dashed curves indicate 95% confidence bounds (R2 = 0.95 and 0.97, respectively). (C and D) Corresponding distribution histograms derived from model simulations of a cluster containing 6 IP3R channels (1000 puffs simulated). Solid curves are single-exponential fits; dashed curves indicate 95% confidence bounds (R2 = 0.98 and 0.93, respectively). See text for further details.
The role of IP3 in regulating puff frequency may then be thought of as setting the number of IP3R channels in a cluster that are in an activatable state at any given time; that is to say, the fraction of functional channels physically present to which IP3 has bound to a requisite number of subunits so that only the binding of Ca2+ to activating sites remains to open the channel. Increasing [IP3] will increase the number of activatable channels up to a maximum set by the number of non-Ca2+-inactivated IP3R in the cluster, thus accounting for the graded, saturating dependence of puff latency and frequency on [IP3]. In support of this hypothesis, model simulations showed a closely similar relationship between numbers of activatable channels in a cluster and puff frequency, both for clusters containing differing numbers of IP3R at constant [IP3] (Fig. 5 D), and for a cluster of fixed size while varying [IP3] (Fig. 5 D).
Our previous analysis implicitly assumes that the number of IP3R in a given cluster remains constant throughout the duration of a recording. However, it has been proposed that clusters are not static entities (25). Instead, there may be a dynamic interchange between functional IP3R anchored at a puff site and inactive, motile IP3R in the surrounding ER membrane (26). This may lead to fluctuations in numbers of IP3R within a cluster and potentially add an extra source of variability in amplitudes and interpuff intervals at a given site. However, the distribution of interpuff intervals that we observe argues against this possibility. If stochastic ligand binding to the IP3R is the major factor determining interpuff intervals, the distribution of intervals obtained from a cluster of fixed size is expected to closely follow a single exponential distribution. On the other hand, if the number of functional channels in a cluster were to vary over time, the distribution would become broader and no longer follow a single exponential, but rather a sum of multiple exponentials of differing time constants, each representing the stochastic variability for some given number of channels. Given that both our experimental (Fig. 6 B) and simulated (Fig. 6 D) distributions of interpuff intervals closely fit to single exponentials, we conclude that any variability contributed by putative dynamic fluctuations in channel numbers is small in comparison to the statistical variation in binding of ligand molecules and ions.
In addition to the number of IP3R present in a cluster, it is possible that puff frequency could be further regulated by environmental factors local to that puff site; for example, by the phosphorylation state of IP3R and the presence of neighboring Ca2+-releasing organelles such as mitochondria and lysosomes. Although we were unable to resolve any variation in interpuff intervals between different sites that was significantly in excess of the stochastic puff-to-puff variation at a given site under basal conditions, it remains possible that concurrent activation of other messenger pathways—such as cyclic ADP-Ribose and nicotinic acid adenine dinucleotide phosphate—may influence the IP3-mediated activity of specific puff sites.
Acknowledgments
This work was supported by grants (GM 48071 and GM 65830) from the National Institutes of Health.
References
- 1.Yao Y., Choi J., Parker I. Quantal puffs of intracellular Ca2+ evoked by inositol trisphosphate in Xenopus oocytes. J. Physiol. 1995;482:533–553. doi: 10.1113/jphysiol.1995.sp020538. [DOI] [PMC free article] [PubMed] [Google Scholar]
- 2.Smith I.F., Parker I. Imaging the quantal substructure of single IP3R channel activity during Ca2+ puffs in intact mammalian cells. Proc. Natl. Acad. Sci. USA. 2009;106:6404–6409. doi: 10.1073/pnas.0810799106. [DOI] [PMC free article] [PubMed] [Google Scholar]
- 3.Callamaras N., Marchant J.S., Parker I. Activation and co-ordination of InsP3-mediated elementary Ca2+ events during global Ca2+ signals in Xenopus oocytes. J. Physiol. 1998;509:81–91. doi: 10.1111/j.1469-7793.1998.081bo.x. [DOI] [PMC free article] [PubMed] [Google Scholar]
- 4.Bootman M.D., Berridge M.J., Lipp P. Cooking with calcium: the recipes for composing global signals from elementary events. Cell. 1997;91:367–373. doi: 10.1016/s0092-8674(00)80420-1. [DOI] [PubMed] [Google Scholar]
- 5.Thurley K., Falcke M. Derivation of Ca2+ signals from puff properties reveals that pathway function is robust against cell variability but sensitive for control. Proc. Natl. Acad. Sci. USA. 2011;108:427–432. doi: 10.1073/pnas.1008435108. [DOI] [PMC free article] [PubMed] [Google Scholar]
- 6.Foskett J.K., White C., Mak D.O. Inositol trisphosphate receptor Ca2+ release channels. Physiol. Rev. 2007;87:593–658. doi: 10.1152/physrev.00035.2006. [DOI] [PMC free article] [PubMed] [Google Scholar]
- 7.Shuai J., Rose H.J., Parker I. The number and spatial distribution of IP3 receptors underlying calcium puffs in Xenopus oocytes. Biophys. J. 2006;91:4033–4044. doi: 10.1529/biophysj.106.088880. [DOI] [PMC free article] [PubMed] [Google Scholar]
- 8.Wiltgen S.M., Smith I.F., Parker I. Superresolution localization of single functional IP3R channels utilizing Ca2+ flux as a readout. Biophys. J. 2010;99:437–446. doi: 10.1016/j.bpj.2010.04.037. [DOI] [PMC free article] [PubMed] [Google Scholar]
- 9.Dargan S.L., Schwaller B., Parker I. Spatiotemporal patterning of IP3-mediated Ca2+ signals in Xenopus oocytes by Ca2+-binding proteins. J. Physiol. 2004;556:447–461. doi: 10.1113/jphysiol.2003.059204. [DOI] [PMC free article] [PubMed] [Google Scholar]
- 10.Dawson S.P., Keizer J., Pearson J.E. Fire-diffuse-fire model of dynamics of intracellular calcium waves. Proc. Natl. Acad. Sci. USA. 1999;96:6060–6063. doi: 10.1073/pnas.96.11.6060. [DOI] [PMC free article] [PubMed] [Google Scholar]
- 11.Rose H.J., Dargan S., Parker I. ‘Trigger’ events precede calcium puffs in Xenopus oocytes. Biophys. J. 2006;91:4024–4032. doi: 10.1529/biophysj.106.088872. [DOI] [PMC free article] [PubMed] [Google Scholar]
- 12.Shuai J., Pearson J.E., Parker I. A kinetic model of single and clustered IP3 receptors in the absence of Ca2+ feedback. Biophys. J. 2007;93:1151–1162. doi: 10.1529/biophysj.107.108795. [DOI] [PMC free article] [PubMed] [Google Scholar]
- 13.Smith I.F., Wiltgen S.M., Parker I. Localization of puff sites adjacent to the plasma membrane: functional and spatial characterization of Ca2+ signaling in SH-SY5Y cells utilizing membrane-permeant caged IP3. Cell Calcium. 2009;45:65–76. doi: 10.1016/j.ceca.2008.06.001. [DOI] [PMC free article] [PubMed] [Google Scholar]
- 14.Thomas D., Lipp P., Bootman M.D. Hormone-evoked elementary Ca2+ signals are not stereotypic, but reflect activation of different size channel clusters and variable recruitment of channels within a cluster. J. Biol. Chem. 1998;273:27130–27136. doi: 10.1074/jbc.273.42.27130. [DOI] [PubMed] [Google Scholar]
- 15.Swaminathan D., Ullah G., Jung P. A simple sequential-binding model for calcium puffs. Chaos. 2009;19:037109. doi: 10.1063/1.3152227. [DOI] [PMC free article] [PubMed] [Google Scholar]
- 16.Swaminathan D., Jung P. The role of agonist-independent conformational transformation (AICT) in IP3 cluster behavior. Cell Calcium. 2011;49:145–152. doi: 10.1016/j.ceca.2010.11.003. [DOI] [PubMed] [Google Scholar]
- 17.De Young G.W., Keizer J. A single-pool inositol 1,4,5-trisphosphate-receptor-based model for agonist-stimulated oscillations in Ca2+ concentration. Proc. Natl. Acad. Sci. USA. 1992;89:9895–9899. doi: 10.1073/pnas.89.20.9895. [DOI] [PMC free article] [PubMed] [Google Scholar]
- 18.Fraiman D., Pando B., Dawson S.P. Analysis of puff dynamics in oocytes: interdependence of puff amplitude and interpuff interval. Biophys. J. 2006;90:3897–3907. doi: 10.1529/biophysj.105.075911. [DOI] [PMC free article] [PubMed] [Google Scholar]
- 19.Sun L., Yu F., Machaca K. Endoplasmic reticulum remodeling tunes IP3-dependent Ca2+ release sensitivity. PLoS ONE. 2012;6:e27928. doi: 10.1371/journal.pone.0027928. [DOI] [PMC free article] [PubMed] [Google Scholar]
- 20.Marchant J.S., Parker I. Role of elementary Ca(2+) puffs in generating repetitive Ca(2+) oscillations. EMBO J. 2001;20:65–76. doi: 10.1093/emboj/20.1.65. [DOI] [PMC free article] [PubMed] [Google Scholar]
- 21.Smith I.F., Wiltgen S.M., Parker I. Ca(2+) puffs originate from preestablished stable clusters of inositol trisphosphate receptors. Sci. Signal. 2009;2:ra77. doi: 10.1126/scisignal.2000466. [DOI] [PMC free article] [PubMed] [Google Scholar]
- 22.Shuai J.W., Jung P. Optimal ion channel clustering for intracellular calcium signaling. Proc. Natl. Acad. Sci. USA. 2003;100:506–510. doi: 10.1073/pnas.0236032100. [DOI] [PMC free article] [PubMed] [Google Scholar]
- 23.Thurley K., Smith I.F., Falcke M. Timescales of IP(3)-evoked Ca(2+) spikes emerge from Ca(2+) puffs only at the cellular level. Biophys. J. 2011;101:2638–2644. doi: 10.1016/j.bpj.2011.10.030. [DOI] [PMC free article] [PubMed] [Google Scholar]
- 24.Mak D.O., Pearson J.E., Foskett J.K. Rapid ligand-regulated gating kinetics of single inositol 1,4,5-trisphosphate receptor Ca2+ release channels. EMBO Rep. 2007;8:1044–1051. doi: 10.1038/sj.embor.7401087. [DOI] [PMC free article] [PubMed] [Google Scholar]
- 25.Taufiq-Ur-Rahman A., Skupin C.W., Taylor Clustering of InsP3 receptors by InsP3 retunes their regulation by InsP3 and Ca2+ Nature. 2009;458:655–659. doi: 10.1038/nature07763. [DOI] [PMC free article] [PubMed] [Google Scholar]
- 26.Parker I., Smith I.F. Recording single-channel activity of inositol trisphosphate receptors in intact cells with a microscope, not a patch clamp. J. Gen. Physiol. 2010;136:119–127. doi: 10.1085/jgp.200910390. [DOI] [PMC free article] [PubMed] [Google Scholar]