

Abstract
The bacterial flagellar motor is a molecular machine that converts an ion flux to the rotation of a helical flagellar filament. Counterclockwise rotation of the filaments allows them to join in a bundle and propel the cell forward. Loss of motility can be caused by environmental factors such as temperature, pH, and solvation. Hydrostatic pressure is also a physical inhibitor of bacterial motility, but the detailed mechanism of this inhibition is still unknown. Here, we developed a high-pressure microscope that enables us to acquire high-resolution microscopic images, regardless of applied pressures. We also characterized the pressure dependence of the motility of swimming Escherichia coli cells and the rotation of single flagellar motors. The fraction and speed of swimming cells decreased with increased pressure. At 80 MPa, all cells stopped swimming and simply diffused in solution. After the release of pressure, most cells immediately recovered their initial motility. Direct observation of the motility of single flagellar motors revealed that at 80 MPa, the motors generate torque that should be sufficient to join rotating filaments in a bundle. The discrepancy in the behavior of free swimming cells and individual motors could be due to the applied pressure inhibiting the formation of rotating filament bundles that can propel the cell body in an aqueous environment.
Introduction
Hydrostatic pressure is one of the thermodynamic parameters that comprise the environmental conditions to which living cells must adapt. Most cellular processes are carried out by biomolecules located in an aqueous environment. In general, the application of a hydrostatic pressure of ∼100 MPa (100 pN nm−2) does not seriously affect the overall secondary and tertiary structures of protein molecules, but it enhances the clustering of water molecules on the hydrophilic and hydrophobic surfaces of proteins (1–3). Bound water can weaken protein-protein and protein-ligand interactions. Pressure-induced changes can induce significant changes in the morphology and activity of living cells, including microorganisms (4–6), sea urchin eggs (7), tissue cells (8), and muscle fibers (9–11). Escherichia coli can be used as a model microorganism to study how hydrostatic pressure affects the activities of biological systems, although it does not normally exist under conditions of high hydrostatic pressure. In previous studies on the effects of high pressure, the major focus has been on cell growth and morphological deformation. For E. coli, the results can be summarized as follows. At <25 MPa, E. coli cells continue to grow and divide (12). At 30–50 MPa, cell division is inhibited, leading to filamentous elongation of the cell body (4,13,14). Cell growth is abolished at >60 MPa (12–14), and cell death results at >150 MPa (15–17). Flagellar motility has been considered one of the most pressure-sensitive cellular processes (18,19), but the detailed mechanisms that contribute to its inhibition by hydrostatic pressure remain unresolved.
An E. coli cell has 5–6 flagella, each of which consists of a long (∼10 μm), thin (∼20 nm) helical filament (20). The cell turns its filament like a screw in either the counterclockwise (CCW, viewed from filament to motor) or clockwise (CW) direction. CCW rotation allows the left-handed helical filaments to form a bundle that propels the cell smoothly in a run. In contrast, CW rotation of a filament forces it out of the bundle and leads to a change in swimming direction called a tumble. The switching between CCW and CW rotation enables bacteria to migrate to more favorable environments (21–25). The bacterial flagellar motor converts an ion flux into the rotation of the flagellum (26–28). The motor consists of a rotor surrounded by multiple stator units. A maximum of 11 stator units can interact simultaneously with a single rotor, depending on the number of total stator units pooled in the inner membrane (29,30). Torque is generated by intermolecular interactions between the rotor and stator units. The chemomechanical energy conversion process is affected by physical and chemical conditions, such as temperature, pH, and solvation (31–36). The application of pressure is also expected to modulate the torque generation processes to the extent that E. coli cells stop swimming. To study in detail the effects of high pressure, it is critical to monitor the motility of E. coli cells under these conditions.
Here, we describe a high-pressure microscope that enables us to acquire high-resolution microscopic images under various pressure conditions. The system developed allowed us to apply pressure of up to 150 MPa to any biological sample in solution, which is ∼1.5-fold higher than the hydrostatic pressure in the deepest part of the Mariana Trench. Using this system, we characterized the pressure dependence of the motility of swimming E. coli cells and single flagellar motors.
Materials and Methods
High-pressure chamber
Fig. 1 A shows a cross section of a high-pressure chamber (HPC; Sasahara Giken, Kyoto, Japan). The main body (MB) and window support (WS) were made of nickel alloy, Hastelloy C276. The outer dimensions of the MB were 60 × 50 × 20 mm, and the internal volume was ∼50 μl (Fig. 1 B). The WS was screwed into the MB, and the inside of the HPC was sealed by an O-ring (O) and backup ring (BR; Peek, Sasahara Giken). The ports on the right and left sides were used to connect to a separator (37) via tubing 1/4- and 1/8-inch, respectively, in outer diameter. In addition, the HPC was equipped with two flow paths at the outer edge of the MB. The inner temperature inside the HPC could be controlled by running temperature-regulated water from the thermostat bath through the flow path.
Figure 1.
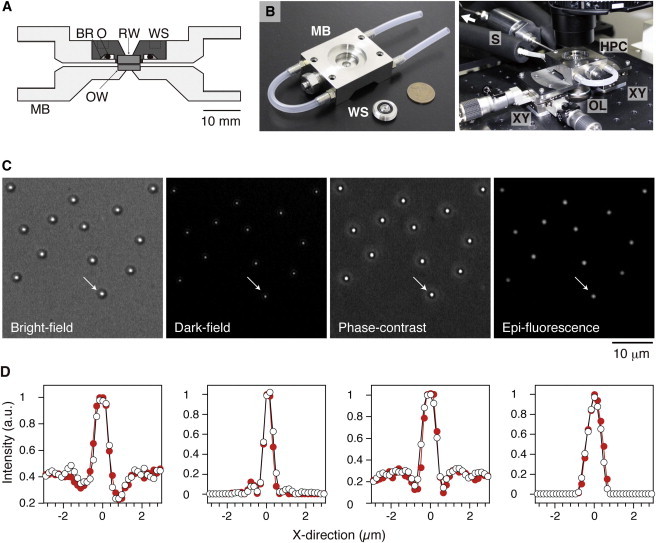
High-pressure microscope. (A) Cross section of a high-pressure chamber (HPC). MB, main body; WS, window support; OW, observation window; RW, rear window; BR, backup ring; O, O-ring. (B) Photographs of the HPC. (Left) Disassembled components of the HPC with a coin (diameter 23.5 mm) shown for size comparison. (Right) HPC mounted on an inverted microscope; full details of the microscope stage are available to interested parties upon request. A white arrow indicates the pressure line connected to the hand pump. (C) Various microscopic images of the same 1-μm beads at 100 MPa. These images were recorded at 30 frames s−1 and displayed without processing contrast enhancement and brightness offset. (D) Intensity profile of the bead at 0.1 (open circles) and 100 MPa (solid circles). The intensity profile of the same bead was plotted at each pixel in the x direction. The arrows in C indicate the corresponding original images.
The HPC was equipped with two optical windows, an observation window (OW; ϕ = 6 mm, t = 1.5 mm) and a rear window (RW; ϕ = 6 mm, t = 2.0 mm), both of BK7 (Sasahara Kogaku, Kyoto, Japan). The two windows were attached to the MB and WS, respectively, by epoxy resin. The OW was made of BK7 because this material was found to be suitable for microscopic observation and for preparing appropriate surface conditions for our experiments. Microscopic observations in the HPC were carried out through the OW. The aperture diameter and critical angle were 1.5 mm and 76°, respectively. The numerical apertures at the objective-lens and condenser-lens sides were 0.6 and 0.55, respectively. The gap between the OW and RW was ∼0.2 mm along the optical axis. We were able to construct a flow cell on the OW with a small piece of a conventional coverslip (thickness, ∼0.17 mm) and two strips of double-sided tape. This flow cell enabled us to replace solutions quickly and conveniently. In addition, it decreased the background light that could interfere with microscopic observations.
The HPC was connected to a separator (S) (Fig. 1 B). The separator conferred the advantage of reducing the total dead volume of buffer solution in the pressure line. The inside of the Teflon cap was filled with buffer solution and connected to the HPC. The gap between the Teflon cap and the MB was filled with distilled water and connected to a high-pressure pump (HP-150, Syn Corporation, Kyoto, Japan). The water pressure was transduced to the buffer solution by deformation of a thin Teflon cap in the separator, as described previously (37). The hydrostatic pressure in the pressure line was measured using a pressure gauge (PG-2TH, Kyowa, Kyoto, Japan). The high-pressure pump was connected to the separator via a long, springlike 1/16-inch stainless tube and separated from the microscope to prevent the mechanical vibrations caused by operation of the pump from influencing the HPC. The inside of the remaining space of the HPC and S was filled with motility medium.
Microscope
The HPC was combined with a commercially available inverted microscope (Ti-E, Nikon, Tokyo, Japan) on a vibration-free table (AS-II 1809TM, Nippon Boushin, Shizuoka, Japan). The microscope was equipped with a custom-made microscope stage, which consisted of a two-coupled XY stage (XY) and metal parts (Fig. 1 B); full details of the microscope stage are available to interested parties upon request. The HPC was mounted on a stainless steel mounting and the position could be manipulated with two manipulators in the x and y directions. Microscopic observation was done by a long-working-distance objective lens (OL; NA 0.6, working distance ∼3 mm; CFI ELWD ADM40×C, Nikon), and the images were acquired by a charge-coupled device camera (WAT-120N, Watec, Tsuruoka, Japan) or high-speed camera (LRH20000B, digimo, Tokyo, Japan). A diode-pumped Nd:YVO4 laser (200 mW, 532 nm; EXLSR-G2-CW, Spectra Physics, Mountain View, CA) could be used as the illumination light source for acquiring fluorescence images. The laser beam was attenuated with a neutral density filter, and focused at the back focal plane of the objective lens. Dark-field images were acquired by modified dark-field microscopy (38). Rays from a light source through the aperture diaphragm, which were collimated by the condenser lens, illuminated objects in the HPC and were all blocked by the center stop (circular reticle with ϕ = 3 mm) located in a dichroic mirror cube. All microscopic images were stored in a computer, and then analyzed offline, using commercial tracking software (G-track; G-Angstrom, Sendai, Japan) and Image J (http://imagej.nih.gov/ij/).
Viscous drag, temperature, and pH measurements
Briefly, the pressure-induced changes in motility medium were measured as described (37). The pressure-induced change in viscous drag was measured by microscopic analysis of 1-μm beads undergoing Brownian motion in water solution. The temperature change was measured by inserting a thermocouple device into a port of the HPC. The pH change was measured from the absorption spectrum of the motility medium containing a pH indicator (bromothymol blue or p-nitrophenol).
Bacterial strains and culture
In this study, we used E. coli strains RP437 (39), RP4979 (40), YS1326, and YS1217. YS8 strain (ΔcheY fliC::Tn10 ΔpilA) was derived from strain RP4979. Strain YS1326 was transformed from YS8 with plasmid pYS11 (fliC-sticky, ampicillin resistance, pBR322 derivative) (41). Strain YS1217 was transformed for JHC36 (fliC-sticky ΔcheY ΔmotAmotB) (42), with plasmid pDFB27 (motAmotB, arabinose inducible) (29). Cells were cultured from frozen stocks to late logarithmic phase at 30°C in Tryptone broth (1% Bacto tryptone, 0.5% NaCl). The medium culture contained 50 μg ml−1 ampicillin for strain YS1326, and 5–100 μM arabinose and 50 μg ml−1 ampicillin for YS1217. All assays were performed within 2 h after the cells were suspended in motility medium (10 mM Tris, pH 7, 0.1 mM EDTA).
Assay
Swimming E. coli strain RP437 or RP4979 was diluted with motility medium and introduced into the flow cell, which was constructed on the inner surface of the OW of the HPC. The phase-contrast image of the cells near the OW was recorded at 30 frames s−1. The hydrostatic pressure within the HPC was usually increased to 80 MPa in increments of 20 MPa and decreased by similar steps. The pressure was regulated with an accuracy of ±1 MPa. The experimental temperature was kept at 23 ± 1°C. The total elapsed time for pressure treatment of a population of cells was ∼30 min. After the release of the pressure, all cells were removed from the HPC and the assay was repeated using fresh cells. All assays were repeated with at least three different cultures.
Rotation of single flagellar motors on tethered cells was measured by using strains YS1326 or YS1217, from which the flagella were sheared as described previously (30). Cells were introduced into the flow cell and incubated for ∼5 min to attach the sticky flagellar filament onto the OW. The free cells in the HPC were removed by washing with motility medium. The phase-contrast images of the tethered cells were recorded at 30 frames s−1, and the rotation of individual cells was tracked under various pressure conditions.
High-speed rotation of single motors was measured by using cells of strain YS1326, from which the flagella were sheared as described (30). The cells were introduced into the flow cell and incubated for ∼10 min to attach the cell bodies onto the polylysine-coated OW. The free cells in the HPC were removed by washing with phosphate buffer (10 mM potassium phosphate (pH 7.0) and 0.1 mM EDTA). A suspension of 250-nm gold colloid (BB International, Harrogate, UK) was introduced into the flow cell and incubated for ∼5 min to allow the particles to attach spontaneously to the sheared sticky filaments. The free gold colloids in the HPC were then removed by washing with motility medium. The bright-field image of the gold colloids was recorded at 2000 frames s−1, and the rotation of individual motors was tracked under various pressure conditions.
Results
Performance evaluation
We developed a high-pressure microscope to observe the motility of E. coli cells under various pressure conditions (Fig. 1). Hydrostatic pressure was applied using a hand pump. The pressure could be increased by several dozen MPa within a few seconds, without any overshoot. Pressure could be released nearly instantaneously by opening a valve. Our apparatus could apply pressure up to 150 MPa, a limit imposed by the capabilities of the hand pump. The maximum pressure is ∼1.5-fold higher than in the deepest part of the Mariana Trench (10,900 m in depth), the highest found outside the crust of the earth.
Our high-pressure chamber (HPC) was designed to acquire microscopic images with high resolution even under high-pressure conditions. This goal was achieved by increasing the numerical aperture of both the objective and condenser lenses. The numerical aperture of the objective-lens side was increased from 0.55 (37) to 0.60, resulting in an ∼20% higher light intensity of the targeted object. On the other hand, the numerical aperture of the condenser-lens side was drastically increased from 0.05 (37) to 0.55. The optical improvements thus attained allowed us to acquire not only epifluorescence and bright-field (37), but also phase-contrast and dark-field, images (Fig. 1 C). These changes expanded the versatility of the microscope to the extent that it could be used to make the observations reported here.
The performance of the entire apparatus was examined in detail. One-micrometer fluorescent beads, which are similar in size to E. coli cells, were fixed onto the surface of the OW in the HPC under conditions of high ionic strength. We monitored microscopic images of the beads at the center of the OW. When pressure was applied to the HPC, the microscopic image of the beads moved out of focus, because the applied pressure deforms the HPC. After readjusting the position of the objective lens, the microscopic images became normally focused again. The displacement of the OW from the objective lens linearly increased with increments of pressure, and it reached 20.6 ± 0.3 μm (mean ± SD, n = 5) at 100 MPa. The x- and y-positions of the beads shifted to a lesser extent, 5.6 ± 2.8 and 0.4 ± 0.2 μm (mean ± SD, n = 5), respectively. The difference in the shifts of the x and y axes might have originated from the asymmetric design of the HPC. Fig. 1 C displays images of the same beads at 100 MPa. The intensity profile of a bead was independent of the applied pressure (Fig. 1 D), suggesting that applied pressure did not affect image formation.
Next, we checked whether the position of the beads could be tracked with high positional resolution, regardless of the pressure applied. Phase-contrast images of the same beads were acquired at 100 MPa. The intensity profile of each bead was fitted by a 2D Gaussian function. The averages of the fitting error were 5.7 and 4.9 nm (n = 10) in the x and y directions, respectively. The drifts of position in the x and y directions were 7.9 ± 4.6 and 8.6 ± 4.4 nm min−1 (mean ± SD, n = 10), respectively. Similar results were obtained at 0.1 MPa (data not shown), suggesting that the stability of the microscope was not affected by the applied pressures. Thus, our results demonstrate that our high-pressure microscope can measure the x- and y-positions of the research target at the nanometer level.
Finally, we confirmed that applied pressure significantly changed the physical characteristics of the buffer solutions (see Materials and Methods). Our results showed that the application of 100 MPa of pressure increased the viscous drag by +5%, temperature by +0.1°C, and pH by +0.1. These results confirmed that this experimental system is useful for studying the effects of high pressure on microbial behavior.
Motility of a smooth-swimming strain
E. coli RP437 cells (wild-type for motility and chemotaxis) were diluted in motility medium and then introduced into the HPC. At ambient conditions (23°C and 0.1 MPa), the cells kept swimming without any significant change for at least 2 h, indicating that our experimental system could be used for studying the pressure dependence of bacterial motility without any concerns about oxygen deficiency, dissolution of metal from the HPC or other artificial factors (43). We confirmed that application of ∼80 MPa of pressure inhibited the motility of swimming RP437 cells (44).
To focus on the pressure dependence of the motor function in swimming E. coli cells, strain RP4979 (ΔcheY), rather than strain RP437, was used for the following experiments. RP4979 cells lack the switch-inducing CheY protein; therefore, their flagellar motors rotate exclusively in the CCW direction, and cells swim smoothly without tumbling. The pressure of the HPC was increased to 80 MPa, and then decreased to 0.1 MPa. Fig. 2 A displays typical time courses for RP4979 cells under various pressure conditions. Under ambient conditions (0.1 MPa and 23°C), RP4979 cells swam smoothly with a speed of 20 ± 6 μm s−1 (mean ± SD, n = 63). At 40 MPa, most cells still swam smoothly, but the average speed decreased to ∼50% of its initial value at 0.1 MPa. At 60 MPa, many cells still swam, though swimming speed had drastically decreased, and the others just jiggled without showing any translational motion. At 80 MPa, most cells stopped directional swimming and diffused freely in the translational and rotational directions. A limited number of cells seemed to show a rolling motion of their cell bodies (45).
Figure 2.
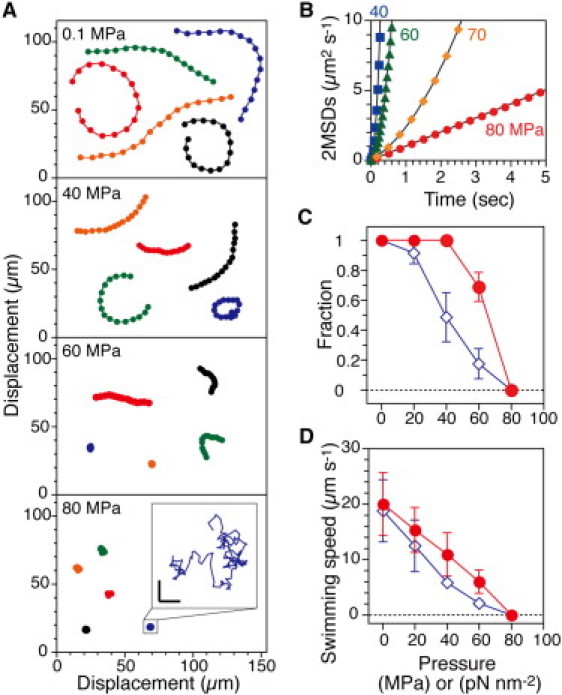
Motility of smooth-swimming cells. (A) Trajectories of RP4979 cells. The positions of the cell were plotted every 10th frame for 5 s. (Inset) Trajectory of a cell at 80 MPa for 5 s on an expanded scale. Scale bar, 2 μm. (B) 2MSDs plotted at every frame for 5 s (40 and 60 MPa) or every 10 frames (70 and 80 MPa) (n = 46–59, total = 202). Data were fitted by (vt)2 and/or 4Dx–yt, where v is the translational speed, Dx–y is the diffusion constant, and t is time (40 MPa, v = 11 μm s−1; 60 MPa, v = 5.2 μm s−1; 70 MPa, v = 1.0 μm s−1 and Dx–y = 0.35 μm2 s−1; 80 MPa, Dx–y = 0.25 μm2 s−1). (C and D) Swimming fraction and speed during the pressurization (solid circles) and depressurization processes (open diamonds). Swimming fractions were based on the number of cells that swam with a speed of >2 μm s−1 at each pressure. The speed was the average value of the swimming cells in C. Error bars represent the SD.
The translational motion in a focal plane was characterized by calculating the 2D mean-square displacement against time (2MSDs(t)), which is a convenient quantitative analysis for stochastic movement (37). Fig. 2 B shows the average 2MSDs(t) values of RP4979 cells at each pressure. At 40 and 60 MPa, the plots increased as the square of time, meaning that the cells underwent directional movement. At 70 MPa, the plots were fitted well by a sum of time and square of time, indicating that the cells had very weak motility. At 80 MPa, the plots increased linearly with time, showing that the cells underwent only random Brownian motion. Thus, the motility of swimming cells was completely inhibited at 80 MPa but only partially inhibited at lower pressures.
Fig. 2, C and D, summarizes the swimming fraction and speed of the cells during the pressurization and depressurization processes. We selected cells that swam with a speed of >2 μm s−1 and calculated both their fraction of all cells in the focal plane and their average speed. Both the fraction and speed decreased with increases in pressure and reached zero at 80 MPa. Both the swimming fraction and speed showed significant hysteresis between the pressurization and depressurization processes, although the cells eventually recovered their initial motility sometime after the pressure was released.
We also examined the time course of the response of motility to pressure in swimming RP4979 cells. Before application of pressure, all cells swam smoothly with a speed of 19 ± 5 μm s−1 (mean ± SD, n = 26). When the pressure was increased within 5 s from 0.1 to 80 MPa, all cells immediately stopped swimming and showed only Brownian motion (data not shown). The pressure was applied at 80 MPa for 5 min and then immediately decreased to 0.1 MPa. Fig. 3 displays the time course of the swimming fraction and speed of RP4979 cells. Both parameters rapidly increased with time and returned almost to the initial value. The time courses of the two plots could be fitted to single-exponential curves. The rise times (corresponding to 63% of their asymptotic values) of the swimming fraction and speed were 4.9 and 5.6 s, respectively. This rapid recovery of the motility of the swimming cells indicated that the cellular components responsible for motility, such as the flagellar filaments and motors, were not seriously damaged, even at 80 MPa. Thus, the application of pressure acts directly and reversibly on the motility.
Figure 3.
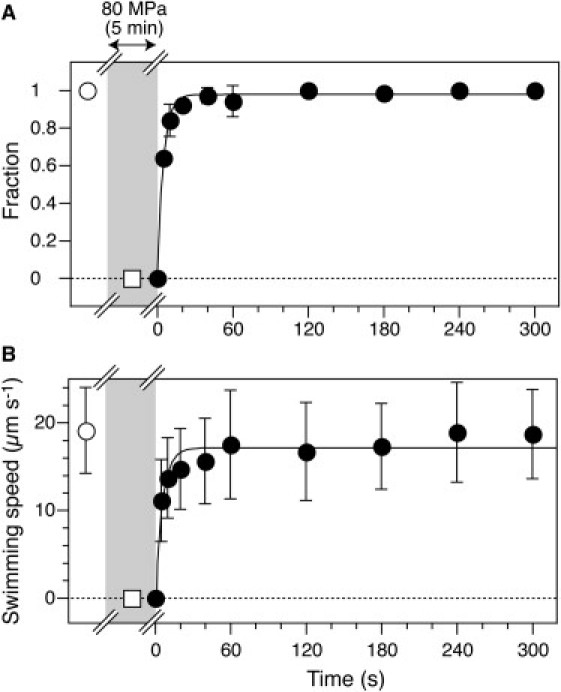
Rapid recovery of motility in RP4979 cells. (A and B) Swimming fraction and speed after the release of pressure (mean ± SD, n = 22–52). Before the application of pressure, all of the cells swam smoothly (open circles). Pressure of 80 MPa was applied to the cells for 5 min (open square in gray area) and then instantaneously decreased to 0.1 MPa at t = 0. The plots (solid circles) could be fitted by an exponential curve with τ = 4.9 s (A) and 5.6 s (B) Error bars represent the SD.
The pressure required to stop cells swimming completely in this study was higher than that reported previously (40–50 MPa; the motility of E. coli cells was measured in soft agar (18) or Luria Bertani medium (19)). This difference could be caused by changes in the experimental conditions, such as the strain, cultivation conditions, or viscosity.
Torque generation of single flagellar motors
We performed a tethered-cell assay using strain YS1326, which lacks switch-inducing protein CheY and expresses FliC-sticky filaments (46). A single flagellar filament protruding from each cell was attached to the surface of the flow cell in the HPC, and the rotation of the cells was tracked under various pressure conditions. Under ambient conditions (0.1 MPa and 23°C), cells rotated smoothly at an average speed of 5.8 ± 3.0 s−1 (mean ± SD, n = 130). Fig. 4, A and B, shows sequential phase-contrast images of the same single cell at 0.1 and 80 MPa, respectively. The time courses of the rotation speeds of a single cell at 0.1, 40, and 80 MPa are displayed in Fig. 4 C. The cell still rotated smoothly in the CCW direction, even at 80 MPa.
Figure 4.
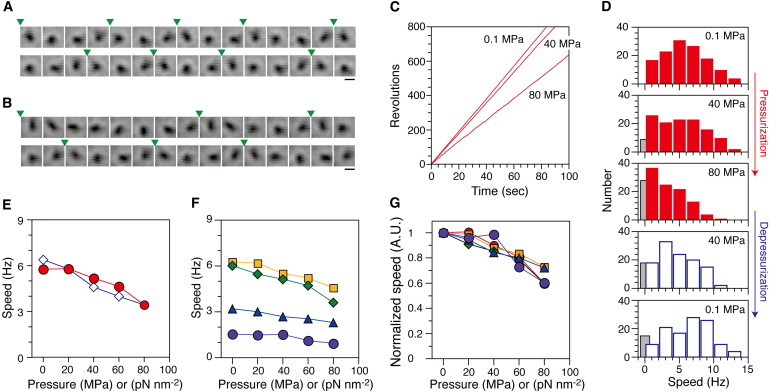
Torque generation of single flagellar motors in strain YS1326 (A–E) and YS1217 (F and G). (A and B) Sequential phase-contrast images of the same rotating tethered cell were taken at every frame. The pressure was 0.1 MPa (A) or 80 MPa (B). Arrowheads indicate completion of a turn. Scale bars, 2 μm. (C) Time courses of revolutions of the same cell in A and B (CCW positive). (D) Histograms of the rotational speed (n = 130). The speeds of the motors rotating in the CCW direction were taken as positive. Data for the motors that were in the stop state were colored gray in the histograms. (E) Pressure and speed relation in the pressurization (circles) and depressurization processes (diamonds). (F and G) Rotational speed at different expression levels of stator units. The expression levels of stator units in YS1217 cells were controlled by adding 5 (circles; n = 45), 10 (triangles; n = 48), 50 (diamonds; n = 50) and 100 (squares; n = 61) μM arabinose. (G) Normalized speed. Data for cells whose motors were stopped were excluded from calculations of speed (E–G).
A systematic analysis was performed to characterize the pressure dependence of the rotational speed of tethered cells. All cells that rotated smoothly before application of pressure were analyzed at each pressure. Fig. 4 D shows histograms of the rotational speeds of tethered cells when the pressure was increased and then decreased in a stepwise manner. The rotational speed decreased with increased pressure (Fig. 4 E), but even at 80 MPa, ∼80% of motors still rotated at 3.4 ± 2.6 Hz (mean ± SD, n = 102), which is ∼60% of the initial speed at ambient pressure. Thus, the rotation of each motor was robust under conditions of high pressure. After release of the pressure, some cells (∼10%) did not recover to rotate, quite possibly because they had become stuck to the observation window.
To monitor the high-speed rotation of the motors under conditions of lower drag (viscous load), we measured the rotation of 250-nm diameter gold colloid beads attached to single flagellar filaments of YS1326 cells. The rotational speed of the motor under these conditions was expected to be similar to that of the flagella of smooth swimming cells. The rotation of the beads was tracked under various pressures, as in the tethered-cell assay (Fig. 5 A). The time courses of the rotation of a bead at 0.1, 40, and 80 MPa are displayed in Fig. 5 B. The applied pressure drastically decreased the rotational speed, but not the rotational orbit, of the bead. Fig. 5 C summarizes the pressure dependence of the rotational speeds of a population of beads. At 80 MPa, all motors still rotated with an average speed of 58 ± 29 Hz, a decrease to 27% of the initial speed of 219 ± 18 Hz at ambient pressure (mean ± SD, n = 10). Thus, the speed of rotation of the beads was much more sensitive to pressure than the much slower rotation of tethered cells (Fig. 4 E). In addition, the pressure-speed relations (Figs. 4 E and 5 C) did not show any significant hysteresis between the pressurization and depressurization processes, indicating that motor function was perfectly reversible under these conditions.
Figure 5.
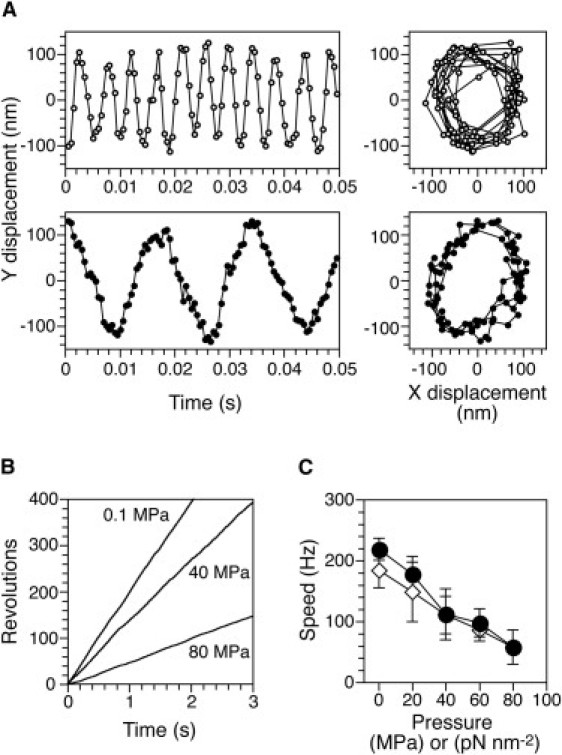
High-speed rotation at low viscous drag. (A) Time courses of y-displacement (left) and xy plots (right) of the same rotating gold colloid bead at 0.1 (open circles) and 80 (solid circles) MPa. (B) Time courses of revolutions of the same motor represented in A (CCW positive). (C) Rotational speed of individual flagella during the pressurization (solid circles) and depressurization processes (open diamonds). Each speed was obtained from the number of rotations over 2 s (n = 10). Error bars represent the SD.
Intermolecular interaction between rotor and stator units
We next characterized the relationship between the motor function and number of stator units in a cell. The motor in tethered cells is thought to run at close to thermodynamic equilibrium, and the speed of rotation is directly proportional to the proton motive force (PMF) and the number of torque generators (29,32,47,48). The average number of stators interacting with a rotor depends on the expression levels of the stator units.
The turnover of stator units between the membrane pool and the motors occurs with a fairly rapid rate constant (on the order of 0.04 s−1) (49). If applied pressure works to dissociate stator units from their rotors, the average number of stators interacting with a rotor should decrease more rapidly with pressure at lower levels of expression of the stator units. To test this possibility, a tethered-cell assay was performed using YS1217 cells with different levels of expression of MotA and MotB. Under ambient conditions, cells with low expression levels (5 and 10 μM arabinose) of stator units rotated slowly in comparison with those with higher levels of expression (50 and 100 μM arabinose). The average speed of rotation decreased with increased pressure at each expression level (Fig. 4 F). Fig. 4 G displays the pressure dependence of the normalized speed, which was adjusted to the speed before application of pressure. The plots show complete overlap at each pressure, indicating that the pressure-induced changes in motor rotation were independent of the number of stator units per motor. The fraction of rotating cells also decreased with increases in pressure and reached 70–80% at 80 MPa, regardless of the number of stator units (data not shown). Thus, the pressure-induced decrease in rotational speed was not induced by dissociation of stator units under high-pressure conditions.
Discussion
Here, we describe a high-pressure microscope that enables us to acquire high-resolution microscopic images under various pressure conditions. The developed system allowed us to characterize the pressure-induced changes in the motility of swimming E. coli cells and single flagellar motors. We found that single flagellar motors were relatively insensitive to applied pressures compared to other cellular process, such as swimming motility and cell division. This robustness is thought to be due to generation of torque by limited numbers of protein units in the motor via relatively simple mechanisms.
We compared the effects of pressure on the rotation speed of single motors under two different conditions of viscous drag to the motors. Our results showed that at 80 MPa, the rotational speed in tethered cells decreased by ∼40% of the initial speed without dissociation of stator units from their rotors (Fig. 4, F and G), indicating that the rotational speed seems to be decreased by reduction of PMF and/or energy coupling between proton influx and motor rotation. The effects of applied pressure on the motor function were much larger under conditions of low viscous drag (Fig. 5 C). Then, even assuming 40% reduction in PMF by increasing hydrostatic pressure to 80 MPa, this is not sufficient to explain the significant reduction in rotational speed under conditions of lower drag. In previous studies, several conditions under which motor rotation is severely impaired under conditions of low viscous drag have been reported, but the responses at high viscous drag have not. The effects of low temperature (31,34–36), solvation isotope effects (35), mutation of specific residues in the stator (50–52), and increases in intracellular ion concentration (53) have all been studied. Under these conditions, the rate of proton translocation is thought to be severely limiting at high rotation speeds. Application of pressure could cause similar effects on proton translocation and/or subsequent processes. At high pressure, the proton channels in the stator units could be tightly bound by water molecules (1,2). The shielding effect of hydration may prevent protons from transferring rapidly into the cell.
Why do E. coli cells stop swimming at 80 MPa (Figs. 2 and 3), although their flagellar motors still function? We showed that a single motor, under conditions of lower viscous drag, rotated at ∼60 Hz (Fig. 5). In swimming cells, this rotation speed should generate enough torque to propel the cell body (54). We hypothesize that the application of pressure may prevent filaments (five to six, on average, per E. coli cell) from rotating together in a bundle. The long filaments are exposed to water, and in general, hydrostatic pressure enhances the clustering of water molecules around hydrophilic and hydrophobic residues on protein surfaces. In fact, the helical structure of flagellar filaments is known to be sensitive to environmental factors such as temperature, pH, ionic strength, and torsional load (55–57). In previous studies, several factors involved in constructing a bundle of rotating filaments have been reported, including the flexibility of the hook and the helical form and surface conditions of the filament (45,46,56). Thus, interference with the ability of flagellar filaments to form coherent bundles provides a plausible explanation for the pressure-induced inhibition of the motility of swimming E. coli cells.
This hypothesis could be examined by direct observation of individual flagellar filaments under high-pressure conditions (58), but our current setup is not sensitive enough to acquire clear images for determining the helical structures of individual filaments. For this purpose, we need to use a high-sensitivity camera and resolve several technical problems, including enlargement of the numerical aperture of the objective lens and reduction of the background noise caused by the long optical path in water. These problems could be resolved by changing the design of the HPC and using confocal microscopy (4,11).
In summary, we present what to our knowledge is a new assay that modulates the performance of a molecular machine in situ using high-pressure techniques. Application of pressure is a powerful method for modulating intermolecular interactions between protein and water molecules. This technique could be extended to study the mechanisms by which isolated molecular machines are affected by the application of high pressure.
Acknowledgments
We thank Profs. J. Armitage and D. Blair for the gift of the E. coli strains and plasmids; Profs. M. Homma, I. Kawagishi, M. Terazima, and Y. Kimura, and Drs. S. Kumazaki, Y. Inoue, and S. Nakamura for technical support and discussion; and Dr. Y-S. Che for critically reading the manuscript.
This work was supported by Grants-in-Aid for Scientific Research from MEXT (M.N. and Y.S.). M.N. and Y.S. designed the experiments; Y.S. prepared the strains and plasmids; M.N. constructed the high-pressure microscope; M.N. performed all assays; and M.N. and Y.S. wrote the manuscript.
Footnotes
Masayoshi Nishiyama's present address is The Hakubi Center, Kyoto University, Kyoto, Japan.
Contributor Information
Masayoshi Nishiyama, Email: mnishiyama@icems.kyoto-u.ac.jp.
Yoshiyuki Sowa, Email: ysowa@hosei.ac.jp.
References
- 1.Boonyaratanakornkit B.B., Park C.B., Clark D.S. Pressure effects on intra- and intermolecular interactions within proteins. Biochim. Biophys. Acta. 2002;1595:235–249. doi: 10.1016/s0167-4838(01)00347-8. [DOI] [PubMed] [Google Scholar]
- 2.Lassalle M.W., Akasaka K. The use of high-pressure nuclear magnetic resonance to study protein folding. Methods Mol. Biol. 2007;350:21–38. doi: 10.1385/1-59745-189-4:21. [DOI] [PubMed] [Google Scholar]
- 3.Nishiyama M., Shimoda Y., Terazima M. Microtubule depolymerization at high pressure. Ann. N. Y. Acad. Sci. 2010;1189:86–90. doi: 10.1111/j.1749-6632.2009.05411.x. [DOI] [PubMed] [Google Scholar]
- 4.Vass H., Black S.L., Allen R.J. A multipurpose modular system for high-resolution microscopy at high hydrostatic pressure. Rev. Sci. Instrum. 2010;81:053710. doi: 10.1063/1.3427224. [DOI] [PubMed] [Google Scholar]
- 5.Otter T., Salmon E.D. Hydrostatic pressure reversibly blocks membrane control of ciliary motility in Paramecium. Science. 1979;206:358–361. doi: 10.1126/science.482945. [DOI] [PubMed] [Google Scholar]
- 6.Abe F., Iida H. Pressure-induced differential regulation of the two tryptophan permeases Tat1 and Tat2 by ubiquitin ligase Rsp5 and its binding proteins, Bul1 and Bul2. Mol. Cell. Biol. 2003;23:7566–7584. doi: 10.1128/MCB.23.21.7566-7584.2003. [DOI] [PMC free article] [PubMed] [Google Scholar]
- 7.Inoué S., Fuseler J., Ellis G.W. Functional organization of mitotic microtubules. Physical chemistry of the in vivo equilibrium system. Biophys. J. 1975;15:725–744. doi: 10.1016/S0006-3495(75)85850-4. [DOI] [PMC free article] [PubMed] [Google Scholar]
- 8.Frey B., Hartmann M., Bluemelhuber G. Microscopy under pressure—an optical chamber system for fluorescence microscopic analysis of living cells under high hydrostatic pressure. Microsc. Res. Tech. 2006;69:65–72. doi: 10.1002/jemt.20269. [DOI] [PubMed] [Google Scholar]
- 9.Ranatunga K.W., Fortune N.S., Geeves M.A. Hydrostatic compression in glycerinated rabbit muscle fibers. Biophys. J. 1990;58:1401–1410. doi: 10.1016/S0006-3495(90)82486-3. [DOI] [PMC free article] [PubMed] [Google Scholar]
- 10.Friedrich O., Kress K.R., Fink R.H. Prolonged high-pressure treatments in mammalian skeletal muscle result in loss of functional sodium channels and altered calcium channel kinetics. Cell Biochem. Biophys. 2006;45:71–83. doi: 10.1385/CBB:45:1:71. [DOI] [PubMed] [Google Scholar]
- 11.Friedrich O., Wegner F.V., Fink R.H. “In situ” high pressure confocal Ca2+-fluorescence microscopy in skeletal muscle: a new method to study pressure limits in mammalian cells. Undersea Hyperb. Med. 2006;33:181–195. [PubMed] [Google Scholar]
- 12.Zobell C.E., Cobet A.B. Growth, reproduction, and death rates of Escherichia coli at increased hydrostatic pressures. J. Bacteriol. 1962;84:1228–1236. doi: 10.1128/jb.84.6.1228-1236.1962. [DOI] [PMC free article] [PubMed] [Google Scholar]
- 13.Welch T.J., Farewell A., Bartlett D.H. Stress response of Escherichia coli to elevated hydrostatic pressure. J. Bacteriol. 1993;175:7170–7177. doi: 10.1128/jb.175.22.7170-7177.1993. [DOI] [PMC free article] [PubMed] [Google Scholar]
- 14.Ishii A., Sato T., Kato C. Effects of high hydrostatic pressure on bacterial cytoskeleton FtsZ polymers in vivo and in vitro. Microbiology. 2004;150:1965–1972. doi: 10.1099/mic.0.26962-0. [DOI] [PubMed] [Google Scholar]
- 15.Mañas P., Mackey B.M. Morphological and physiological changes induced by high hydrostatic pressure in exponential- and stationary-phase cells of Escherichia coli: relationship with cell death. Appl. Environ. Microbiol. 2004;70:1545–1554. doi: 10.1128/AEM.70.3.1545-1554.2004. [DOI] [PMC free article] [PubMed] [Google Scholar]
- 16.Moussa M., Perrier-Cornet J.M., Gervais P. Damage in Escherichia coli cells treated with a combination of high hydrostatic pressure and subzero temperature. Appl. Environ. Microbiol. 2007;73:6508–6518. doi: 10.1128/AEM.01212-07. [DOI] [PMC free article] [PubMed] [Google Scholar]
- 17.Kawarai T., Wachi M., Yamasaki M. SulA-independent filamentation of Escherichia coli during growth after release from high hydrostatic pressure treatment. Appl. Microbiol. Biotechnol. 2004;64:255–262. doi: 10.1007/s00253-003-1465-6. [DOI] [PubMed] [Google Scholar]
- 18.Meganathan R., Marquis R.E. Loss of bacterial motility under pressure. Nature. 1973;246:525–527. doi: 10.1038/246525a0. [DOI] [PubMed] [Google Scholar]
- 19.Eloe E.A., Lauro F.M., Bartlett D.H. The deep-sea bacterium Photobacterium profundum SS9 utilizes separate flagellar systems for swimming and swarming under high-pressure conditions. Appl. Environ. Microbiol. 2008;74:6298–6305. doi: 10.1128/AEM.01316-08. [DOI] [PMC free article] [PubMed] [Google Scholar]
- 20.Namba K., Vonderviszt F. Molecular architecture of bacterial flagellum. Q. Rev. Biophys. 1997;30:1–65. doi: 10.1017/s0033583596003319. [DOI] [PubMed] [Google Scholar]
- 21.Shimizu T.S., Delalez N., Berg H.C. Monitoring bacterial chemotaxis by using bioluminescence resonance energy transfer: absence of feedback from the flagellar motors. Proc. Natl. Acad. Sci. USA. 2006;103:2093–2097. doi: 10.1073/pnas.0510958103. [DOI] [PMC free article] [PubMed] [Google Scholar]
- 22.Bai F., Branch R.W., Berry R.M. Conformational spread as a mechanism for cooperativity in the bacterial flagellar switch. Science. 2010;327:685–689. doi: 10.1126/science.1182105. [DOI] [PubMed] [Google Scholar]
- 23.Nishiyama S., Ohno S., Kawagishi I. Thermosensing function of the Escherichia coli redox sensor Aer. J. Bacteriol. 2010;192:1740–1743. doi: 10.1128/JB.01219-09. [DOI] [PMC free article] [PubMed] [Google Scholar]
- 24.Paul K., Brunstetter D., Blair D.F. A molecular mechanism of direction switching in the flagellar motor of Escherichia coli. Proc. Natl. Acad. Sci. USA. 2011;108:17171–17176. doi: 10.1073/pnas.1110111108. [DOI] [PMC free article] [PubMed] [Google Scholar]
- 25.Porter S.L., Wadhams G.H., Armitage J.P. Signal processing in complex chemotaxis pathways. Nat. Rev. Microbiol. 2011;9:153–165. doi: 10.1038/nrmicro2505. [DOI] [PubMed] [Google Scholar]
- 26.Berg H.C. The rotary motor of bacterial flagella. Annu. Rev. Biochem. 2003;72:19–54. doi: 10.1146/annurev.biochem.72.121801.161737. [DOI] [PubMed] [Google Scholar]
- 27.Kojima S., Blair D.F. The bacterial flagellar motor: structure and function of a complex molecular machine. Int. Rev. Cytol. 2004;233:93–134. doi: 10.1016/S0074-7696(04)33003-2. [DOI] [PubMed] [Google Scholar]
- 28.Sowa Y., Berry R.M. Bacterial flagellar motor. Q. Rev. Biophys. 2008;41:103–132. doi: 10.1017/S0033583508004691. [DOI] [PubMed] [Google Scholar]
- 29.Blair D.F., Berg H.C. Restoration of torque in defective flagellar motors. Science. 1988;242:1678–1681. doi: 10.1126/science.2849208. [DOI] [PubMed] [Google Scholar]
- 30.Reid S.W., Leake M.C., Berry R.M. The maximum number of torque-generating units in the flagellar motor of Escherichia coli is at least 11. Proc. Natl. Acad. Sci. USA. 2006;103:8066–8071. doi: 10.1073/pnas.0509932103. [DOI] [PMC free article] [PubMed] [Google Scholar]
- 31.Chen X., Berg H.C. Torque-speed relationship of the flagellar rotary motor of Escherichia coli. Biophys. J. 2000;78:1036–1041. doi: 10.1016/S0006-3495(00)76662-8. [DOI] [PMC free article] [PubMed] [Google Scholar]
- 32.Manson M.D., Tedesco P.M., Berg H.C. Energetics of flagellar rotation in bacteria. J. Mol. Biol. 1980;138:541–561. doi: 10.1016/s0022-2836(80)80017-9. [DOI] [PubMed] [Google Scholar]
- 33.Shioi J.I., Matsuura S., Imae Y. Quantitative measurements of proton motive force and motility in Bacillus subtilis. J. Bacteriol. 1980;144:891–897. doi: 10.1128/jb.144.3.891-897.1980. [DOI] [PMC free article] [PubMed] [Google Scholar]
- 34.Lowe G., Meister M., Berg H.C. Rapid rotation of flagellar bundles in swimming bacteria. Nature. 1987;325:637–640. [Google Scholar]
- 35.Yuan J., Berg H.C. Thermal and solvent-isotope effects on the flagellar rotary motor near zero load. Biophys. J. 2010;98:2121–2126. doi: 10.1016/j.bpj.2010.01.061. [DOI] [PMC free article] [PubMed] [Google Scholar]
- 36.Baker M.A., Inoue Y., Berry R.M. Two methods of temperature control for single-molecule measurements. Eur. Biophys. J. 2011;40:651–660. doi: 10.1007/s00249-010-0667-y. [DOI] [PubMed] [Google Scholar]
- 37.Nishiyama M., Kimura Y., Terazima M. Pressure-induced changes in the structure and function of the kinesin-microtubule complex. Biophys. J. 2009;96:1142–1150. doi: 10.1016/j.bpj.2008.10.023. [DOI] [PMC free article] [PubMed] [Google Scholar]
- 38.Masaike T., Koyama-Horibe F., Nishizaka T. Cooperative three-step motions in catalytic subunits of F(1)-ATPase correlate with 80 degrees and 40 degrees substep rotations. Nat. Struct. Mol. Biol. 2008;15:1326–1333. doi: 10.1038/nsmb.1510. [DOI] [PubMed] [Google Scholar]
- 39.Parkinson J.S. Complementation analysis and deletion mapping of Escherichia coli mutants defective in chemotaxis. J. Bacteriol. 1978;135:45–53. doi: 10.1128/jb.135.1.45-53.1978. [DOI] [PMC free article] [PubMed] [Google Scholar]
- 40.Scharf B.E., Fahrner K.A., Berg H.C. Control of direction of flagellar rotation in bacterial chemotaxis. Proc. Natl. Acad. Sci. USA. 1998;95:201–206. doi: 10.1073/pnas.95.1.201. [DOI] [PMC free article] [PubMed] [Google Scholar]
- 41.Sowa Y., Rowe A.D., Berry R.M. Direct observation of steps in rotation of the bacterial flagellar motor. Nature. 2005;437:916–919. doi: 10.1038/nature04003. [DOI] [PubMed] [Google Scholar]
- 42.Inoue Y., Lo C.J., Ishijima A. Torque-speed relationships of Na+-driven chimeric flagellar motors in Escherichia coli. J. Mol. Biol. 2008;376:1251–1259. doi: 10.1016/j.jmb.2007.12.023. [DOI] [PubMed] [Google Scholar]
- 43.Douarche C., Buguin A., Libchaber A. E. Coli and oxygen: a motility transition. Phys. Rev. Lett. 2009;102:198101. doi: 10.1103/PhysRevLett.102.198101. [DOI] [PubMed] [Google Scholar]
- 44.Nishiyama M., Sowa Y., Terazima M. How does high pressure affect on the bacterial motility? Biophysics. 2006;46:S355. [Google Scholar]
- 45.Macnab R.M. Bacterial flagella rotating in bundles: a study in helical geometry. Proc. Natl. Acad. Sci. USA. 1977;74:221–225. doi: 10.1073/pnas.74.1.221. [DOI] [PMC free article] [PubMed] [Google Scholar]
- 46.Kuwajima G. Construction of a minimum-size functional flagellin of Escherichia coli. J. Bacteriol. 1988;170:3305–3309. doi: 10.1128/jb.170.7.3305-3309.1988. [DOI] [PMC free article] [PubMed] [Google Scholar]
- 47.Gabel C.V., Berg H.C. The speed of the flagellar rotary motor of Escherichia coli varies linearly with protonmotive force. Proc. Natl. Acad. Sci. USA. 2003;100:8748–8751. doi: 10.1073/pnas.1533395100. [DOI] [PMC free article] [PubMed] [Google Scholar]
- 48.Ryu W.S., Berry R.M., Berg H.C. Torque-generating units of the flagellar motor of Escherichia coli have a high duty ratio. Nature. 2000;403:444–447. doi: 10.1038/35000233. [DOI] [PubMed] [Google Scholar]
- 49.Leake M.C., Chandler J.H., Armitage J.P. Stoichiometry and turnover in single, functioning membrane protein complexes. Nature. 2006;443:355–358. doi: 10.1038/nature05135. [DOI] [PubMed] [Google Scholar]
- 50.Braun T.F., Poulson S., Blair D.F. Function of proline residues of MotA in torque generation by the flagellar motor of Escherichia coli. J. Bacteriol. 1999;181:3542–3551. doi: 10.1128/jb.181.11.3542-3551.1999. [DOI] [PMC free article] [PubMed] [Google Scholar]
- 51.Che Y.S., Nakamura S., Minamino T. Suppressor analysis of the MotB(D33E) mutation to probe bacterial flagellar motor dynamics coupled with proton translocation. J. Bacteriol. 2008;190:6660–6667. doi: 10.1128/JB.00503-08. [DOI] [PMC free article] [PubMed] [Google Scholar]
- 52.Nakamura S., Morimoto Y.V., Namba K. Role of a conserved prolyl residue (Pro173) of MotA in the mechanochemical reaction cycle of the proton-driven flagellar motor of Salmonella. J. Mol. Biol. 2009;393:300–307. doi: 10.1016/j.jmb.2009.08.022. [DOI] [PubMed] [Google Scholar]
- 53.Nakamura S., Kami-ike N., Namba K. Effect of intracellular pH on the torque-speed relationship of bacterial proton-driven flagellar motor. J. Mol. Biol. 2009;386:332–338. doi: 10.1016/j.jmb.2008.12.034. [DOI] [PubMed] [Google Scholar]
- 54.Darnton N.C., Turner L., Berg H.C. On torque and tumbling in swimming Escherichia coli. J. Bacteriol. 2007;189:1756–1764. doi: 10.1128/JB.01501-06. [DOI] [PMC free article] [PubMed] [Google Scholar]
- 55.Kamiya R., Asakura S., Namba K. Transition of bacterial flagella from helical to straight forms with different subunit arrangements. J. Mol. Biol. 1979;131:725–742. doi: 10.1016/0022-2836(79)90199-2. [DOI] [PubMed] [Google Scholar]
- 56.Hotani H. Micro-video study of moving bacterial flagellar filaments. III. Cyclic transformation induced by mechanical force. J. Mol. Biol. 1982;156:791–806. doi: 10.1016/0022-2836(82)90142-5. [DOI] [PubMed] [Google Scholar]
- 57.Kitao A., Yonekura K., Go N. Switch interactions control energy frustration and multiple flagellar filament structures. Proc. Natl. Acad. Sci. USA. 2006;103:4894–4899. doi: 10.1073/pnas.0510285103. [DOI] [PMC free article] [PubMed] [Google Scholar]
- 58.Turner L., Ryu W.S., Berg H.C. Real-time imaging of fluorescent flagellar filaments. J. Bacteriol. 2000;182:2793–2801. doi: 10.1128/jb.182.10.2793-2801.2000. [DOI] [PMC free article] [PubMed] [Google Scholar]