Abstract
Carbonic anhydrase III (CAIII) is an isoenzyme of the CA family. Because of its low specific anhydrase activity, physiological functions in addition to hydrating CO2 have been proposed. CAIII expression is highly induced in adipogenesis and CAIII is the most abundant protein in adipose tissues. The function of CAIII in both preadipocytes and adipocytes is however unknown. In the present study we demonstrate that adipogenesis is greatly increased in mouse embryonic fibroblasts (MEFs) from CAIII knockout (KO) mice, as demonstrated by a greater than 10-fold increase in the induction of fatty acid-binding protein-4 (FABP-4) and increased triglyceride formation in CAIII−/− MEFs compared with CAIII+/+ cells. To address the underlying mechanism, we investigated the expression of the two adipogenic key regulators, peroxisome proliferator-activated receptor-γ2 (PPARγ2) and CCAAT/enhancer binding protein-α. We found a considerable (approximately 1000-fold) increase in the PPARγ2 expression in the CAIII−/− MEFs. Furthermore, RNAi-mediated knockdown of endogenous CAIII in NIH 3T3-L1 preadipocytes resulted in a significant increase in the induction of PPARγ2 and FABP-4. When both CAIII and PPARγ2 were knocked down, FABP-4 was not induced. We conclude that down-regulation of CAIII in preadipocytes enhances adipogenesis and that CAIII is a regulator of adipogenic differentiation which acts at the level of PPARγ2 gene expression.
Keywords: Adipocyte, Adipogenesis, Aging, Caloric restriction, Carbonic anhydrase III, oxidative stress, Preadipocyte, PPARγ2, FABP-4
Introduction
Carbonic anhydrase III (CAIII) belongs to a family of structurally related enzymes that catalyze the reversible hydration of carbon dioxide (H2O + CO2 ↔ HCO3- + H+) [1, 2]. The CA isoenzymes are involved in physiological processes, such as acid-base balance, lipogenesis, and cell growth. The importance of CAI and CAII for the efficient transport and elimination of CO2 from tissues and lungs has been well documented [1, 2]. However, the specific activity of CAIII as a CO2 hydratase is only about 2% of CAI and CAII [3]. Thus, it has been hypothesized that CAIII has other functions in the cell. CAIII has two reactive sulfhydryl groups, which can reversibly conjugate to glutathione (GSH) through a disulfide bond [4, 5]. This S-glutathionylation reaction is likely one important component of cellular defense mechanisms that prevent the irreversible oxidation of proteins [6]. CAIII is rapidly glutathionylated when the cells are exposed to oxidative stress, and it is one of the most carbonylated proteins in rodent liver, suggesting that it is located in an oxidizing environment [7]. Moreover, the overexpression of CAIII in experimental cell lines has been found to protect them from H2O2-induced pro-apoptotic and anti-proliferative effects [8]. In aged rats, where glutathione levels are reduced, the amount of irreversibly oxidized CAIII increased [9–11]. Also, 4-hydroxynonenal-conjugated CAIII has been found to accumulate during muscle disuse [12]. These studies have further underlined a role for CAIII in oxidative stress situations, such as aging [13]. Indeed, these data suggest that CAIII might function to protect cells from oxidative damage.
CAIII is abundantly expressed in highly metabolically active tissues, such as fat, liver, and slow-twitch skeletal muscle fibers [1, 14]. In contrast, only trace amounts of CAIII have been detected in other tissues [15]. Adipose tissues serve as a fat storage depot and controls whole-body energy homeostasis [16]. Although evidence for an involvement of CAIII in fatty acid synthesis has been presented [14], it is also known that adipose tissues generate high levels of reactive oxygen species (ROS) and lipid peroxidation products [7, 14, 17, 18]. In addition, CAIII expression has been found to be very low in preadipocytes [19] and become substantial upon adipogenic differentiation [18]. In fact, CAIII has been shown to be one of the most abundant transcripts in both human [20] and rodent [21] adipose tissues, accounting for up to 2% of the total mRNA. Moreover, CAIII constitutes the most abundant protein in mature adipocytes, comprising up to 24% of the total soluble protein fraction [18]. These data suggest an important adipocyte-related function for CAIII, which could lie in the protection against oxidative stress. This function of CAIII could be of importance in obesity, which is characterized by fat accumulation and increased adipose tissue mass [22] that contribute to insulin resistance and metabolic syndrome [23]. Obesity leads to elevated oxidative stress caused by a hypoxia-induced increase in the production of ROS and lipotoxicity [24–27]. In keeping with these considerations, CAIII has been implicated in fatty acid metabolism [14] in adipocytes of both obese and lean mice [28, 29]. However, neither the function of CAIII in adipocytes nor the mechanism of adipogenesis-dependent up-regulation of CAIII is well understood.
Development of adipose tissue mass is a result of an increase in the number and size of the fat cells [30, 31]. New adipocytes arise from precursors referred to as adipose-derived stem cells and/or preadipocytes, which most likely reside at perivascular sites in adipose tissues [31]. The differentiation of preadipocytes into mature adipocytes, referred to as adipogenesis, is initiated by several extra- and intracellular factors. These factors include mitogens, growth factors, hormones and a cascade of activated signaling molecules (e.g., MAP kinases, AKT, protein kinase A, and glucocorticoid receptor), which activate a network of transcription factors that control the expression of many genes representing the adipocyte phenotype [32]. At the end of the intracellular signaling cascade, the transcription factors, CCAAT/enhancer binding protein-β (C/EBPβ) and C/EBPδ are activated [33]. These factors induce the expression of nuclear hormone receptor peroxisome proliferator-activated receptorγ (PPARγ2) [34] and CCAAT/enhancer binding protein-α (C/EBPα) [33], which are the two major regulators of terminal adipogenic differentiation, shown in the murine preadipocyte cell line, NIH 3T3-L1 and primary preadipocytes [32]. Following these events, PPARγ2 and C/EBPα activate the expression of adipocyte-specific genes which are involved in lipogenesis and necessary for the accumulation of lipid droplets and adipokines [32]. PPARγ2, the transcriptional activity of which is regulated by binding to the appropriate ligands, also plays a role in the regulation of oxidative stress. It has been shown that the ligand activation of PPARγ2 attenuated the production of ROS induced by different stimuli in NIH 3T3-L1 adipocytes and in the insulin-resistant leptin-deficient ob/ob mouse [35]. In contrast, adipose tissue-specific PPARγ2 deficiency has been found to increase resistance to oxidative stress in mice [36]. These data suggest that PPARγ2 activity can negatively and positively affect oxidative stress in adipose tissues depending on the conditions; however, these functions are not yet precisely understood.
In the present study, we investigated whether CAIII affects adipogenesis using MEFs from a mouse lacking CAIII and RNAi-mediated knockdowns of CAIII in NIH 3T3-L1 preadipocytes. We present evidence that the down-regulation of CAIII in preadipocytes dramatically activated PPARγ2 expression and adipogenesis, raising the possibility that CAIII can trigger the initiation of adipogenesis in preadipocytes by regulating PPARγ2 gene expression.
Materials and methods
Chemicals
3-Isobutyl-1-methylxanthin (IBMX), dexamethasone, troglitazone, Oil Red O, and DMEM were obtained from Sigma-Aldrich (Vienna, Austria), Insulin from Roche (Vienna, Austria), and all other supplements from Gibco (Vienna, Austria).
Plasmids
pMD2.G, psPAX2 and pLKO.1 TRC control vector (D. Trono # 12259, D. Trono #12260, Root #10879, Addgene, Cambridge, USA). A CAIII overexpressing lentivirus, pLentiCAIII, was constructed by inserting the full length mouse CAIII cDNA from pCMV-SPORT6-CA3, NM_007606 (Clone 4195712) MMM1013-65396 (Open Biosystems, Vienna, Austria) into pLenti6/DEST (Invitrogen, Lofer, Austria) using the Gateway Lentiviral Cloning System, Invitrogen, Lofer, Austria. The sequence of plentiCAIII was verified by automated sequencing. CAIII shRNA: sh#2 and sh#3 (TRCN0000114445 and TRCN0000114442 for NM_007606 [murine CAIII], #RMM4534, PPARγ2 shRNA: sh#1 and sh#4 (TRCN0000001657 and TRCN0000001659 for NM_011146 [murine PPARγ2], Open Biosystems, Vienna, Austria).
Cell culture
NIH 3T3-L1 preadipocytes (ATCC CL-173) were grown in DMEM with 1 g/L glucose, 1 g/L L-glutamine, 1 g/L sodium bicarbonate (Sigma, Vienna, Austria), 10% CS, 2 mM L-glutamine, 100 U/ml penicillin, and 100 μg/ml streptomycin (Gibco, Vienna, Austria), without reaching confluence. For differentiation, 10,000 cells/cm2 were sowed and grown for 4 days until density-mediated growth arrest. Differentiation was induced by the addition of 1 μg/ml insulin, 0.5 mM IBMX, 0.25 μM dexamethasone, 10% FCS and, where indicated, 5 μM troglitazone. After two days, only insulin and 10% FCS were added. The medium was changed every second day. Mouse embryonic fibroblasts (MEFs) were isolated as described [37] from wild-type, CAIII+/−, and CAIII−/− mice developed in the Laboratory of Biochemistry, National Heart, Lung, and Blood Institute, National Institutes of Health, Bethesda, Maryland USA (1). MEFs were cultured in DMEM/10% FCS, 1% NEAA, 1 % L-glutamine, 1 % penicillin/streptomycin and passaged twice before seeding at a density of 40,000 cells/cm2. Differentiation was induced in density-arrested MEFs as in the NIH 3T3-L1 cells.
Retroviral gene expression system
NIH 3T3-L1 cells were transiently transfected with different pLKO.1 lentiviral target gene shRNA vectors for accession NM_007606 and NM_011146 (#RMM4534, Open Biosystems, Vienna, Austria), using the effectene method (Qiagen, Hilden, Germany). After selection with 2 μg/ml puromycin, the most efficient knockdown clones for CAIII (sh#2 and sh#3) and for PPARγ2 (sh#1 and sh#4), were identified by Western blotting and then used for lentiviral production employing the ViraPowerTMLentiviral Expression System (Invitrogen, Lofer, Austria) and a second-generation system provided by the Trono lab (Addgene, Cambridge, USA). The same procedure was used to generate virus particles of the CAIII overexpressing lentivirus plentiCAIII. The purified viral particles were stored at −80°C. For viral infection, 500,000 NIH 3T3-L1 cells were seeded in a 75-cm2 bottle, with 5 ml medium, 6 μg/ml polybrene and virus particles at a multiplicity of infection (MOI) of 1:2. After 24 h, the medium was changed, and the cells were grown for another 48 h before they were trypsinized and seeded at 10,000 cells/cm2 for subsequent differentiation.
Oil Red O staining
The differentiated cells were fixed with 4% paraformaldehyde in PBS for 1 h and stained with 0.3% Oil Red O (Sigma, Vienna, Austria) in isopropanol:water (60:40) for 1 h. The final washing was then performed two times with distilled water. Triglyceride determination was performed by analysis of Oil Red O stained cells with AlphaEase FC software, version 6.0.0, Alpha Innotec Corporation.
Western blot analysis
Cells were extracted in 1.5x Laemmli sample buffer, and the protein concentration was measured using the BCA Assay (Thermo-Scientific, Rockford, USA). The lysates were separated on either a 12.5% or 10% gel by SDS-PAGE. Western blotting was performed as described [38]. Primary antibodies: β-actin (Clone Ac-15) Sigma-Aldrich, Vienna, Austria; C/EBPα (C-18), FABP-4 (C-15), and PPARγ2 (E-8), Santa Cruz, California, USA; CAIII (Produced by the Bethesda laboratory). Horseradish peroxidase–conjugated secondary antibodies (Promega, Mannheim, Germany). Enhanced Chemiluminescence Western blotting Detection System (NEN, Vienna, Austria).
Quantitative RT-PCR
Total RNA was isolated with the RNeasy Micro Kit (Qiagen, Hilden, Germany), and cDNA synthesis was performed with the First Strand cDNA Synthesis Kit (Fermentas, St.Leon-Rot, Germany). Quantitative expression analysis was performed using the LightCycler® 480 Real-Time PCR System (Roche, Vienna, Austria). The mRNA quantification was performed using β-tubulin for normalization. Primers: FABP-4-forw: AAGAAGTGGGAGTGGGCTTT. FABP-4-rev: CTGTCGTCTGCGGTGATTT. CAIII-for: CTTGATGCCCTGGACAAAAT. CAIII-rev: AGCTCACAGTCATGGGCTCT. CEBPα-for: AGGTGCTGGAGTTGACCAGT. CEBPα-rev: CAGCCTAGAGATCCAGCAAC. NRF2-for: AGGACATGGAGCAAGTTTGG. NRF2-rev: TTCTTTTTCCAGCGAGGAGA. PPARγ2-forw: TGGGTGAAACTCTGGGAGAT. PPARγ2-rev: GCTGGAGAAATCAACTGTGG. β-Tubulin rev: GTATTCATGATACGGTCAGGA. β-Tubulinforw: CCTTCTTGTTCGGTACCTACA. GST-A-forw: CGCCACCAAATATGACCTCT. GST-A-rev: CCTGTTGCCCACAAGGTAGT.
Statistical analysis
Student’s t-test was used to determine the significance of all data.
Results
CAIII regulates adipogenesis in mouse embryonic fibroblasts
Mouse embryonic fibroblasts (MEFs) were isolated from wild type (CAIII+/+), heterozygous (CAIII+/−) and homozygous CAIII knockout (CAIII−/−) C57BL/6 mice [1]. Western blot analysis confirmed the deletion of CAIII in the homozygous KO cells and a reduction of CAIII expression in heterozygous KO cells, compared with wild type cells (Fig. 1A). To study whether CAIII has an impact on fat cell differentiation, the MEFs were grown to confluence, and adipogenesis was induced by adding a hormone cocktail (dexamethasone, IBMX, insulin, and FCS). After 8 days, strong differences in lipid accumulation were detected between the three cell types (Fig. 1B and 1C). Whereas the wild type MEFs differentiated only at a moderate rate, a strong increase in the size of the fat droplets (Fig. 1B) and amount of triglycerides (Fig. 1B and 1C) was observed in the MEF CAIII+/− cells, and an even greater increase was seen in the MEF CAIII−/− cells. The CAIII protein was detectable in the MEF CAIII+/− cells at day 0 before adipogenesis, although at a lower level than in the MEF CAIII+/+ cells (Fig. 1B, lower panels). During adipogenesis, the CAIII protein levels were strongly increased in the MEF CAIII+/+ cells and, to a lesser extent, in the MEF CAIII+/− cells (Fig. 1B, lower panels). In the CAIII−/− negative MEFs, no CAIII protein was detected at day 0 nor during differentiation. These data indicate that CAIII negatively regulated adipogenesis in preadipocytes in a dose-dependent manner.
Fig. 1. CAIII knockout enhances fat droplet formation in MEFs.
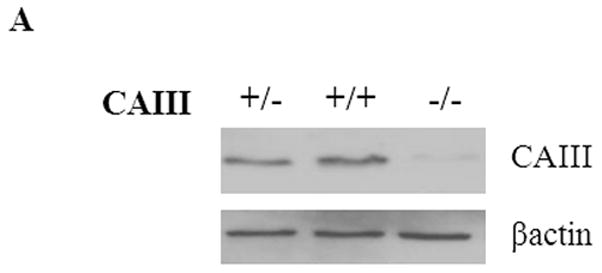
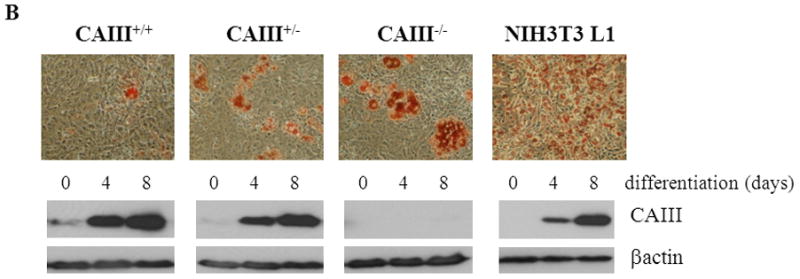
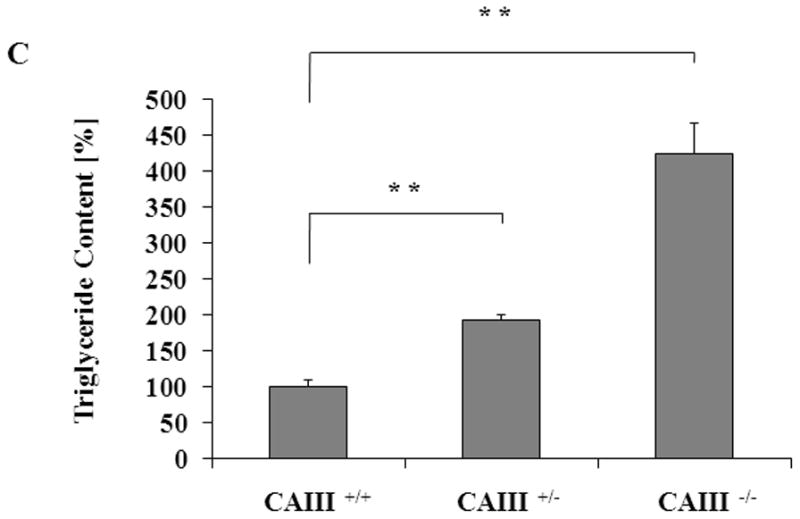
(A) CAIII protein levels in MEFCAIII+/+, MEFCAIII+/− and MEFCAIII−/− analyzed by Western blotting. β-Actin served as a loading control. (B and C) MEFs were exposed to hormone-cocktail to induce adipogenesis for 8 days. (B) At day 8 of differentiation, the MEFs were fixed, and the fat droplets were stained with Oil Red O (upper panels). Protein samples were taken for western blot analysis at days 0, 4 and 8 (lower panels). Differentiated NIH 3T3-L1 adipocytes are shown as the positive control. (C) The triglycride content in the different MEFs was quantified by densitometric analysis. Data are presented as the mean +/− SD of 4independent experiments, (**) p ≤ 0.01.
To investigate how CAIII regulates adipogenesis, we analyzed whether the CAIII KO affects the expression of the adipogenic key regulator PPARγ2, which is considered essential for the precursor cells to express the genes constituting the adipocyte phenotype [32]. When adipogenesis was induced by the hormone cocktail, we observed over an 1,100-fold induction of PPARγ2 gene expression in both CAIII+/− and MEF CAIII−/− MEF (Fig. 2A, left panel). The induction of PPARγ2 was considerably stronger than in the MEF CAIII+/+cells which showed a similar induction of PPARγ2 as NIH 3T3-L1 preadipocytes committed to adipogenic differentiation (Fig. 2A, left panel). To corroborate these findings, we also stimulated adipogenesis with the strong PPARγ2 agonist, troglitazone [39], and analyzed whether this had a synergistic effect on PPARγ2 gene expression in the MEF CAIII+/− as well as the MEF CAIII−/− cells. Under these conditions, we detected more than a 7,000-fold induction of PPARγ2 gene expression in both CAIII+/− MEF and CAIII−/− MEF (Fig. 2A, right panel). Troglitazone by itself, without the differentiation cocktail, had no effect on PPARγ2 expression in the MEFs (Fig. 2B), and fat droplets did not form until 8 days after addition of the troglitazone. Thus, the differentiation cocktail is essential for induction of adipogenesis in the CAIII knockout MEFs. These data strongly suggest that the CAIII KO dramatically and specifically facilitated differentiation cocktail-induced expression of the PPARγ2 gene at the onset of terminal adipogenic differentiation and implies that CAIII can decrease PPARγ2 gene expression.
Fig. 2. Expression of adipogenic key markers in MEFCAIII+/+, MEFCAIII+/− and MEFCAIII−/−.
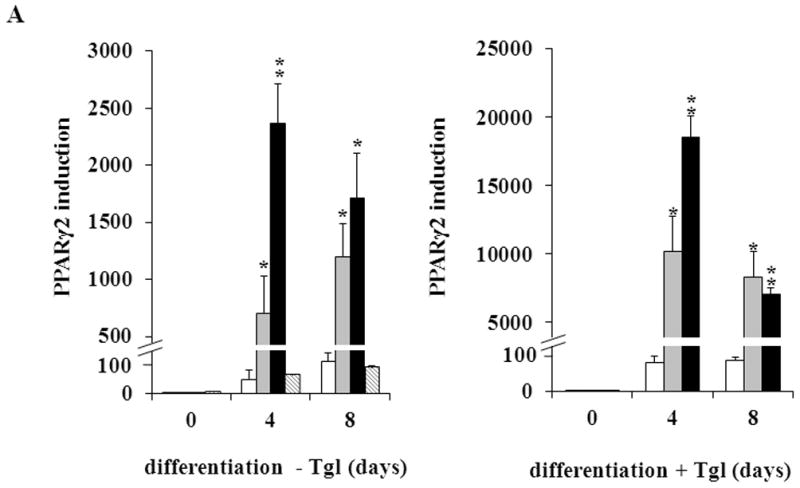
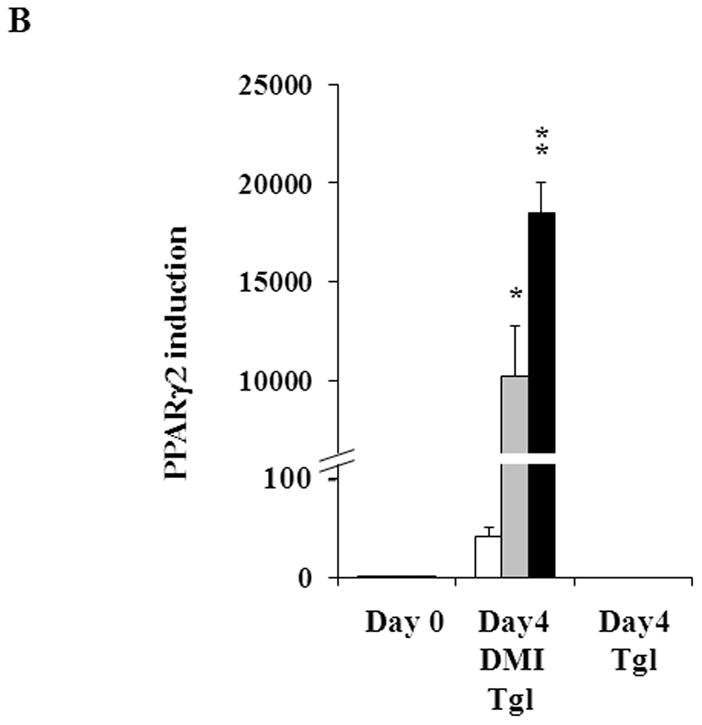
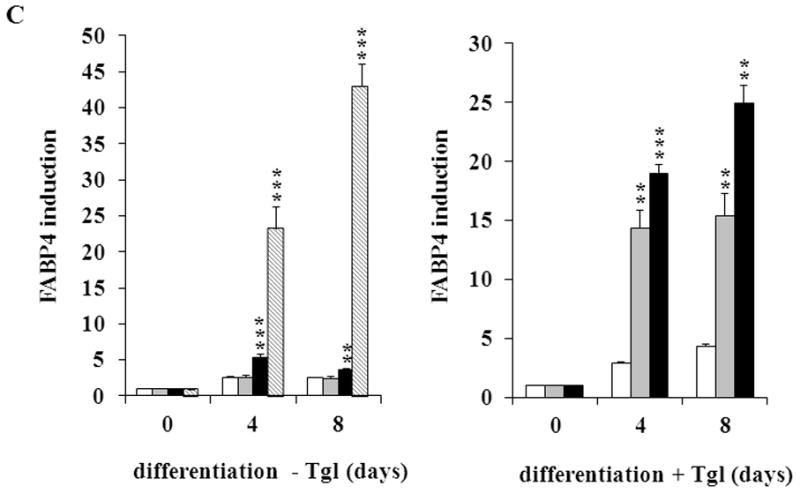
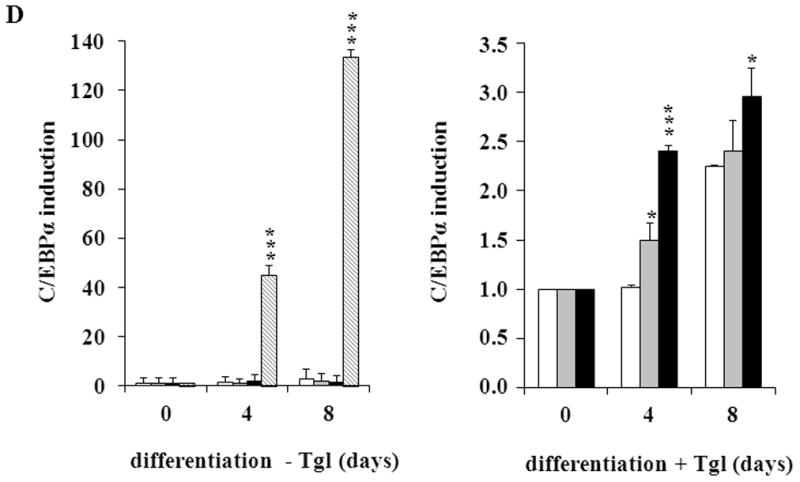
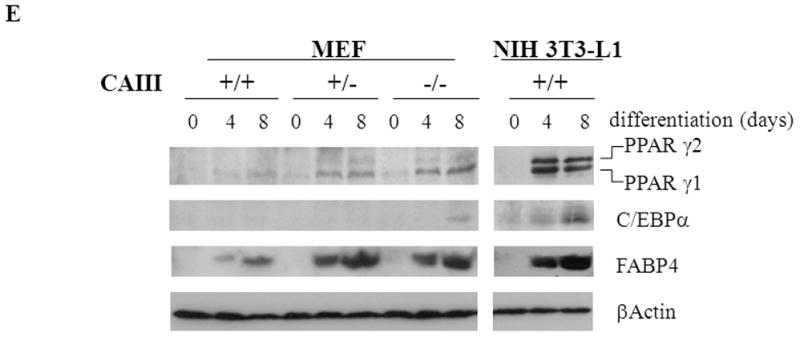
(A) MEFs were exposed to hormone-cocktail to induce adipogenesis for 8 days, either in the presence or absence of the PPARγ2 activator troglitazone (Tgl), as indicated. Q-RT-PCR analysis was performed at days 0, 4 and 8 of differentiation in MEFCAIII+/+ (white columns), MEFCAIII+/− (grey columns), MEFCAIII−/− cells (black columns), and NIH 3T3-L1 (diagonal-striped columns) for the adipogenic key markers PPARγ2. (B) MEFs were exposed to troglitazone (Tgl) without hormone-cocktail (DMI). Q-RT-PCR analysis of PPARγ2 was performed at day 4 after addition of Tgl in MEFCAIII+/+ (white columns), MEFCAIII+/− (grey columns), and MEFCAIII−/− cells (black columns). PPARγ2 expression in MEFCAIII+/+ (white columns), MEFCAIII+/− (grey columns), and MEFCAIII−/− cells (black columns) exposed to hormone-cocktail (DMI) and Tgl at day 4 of differentiation is shown for comparison. (C and D) The MEFs were exposed to hormone-cocktail to induce adipogenesis for 8 days, either in the presence or absence of troglitazone (Tgl), as indicated. Q-RT-PCR analysis was performed on days 0, 4 and 8 of differentiation in MEFCAIII+/+ (white columns), MEFCAIII+/− (grey columns), MEFCAIII−/− cells (black columns), and NIH 3T3-L1 (diagonal-striped columns) for FABP-4 (C), and C/EBPα (D). Data are presented as the mean +/− SD of 3 measurements, (*) p ≤ 0.05; (**) p ≤ 0.01; (***) p ≤ 0.001. (E) Western blot of differentiated MEFCAIII+/+, MEFCAIII+/−, MEFCAIII−/−, and NIH 3T3-L1 cells (days 0, 4 and 8) was performed as indicated, using antibodies against the adipogenic markers, PPARγ1 and 2, C/EBPα, and FABP-4. β-Actin served as a loading control. One representative set of western blots of three independent western blot experiments is shown.
Next, we investigated whether the CAIII KO facilitates the induction of other adipogenic regulators and differentiation products. We monitored the expression of C/EBPα, which is considered to be another adipogenic regulator contributing to terminal adipogenic differentiation [32], and the terminal differentiation marker, fatty acid binding protein-4 (FABP-4), in the CAIII KO MEFs. We found a significant increase in the FABP-4 gene expression levels in the MEFCAIII−/− cells (Fig. 2C, left panel), which was markedly increased in the troglitazone-treated cells (Fig. 2C, right panel). C/EBPα was only weakly induced, irrespective of the addition of troglitazone (Fig. 2D). In the presence of troglitazone, the CAIII KO cells showed a significantly stronger increase in C/EBPα induction than did the wild type cells. However, this was not true for differentiation without troglitazone, in which no significant differences in C/EBPα expression between the three MEF types was observed (Fig. 2D). Together, these findings suggest that the CAIII KO strongly facilitated PPARγ2 gene expression and that this was sufficient to drive terminal adipogenic differentiation. C/EBPα was only weakly up-regulated by the CAIII KO. This is consistent with studies that have shown that C/EBPα–deficient cells are capable of adipocyte differentiation [40].
Using Western blot analysis, we investigated whether mRNA expression of adipogenic key factors was mirrored at the protein level (Fig. 2E). NIH 3T3-L1 differentiation served as the control. C/EBPα was only detected in CAIII−/− cells 8 days after differentiation cocktail treatment, indicating that the most potent induction of differentiation occurred in these cells. PPARγ2 and FABP-4 appeared in all three of the differentiation cocktail-treated cell lines, but the amount in the CAIII+/− and CAIII−/− cells was much higher than that in the CAIII+/+ MEFs.
The intracellular redox set point becomes more oxidizing during adipogenesis in NIH 3T3-L1 preadipocytes [41]. Blocking the increase in oxidizing potential slows adipogenesis while further increasing the potential speeds adipogenesis [41, 42]. If CAIII functions as an antioxidant [7, 8], knocking out its gene would be expected to increase adipogenesis, as we observed. NF-E2-related factor 2 (NRF2) is a transcription factor activated by diverse oxidants that regulates gene expression by binding to antioxidant response elements (ARE) in the promoter regions of certain target genes [38, 43]. The PPAR γ2 promoter has an ARE and NRF2 was shown to induce PPARγ2 in NIH 3T3-L1 preadipocytes [44]. We therefore quantitated NRF2 transcripts in the MEFs to determine whether they were increased in the CAIII KO cells. They were not; indeed, we found an approximately 50% repression of NRF2 transcripts in the CAIII−/− MEFs relative to the wild type MEFs (Fig. 3A). NRF2 mRNA levels were also lower in in vitro-differentiated adipocytes derived from the MEF CAIII−/− cells than from the MEF CAIII+/+ cells (Fig. 3A). To address the question whether this led actually to decreased nuclear activity of NRF2, we measured the level of the transcript of a bona fide NRF2 antioxidant target gene, GSTA [45,46]. The mRNA level of GSTA was reduced by ~70% in the CAIII−/− MEFs compared to the wild type MEFs (Fig. 3B). GSTA mRNA levels were also lower in in vitro-differentiated adipocytes derived from the CAIII−/− cells than from the CAIII+/+ cells (Fig. 3B). Moreover, the protein level of GST decreased in the CAIII−/− cells relative to the CAIII+/+ cells (Fig. 3C). Together these data suggest that loss of CAIII decreases the expression level of NRF2 and the nuclear activity of NRF2 and indicate that PPARγ2 is not stimulated by NRF2. Intriguingly, a study by Shin et al., [47] showed that adipogenesis is accelerated in NRF2−/− MEFs which have lower expression level of the NRF2 target gene aryl hydrocarbon receptor (AHR), a negative regulator of adipogenesis which is downregulated following adipogenesis in MEFs. We found that the AHR mRNA levels were also considerably lower in CAIII−/− MEFs relative to CAIII+/+ MEFs (Fig. 3D). Thus, downregulation of NRF2 could indirectly contribute to increasing adipogenesis in our MEF CAIII−/− cells. The elucidation of the precise underlying mechanism will require additional studies.
Fig. 3. Expression of the NRF2 gene and of its target gene, GST, in MEFCAIII+/+, MEFCAIII+/− and MEFCAIII−/−.
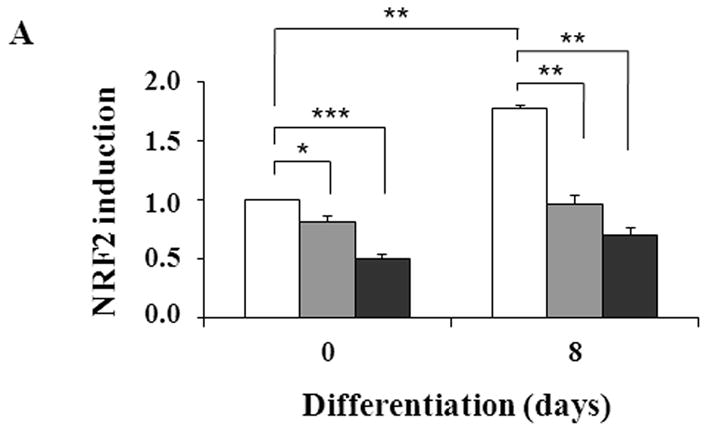
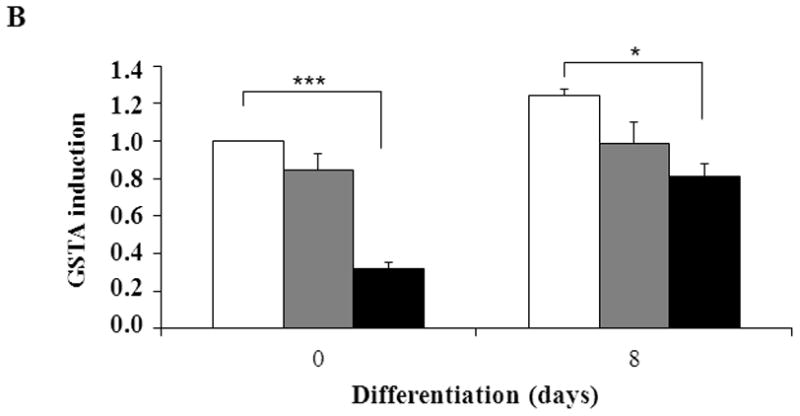

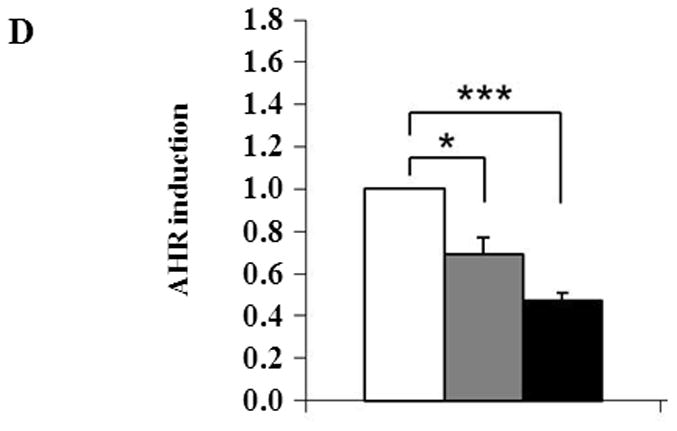
(A) NRF2 mRNA levels were monitored with q-RT-PCR analysis in MEFCAIII+/+ (white columns), MEFCAIII+/− (grey columns), and MEFCAIII−/− cells (black columns), before and 8 days after the induction of adipogenesis, as indicated. Data are presented as the mean +/− SD of 3 measurements, (*) p ≤ 0.05; (**) p ≤ 0.01; (***) p ≤ 0.001. (B) GSTA mRNA levels were monitored with q-RT-PCR analysis in MEFCAIII+/+ (white columns), MEFCAIII+/− (grey columns), and MEFCAIII−/− cells (black columns), before and 8 days after the induction of adipogenesis. Data are presented as the mean +/− SD of 3 measurements, (*) p ≤ 0.05; (***) p ≤ 0.001. (C) A GST western blot analysis in MEFCAIII+/+, MEFCAIII+/−, MEFCAIII−/−, and NIH 3T3-L1 cells before and 4 and 8 days after the induction of adipogenesis, as indicated, is shown. β-Actin served as a loading control. One representative western blot of three independent western blot experiments is shown. (D) AHR mRNA level were monitored with q-RT-PCR analysis in MEFCAIII+/+ (white columns), MEFCAIII+/− (grey columns), and MEFCAIII−/− cells (black columns). Data are presented as the mean +/− SD of 3 measurements, (*) p ≤ 0.05; (***) p ≤ 0.001.
Influence of CAIII on adipogenesis in NIH 3T3-L1 preadipocytes
To confirm the results from the CAIII-deficient MEFs, we studied NIH 3T3-L1 cells, a well-accepted tissue culture system for studying fat cell differentiation. CAIII was knocked down in NIH 3T3-L1 cells using two different shRNA constructs for CAIII mRNA, sh#2 and sh#3 (Fig. 4A). In undifferentiated NIH 3T3-L1 preadipocytes, qRT-PCR analysis demonstrated that CAIII was transcribed at low levels, similar to that described in preadipocytes [19]. Nevertheless, a significant reduction of CAIII mRNA was found in sh#2- and sh#3-containing NIH 3T3-L1 preadipocytes. NIH 3T3-L1 preadipocytes were differentiated according to the same protocol as that used for the MEFs. During differentiation, when CAIII was induced in the wild type NIH 3T3-L1 cells, a strong down-regulation of CAIII gene expression was detected in both the sh#2- and sh#3-containing NIH 3T3-L1 cells relative to the control shRNA-expressing cells. This relative down regulation became stronger with the progression of adipocyte differentiation (Fig. 4A). In keeping with the very low endogenous CAIII gene expression, the CAIII protein was barely detectable in the undifferentiated NIH 3T3-L1 preadipocytes in western blot experiments (Fig. 4B). Traces of CAIII protein were detectable only after a very long exposure (Fig. 4B, right panel), consistent with the qRT-PCR observations. After 4 days of induction of adipogenesis, CAIII protein was significantly reduced by both sh#2 and sh#3, although sh#2 was more effective than sh#3 (Fig. 4B, lower panel). The induction and progression of differentiation were monitored by assessing the expression of key adipogenic markers. Because the CAIII knockdown did not have a strong effect until day 4 of differentiation (Fig. 4B), the increase in induction of PPARγ2 and FABP-4 was less pronounced at day 4 than in the MEF CAIII−/−. However, both transcripts, PPARγ2 and FABP-4, were more strongly induced in the CAIII knockdown cells compared with the control cells (Fig. 4C). To demonstrate that the CAIII knockdown led to a stronger up-regulation of the PPARγ2 protein levels during differentiation, Western blot analysis at days 0, 2 and 4 of differentiation was conducted. Sh#2- and sh#3-transfected NIH 3T3-L1 cells had significantly higher PPARγ levels at day 4 of differentiation than wild-type cells. Because of the relatively strong induction of the basal PPARγ2 protein levels during adipogenic differentiation in the NIH 3T3-L1 cells, the increases due to CAIII knockdown were moderate but significantly different from the control (Fig. 4D). Moreover, the PPARγ2 protein levels correlated with the CAIII knockdown efficiency obtained in the sh#2 and sh#3 NIH 3T3-L1 cells (compare Fig. 4A, 4B and 4D). To test whether the activation of adipogenesis (p.e. FABP4) in the CAIII knockdown cells is in fact through PPARγ2, we analyzed whether FABP4 was still induced if PPARγ2 was silenced. We employed two different PPARγ2 shRNAs (Fig. 4E) in conducting CAIII/PPARγ2 double knockdown experiments. We treated cells with two PPARγ2 shRNAs, shPPARγ2#1 and PPARγ2#4, and with two CAIII shRNAs, shCAIII#2 and shCAIII#3 (Fig. 4E). We found that FABP4 induction was abrogated when PPARγ2 was silenced. This was detected at the FABP4 mRNA (Fig 4E) as well as protein level (Fig. 4F). We conclude that PPARγ2 is necessary for the induction of FABP4 in the CAIII knockdown cells.
Fig. 4. Influence of CAIII knockdown on the induction of adipogenesis in NIH 3T3-L1 preadipocytes.
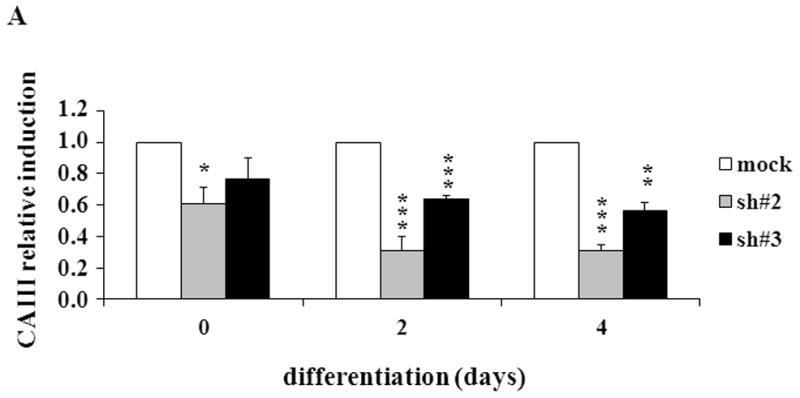
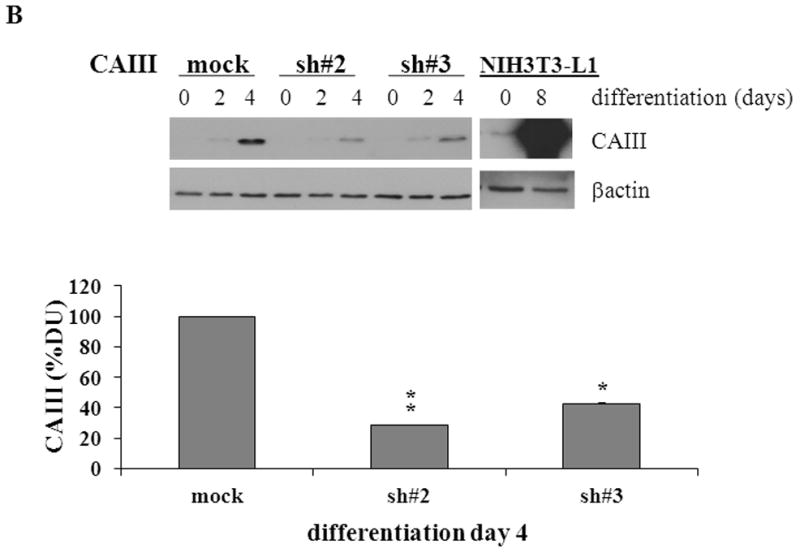
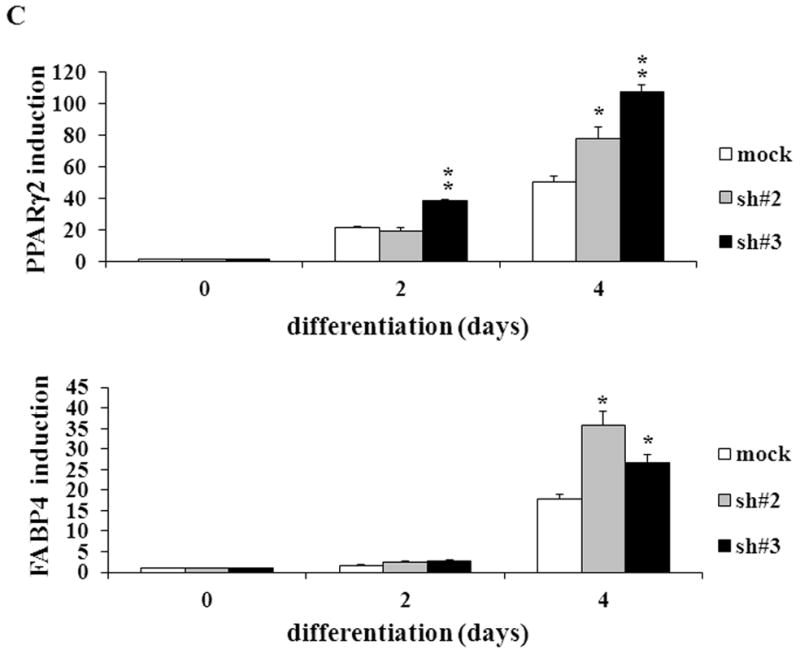
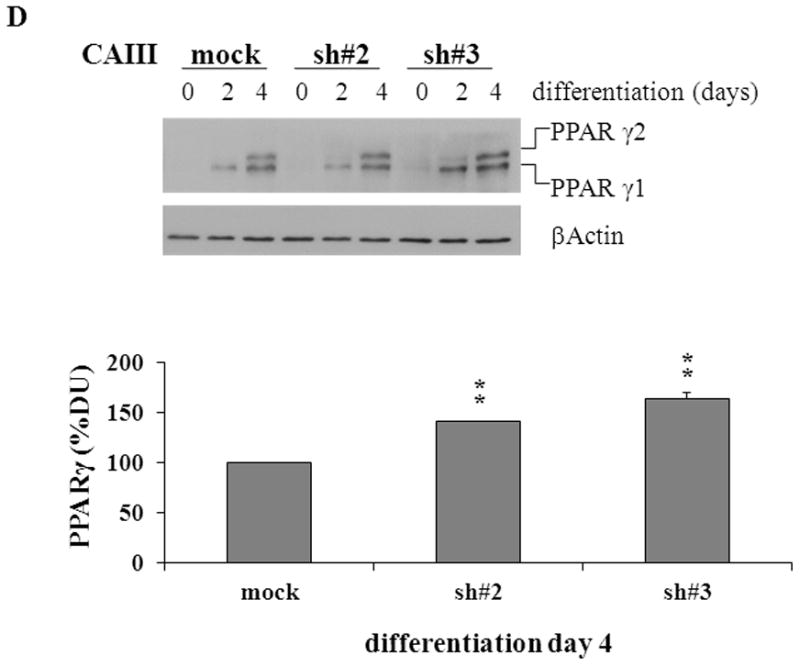
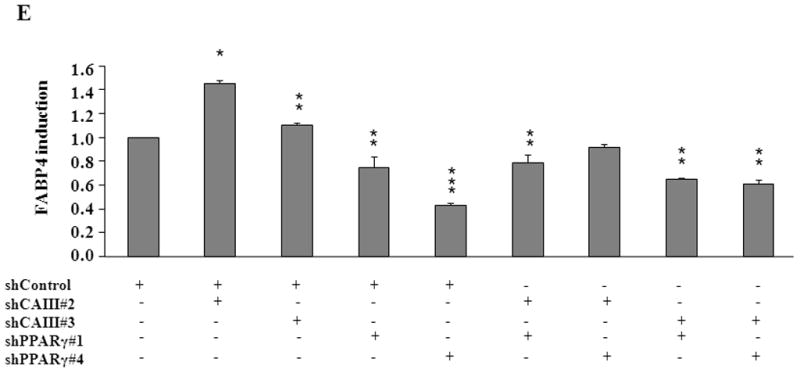
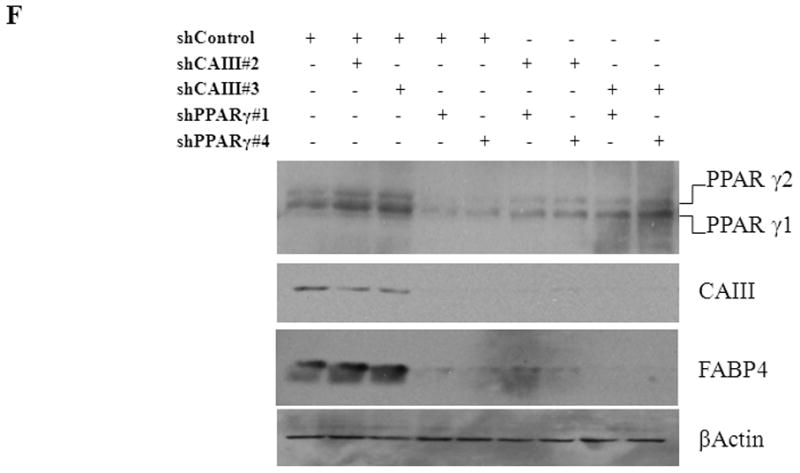
NIH 3T3-L1 cells were infected with two different lentivirus constructs expressing shRNA against CAIII, sh#2 and sh#3, and a mock construct as a control. Differentiation was induced, and samples were taken at days 0, 2 and 4. (A) CAIII knockdown was measured by qRT-PCR. Normalization was calculated relative to the mock construct. (B) Upper panel: The CAIII protein level was investigated by western blot analysis. β-Actin served as the loading control. Lower panel: The CAIII protein level at day 4 was measured densitometrically (DU = densitometry units). (C) The qRT-PCR expression analysis of adipogenic key regulatory genes, PPARγ2 (upper panel) and FABP-4 (lower panel) is shown. (D) The PPARγ protein levels were detected by western blotting. β-actin served as a loading control (upper panel). A densitometric evaluation of the PPARγ protein levels at day 4 of differentiation was performed (lower panel). All data are presented as the mean +/− SD of 3 measurements, (*) p ≤ 0.05; (**) p ≤ 0.01; (***) p ≤ 0.001. (E and F) NIH 3T3-L1 cells were infected with different combinations of lentivirus constructs expressing shRNA against CAIII (sh#2 and sh#3), PPARγ2 (sh#1 and sh#4) and/or a mock construct (sh#Control) as indicated. (E) Differentiation was induced and FABP4 mRNA level measured at day 4 by q-RT PCR. (F) Differentiation was induced and CAIII, FABP4 and PPARγ protein level measured at day 4 by western blotting. β-actin served as a loading control.
To analyse whether the overexpression of CAIII has also effects on adipogenesis, NIH 3T3-L1 preadipocytes were infected with a CAIII overexpressing lentivirus, plentiCAIII, or a control lentivirus. Adipogenesis was induced, and the expression of CAIII, PPARγ2, C/EBPα and FABP4 was monitored. On day 0 and day 2, CAIII mRNA levels were considerably higher in NIH 3T3-L1/plentiCAIII relative to NIH 3T3-L1/plentiEmpty (Fig. 5A, upper panel). These differences narrowed on later days (Fig. 5A, lower panel), most likely due to the strong induction of endogenous CAIII during adipogenesis. Western blot experiments showed that the CAIII protein levels were also higher in the NIH 3T3-L1/plentiCAIII cells through day 4 of differentiation (Fig. 5B). Q-RT-PCR analysis demonstrated that the induction of the adipogenic factors PPARγ2 and C/EBPα and of the adipogenic differentiation marker FABP4 were similar in CAIII overexpressing cells and control cells (Fig. 5C). We conclude that overexpression of CAIII in NIH 3T3-L1 preadipocytes has no substantive effect on adipogenic differentiation.
Fig. 5. Influence of overexpression of CAIII on the induction of adipogenesis in NIH 3T3-L1 preadipocytes.
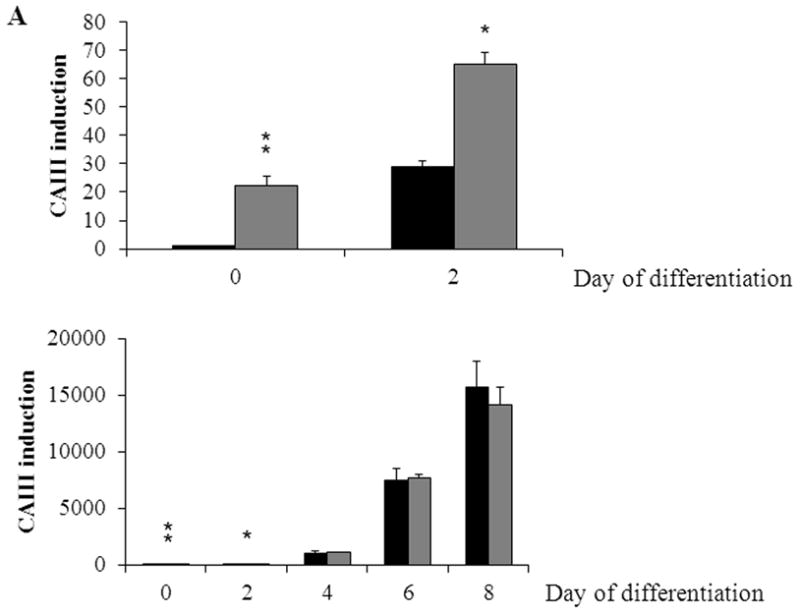
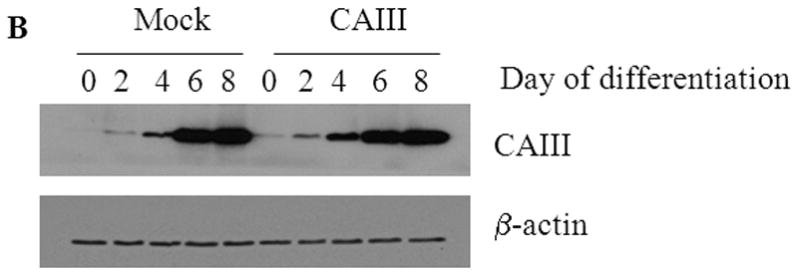
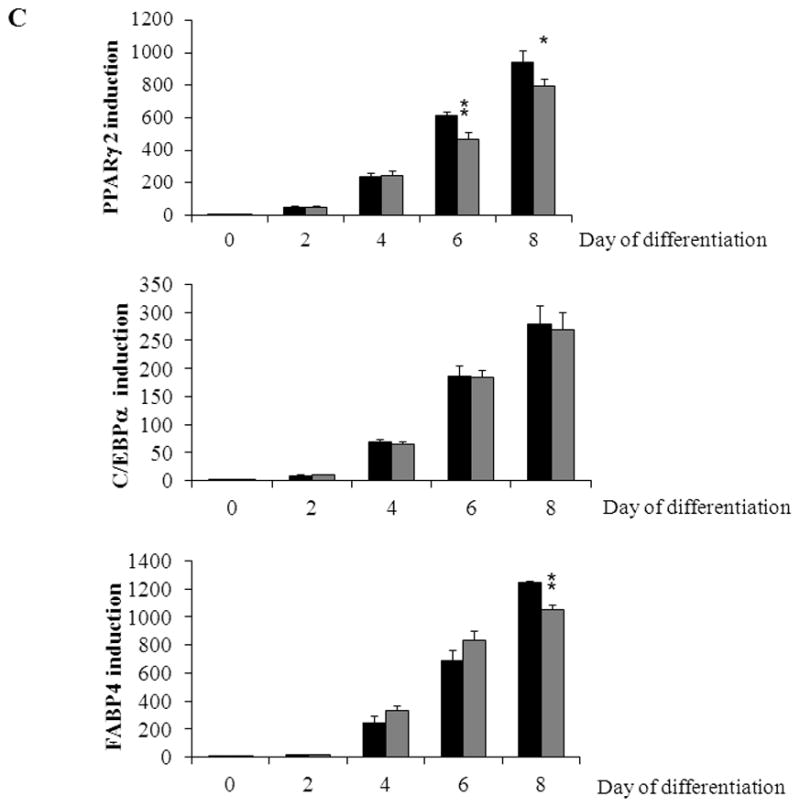
NIH 3T3-L1 cells were infected with plentiCAIII overexpressing CAIII or a mock construct (plentiEmpty). Differentiation was induced, and samples were taken on days 0, 2, 4, 6 and 8. (A) CAIII overexpression was measured by qRT-PCR in NIH 3T3-L1/plentiEmpty (black columns) and in NIH 3T3-L1/plentiCAIII (grey columns). Normalization was calculated relative to the mock construct. (B) The CAIII protein level was measured by Western blot. β-actin served as the loading control. (C) The qRT-PCR expression analysis of the key adipogenic regulatory genes, PPARγ2 (upper panel) and C/EBPα (middle panel) and of the differentiation marker FABP-4 (lower panel) is shown in NIH 3T3-L1/plentiEmpty (black columns) and in NIH 3T3-L1/plentiCAIII (grey columns). All data are presented as the mean +/− SD of 3 measurements, (*) p ≤ 0.05; (**) p ≤ 0.01.
Discussion
Several studies have suggested that CAIII plays an important role as an anti-oxidant in the protection against oxidative stress and aging [4–12]. CAIII is the most abundant protein in murine fat tissues [21], and CAIII levels are specifically fat-regulated in obesity [28]. For these reasons, it is conceivable that CAIII may be involved in adipocyte metabolism and function, probably playing a role in the protection against ROS generated in the highly metabolically active fat tissues [48]. However, mouse CAIII deletion mutants have normal development and life span; no phenotypic changes were detected [1]. While no difference in the function, distribution, and amount of fat tissue [1] was observed in the CAIII KO mice, we have now shown a clear effect of CAIII in adipocyte differentiation of cultured MEFs from those mice. CAIII was involved in the regulation of adipogenesis in preadipocytes. Cells lacking CAIII exhibited increased fat cell differentiation in response to hormone cocktail. Despite the fact that CAIII has been shown to be strongly induced during adipogenesis and is highly abundant in mature adipocytes [20], the protein does not seem to be essential for the course of the normal terminal adipogenic differentiation process. Rather, our data suggest that CAIII regulates the initiation of adipogenesis during an early step in preadipocytes. This conclusion is supported by the finding that the expression of PPARγ2 was strongly enhanced after the CAIII deletion, indicating that CAIII negatively regulates adipogenesis at the level of PPARγ2 expression. With the addition of troglitazone, the enhancing effect of CAIII deletion on PPARγ2 became even more striking, possibly because of the positive feedback loop of PPARγ2 on its own expression [49]. For these reasons, we suggest that CAIII is a negative regulator of PPARγ2 expression and hence, adipogenesis.
As noted above, CAIII may participate in defense against oxidative stresses [7, 8]. If so, deletion of CAIII would increase oxidative stress which would be expected to increase the level of NRF2, one of the master regulators of the antioxidant response. Interestingly, we found that NRF2 levels actually decreased in MEF CAIII−/− cells. The mechanism by which a decrease in CAIII causes a decrease in NRF2 levels is unknown and will be of interest to study. Regardless of the mechanism affecting NRF2, PPARγ2 and adipogenesis are increased in the knockout and knockdown cells, and these increases must be mediated by factors other than NRF2.
In conclusion our data suggest that CAIII modulates the adipogenesis through two mechanisms, its antioxidant function [4–12] and its ability to regulate gene expression.
Highlights.
We discover a novel function of Carbonic anhydrase III (CAIII).
We show that CAIII is a regulator of adipogenesis.
We demonstrate that CAIII acts at the level of PPARγ2 gene expression.
Our data contribute to a better understanding of the role of CAIII in fat tissue.
Acknowledgments
We are grateful to D. Trono (Lausanne, Switzerland) for the plasmid pMD2.G and psPAX2. This work was supported by funding from the Austrian Academy of Sciences (M.C.M., U.R., W.Z.) and by the Intramural Research Program of the National Heart, Lung, and Blood Institute (G.K., R.L.L.).
Abbreviations
- ARE
antioxidant response elements
- CAIII
Carbonic anhydrase III
- C/EBPα
CCAAT/enhancer binding protein-α
- FABP-4
fatty acid-binding protein-4
- GSH
glutathione
- IBMX
3-Isobutyl-1-methylxanthin
- KO
knockout
- MEF
mouse embryonic fibroblasts
- NRF2
NF-E2-related factor 2
- PPARγ2
peroxisome proliferator-activated receptor-γ2
- ROS
reactive oxygen species
- Tgl
troglitazone
Footnotes
Publisher's Disclaimer: This is a PDF file of an unedited manuscript that has been accepted for publication. As a service to our customers we are providing this early version of the manuscript. The manuscript will undergo copyediting, typesetting, and review of the resulting proof before it is published in its final citable form. Please note that during the production process errors may be discovered which could affect the content, and all legal disclaimers that apply to the journal pertain.
References
- 1.Kim G, Lee TH, Wetzel P, Geers C, Robinson MA, Myers TG, Owens JW, Wehr NB, Eckhaus MW, Gros G, Wynshaw-Boris A, Levine RL. Carbonic anhydrase III is not required in the mouse for normal growth, development, and life span. Mol Cell Biol. 2004;24:9942–9947. doi: 10.1128/MCB.24.22.9942-9947.2004. [DOI] [PMC free article] [PubMed] [Google Scholar]
- 2.Supuran CT. Carbonic anhydrases: novel therapeutic applications for inhibitors and activators. Nat Rev Drug Discov. 2008;7:168–181. doi: 10.1038/nrd2467. [DOI] [PubMed] [Google Scholar]
- 3.Sanyal G, Swenson ER, Pessah NI, Maren TH. The carbon dioxide hydration activity of skeletal muscle carbonic anhydrase. Inhibition by sulfonamides and anions. Mol Pharmacol. 1982;22:211–220. [PubMed] [Google Scholar]
- 4.Chai YC, Jung CH, Lii CK, Ashraf SS, Hendrich S, Wolf B, Sies H, Thomas JA. Identification of an abundant S-thiolated rat liver protein as carbonic anhydrase III; characterization of S-thiolation and dethiolation reactions. Arch Biochem Biophys. 1991;284:270–278. doi: 10.1016/0003-9861(91)90295-t. [DOI] [PubMed] [Google Scholar]
- 5.Lii CK, Chai YC, Zhao W, Thomas JA, Hendrich S. S-thiolation and irreversible oxidation of sulfhydryls on carbonic anhydrase III during oxidative stress: a method for studying protein modification in intact cells and tissues. Arch Biochem Biophys. 1994;308:231–239. doi: 10.1006/abbi.1994.1033. [DOI] [PubMed] [Google Scholar]
- 6.Thomas JA, Poland B, Honzatko R. Protein sulfhydryls and their role in the antioxidant function of protein S-thiolation. Arch Biochem Biophys. 1995;319:1–9. doi: 10.1006/abbi.1995.1261. [DOI] [PubMed] [Google Scholar]
- 7.Cabiscol E, Levine RL. Carbonic anhydrase III. Oxidative modification in vivo and loss of phosphatase activity during aging. J Biol Chem. 1995;270:14742–14747. doi: 10.1074/jbc.270.24.14742. [DOI] [PubMed] [Google Scholar]
- 8.Raisanen SR, Lehenkari P, Tasanen M, Rahkila P, Harkonen PL, Vaananen HK. Carbonic anhydrase III protects cells from hydrogen peroxide-induced apoptosis. FASEB J. 1999;13:513–522. doi: 10.1096/fasebj.13.3.513. [DOI] [PubMed] [Google Scholar]
- 9.Cabiscol E, Levine RL. The phosphatase activity of carbonic anhydrase III is reversibly regulated by glutathiolation. Proc Natl Acad Sci U S A. 1996;93:4170–4174. doi: 10.1073/pnas.93.9.4170. [DOI] [PMC free article] [PubMed] [Google Scholar]
- 10.Mallis RJ, Hamann MJ, Zhao W, Zhang T, Hendrich S, Thomas JA. Irreversible thiol oxidation in carbonic anhydrase III: protection by S-glutathiolation and detection in aging rats. Biol Chem. 2002;383:649–662. doi: 10.1515/BC.2002.067. [DOI] [PubMed] [Google Scholar]
- 11.Thomas JA, Mallis RJ. Aging and oxidation of reactive protein sulfhydryls. Exp Gerontol. 2001;36:1519–1526. doi: 10.1016/s0531-5565(01)00137-1. [DOI] [PubMed] [Google Scholar]
- 12.Chen CN, Ferrington DA, Thompson LV. Carbonic anhydrase III and four-and-a-half LIM protein 1 are preferentially oxidized with muscle unloading. J Appl Physiol. 2008;105:1554–1561. doi: 10.1152/japplphysiol.90680.2008. [DOI] [PMC free article] [PubMed] [Google Scholar]
- 13.Harman D. Aging: a theory based on free radical and radiation chemistry. J Gerontol. 1956;11:298–300. doi: 10.1093/geronj/11.3.298. [DOI] [PubMed] [Google Scholar]
- 14.Lyons GE, Buckingham ME, Tweedie S, Edwards YH. Carbonic anhydrase III, an early mesodermal marker, is expressed in embryonic mouse skeletal muscle and notochord. Development. 1991;111:233–244. doi: 10.1242/dev.111.1.233. [DOI] [PubMed] [Google Scholar]
- 15.Tashian RE. The carbonic anhydrases: widening perspectives on their evolution, expression and function. Bioessays. 1989;10:186–192. doi: 10.1002/bies.950100603. [DOI] [PubMed] [Google Scholar]
- 16.Rosen ED, Spiegelman BM. Adipocytes as regulators of energy balance and glucose homeostasis. Nature. 2006;444:847–853. doi: 10.1038/nature05483. [DOI] [PMC free article] [PubMed] [Google Scholar]
- 17.Spicer SS, Ge ZH, Tashian RE, Hazen-Martin DJ, Schulte BA. Comparative distribution of carbonic anhydrase isozymes III and II in rodent tissues. Am J Anat. 1990;187:55–64. doi: 10.1002/aja.1001870107. [DOI] [PubMed] [Google Scholar]
- 18.Lynch CJ, Brennan WA, Jr, Vary TC, Carter N, Dodgson SJ. Carbonic anhydrase III in obese Zucker rats. Am J Physiol. 1993;264:E621–630. doi: 10.1152/ajpendo.1993.264.4.E621. [DOI] [PubMed] [Google Scholar]
- 19.Lynch CJ, Hazen SA, Horetsky RL, Carter ND, Dodgson SJ. Differentiation-dependent expression of carbonic anhydrase II and III in 3T3 adipocytes. Am J Physiol. 1993;265:C234–243. doi: 10.1152/ajpcell.1993.265.1.C234. [DOI] [PubMed] [Google Scholar]
- 20.Gabrielsson BL, Carlsson B, Carlsson LM. Partial genome scale analysis of gene expression in human adipose tissue using DNA array. Obes Res. 2000;8:374–384. doi: 10.1038/oby.2000.45. [DOI] [PubMed] [Google Scholar]
- 21.Bolduc C, Larose M, Lafond N, Yoshioka M, Rodrigue MA, Morissette J, Labrie C, Raymond V, St-Amand J. Adipose tissue transcriptome by serial analysis of gene expression. Obes Res. 2004;12:750–757. doi: 10.1038/oby.2004.90. [DOI] [PubMed] [Google Scholar]
- 22.Spiegelman BM, Flier JS. Obesity and the regulation of energy balance. Cell. 2001;104:531–543. doi: 10.1016/s0092-8674(01)00240-9. [DOI] [PubMed] [Google Scholar]
- 23.Haslam DW, James WP. Obesity. Lancet. 2005;366:1197–1209. doi: 10.1016/S0140-6736(05)67483-1. [DOI] [PubMed] [Google Scholar]
- 24.Furukawa S, Fujita T, Shimabukuro M, Iwaki M, Yamada Y, Nakajima Y, Nakayama O, Makishima M, Matsuda M, Shimomura I. Increased oxidative stress in obesity and its impact on metabolic syndrome. J Clin Invest. 2004;114:1752–1761. doi: 10.1172/JCI21625. [DOI] [PMC free article] [PubMed] [Google Scholar]
- 25.Urakawa H, Katsuki A, Sumida Y, Gabazza EC, Murashima S, Morioka K, Maruyama N, Kitagawa N, Tanaka T, Hori Y, Nakatani K, Yano Y, Adachi Y. Oxidative stress is associated with adiposity and insulin resistance in men. J Clin Endocrinol Metab. 2003;88:4673–4676. doi: 10.1210/jc.2003-030202. [DOI] [PubMed] [Google Scholar]
- 26.Yun Z, Maecker HL, Johnson RS, Giaccia AJ. Inhibition of PPAR gamma 2 gene expression by the HIF-1-regulated gene DEC1/Stra13: a mechanism for regulation of adipogenesis by hypoxia. Dev Cell. 2002;2:331–341. doi: 10.1016/s1534-5807(02)00131-4. [DOI] [PubMed] [Google Scholar]
- 27.Carriere A, Carmona MC, Fernandez Y, Rigoulet M, Wenger RH, Penicaud L, Casteilla L. Mitochondrial reactive oxygen species control the transcription factor CHOP-10/GADD153 and adipocyte differentiation: a mechanism for hypoxia-dependent effect. J Biol Chem. 2004;279:40462–40469. doi: 10.1074/jbc.M407258200. [DOI] [PubMed] [Google Scholar]
- 28.Stanton LW, Ponte PA, Coleman RT, Snyder MA. Expression of CA III in rodent models of obesity. Mol Endocrinol. 1991;5:860–866. doi: 10.1210/mend-5-6-860. [DOI] [PubMed] [Google Scholar]
- 29.Lynch CJ, McCall KM, Billingsley ML, Bohlen LM, Hreniuk SP, Martin LF, Witters LA, Vannucci SJ. Pyruvate carboxylase in genetic obesity. Am J Physiol. 1992;262:E608–618. doi: 10.1152/ajpendo.1992.262.5.E608. [DOI] [PubMed] [Google Scholar]
- 30.Spalding KL, Arner E, Westermark PO, Bernard S, Buchholz BA, Bergmann O, Blomqvist L, Hoffstedt J, Naslund E, Britton T, Concha H, Hassan M, Ryden M, Frisen J, Arner P. Dynamics of fat cell turnover in humans. Nature. 2008;453:783–787. doi: 10.1038/nature06902. [DOI] [PubMed] [Google Scholar]
- 31.Gesta S, Tseng YH, Kahn CR. Developmental origin of fat: tracking obesity to its source. Cell. 2007;131:242–256. doi: 10.1016/j.cell.2007.10.004. [DOI] [PubMed] [Google Scholar]
- 32.Farmer SR. Transcriptional control of adipocyte formation. Cell Metab. 2006;4:263–273. doi: 10.1016/j.cmet.2006.07.001. [DOI] [PMC free article] [PubMed] [Google Scholar]
- 33.Cao Z, Umek RM, McKnight SL. Regulated expression of three C/EBP isoforms during adipose conversion of 3T3-L1 cells. Genes Dev. 1991;5:1538–1552. doi: 10.1101/gad.5.9.1538. [DOI] [PubMed] [Google Scholar]
- 34.Tontonoz P, Graves RA, Budavari AI, Erdjument-Bromage H, Lui M, Hu E, Tempst P, Spiegelman BM. Adipocyte-specific transcription factor ARF6 is a heterodimeric complex of two nuclear hormone receptors, PPAR gamma and RXR alpha. Nucleic Acids Res. 1994;22:5628–5634. doi: 10.1093/nar/22.25.5628. [DOI] [PMC free article] [PubMed] [Google Scholar]
- 35.Houstis N, Rosen ED, Lander ES. Reactive oxygen species have a causal role in multiple forms of insulin resistance. Nature. 2006;440:944–948. doi: 10.1038/nature04634. [DOI] [PubMed] [Google Scholar]
- 36.Luo W, Cao J, Li J, He W. Adipose tissue-specific PPARgamma deficiency increases resistance to oxidative stress. Exp Gerontol. 2008;43:154–163. doi: 10.1016/j.exger.2007.11.002. [DOI] [PubMed] [Google Scholar]
- 37.Hogan B, Beddington R, Costantini F, Lacey E. Manipulating the Mouse Embryo: A Laboratory Manual. Cold Spring Harbor Laboratory Press; New York: 1994. [Google Scholar]
- 38.Jodar L, Mercken EM, Ariza J, Younts C, Gonzalez-Reyes JA, Alcain FJ, Buron I, de Cabo R, Villalba JM. Genetic deletion of Nrf2 promotes immortalization and decreases life span of murine embryonic fibroblasts. J Gerontol A Biol Sci Med Sci. 2010;66:247–256. doi: 10.1093/gerona/glq181. [DOI] [PMC free article] [PubMed] [Google Scholar]
- 39.Peraldi P, Xu M, Spiegelman BM. Thiazolidinediones block tumor necrosis factor-alpha-induced inhibition of insulin signaling. J Clin Invest. 1997;100:1863–1869. doi: 10.1172/JCI119715. [DOI] [PMC free article] [PubMed] [Google Scholar]
- 40.Wu Z, Rosen ED, Brun R, Hauser S, Adelmant G, Troy AE, McKeon C, Darlington GJ, Spiegelman BM. Cross-regulation of C/EBP alpha and PPAR gamma controls the transcriptional pathway of adipogenesis and insulin sensitivity. Mol Cell. 1999;3:151–158. doi: 10.1016/s1097-2765(00)80306-8. [DOI] [PubMed] [Google Scholar]
- 41.Imhoff BR, Hansen JM. Extracellular redox environments regulate adipocyte differentiation. Differentiation. 2010;80:31–39. doi: 10.1016/j.diff.2010.04.005. [DOI] [PubMed] [Google Scholar]
- 42.Takahashi T, Tabuchi T, Tamaki Y, Kosaka K, Takikawa Y, Satoh T. Carnosic acid and carnosol inhibit adipocyte differentiation in mouse 3T3-L1 cells through induction of phase2 enzymes and activation of glutathione metabolism. Biochem Biophys Res Commun. 2009;382:549–554. doi: 10.1016/j.bbrc.2009.03.059. [DOI] [PubMed] [Google Scholar]
- 43.Cho HY, Reddy SP, Kleeberger SR. Nrf2 defends the lung from oxidative stress. Antioxid Redox Signal. 2006;8:76–87. doi: 10.1089/ars.2006.8.76. [DOI] [PubMed] [Google Scholar]
- 44.Pi J, Leung L, Xue P, Wang W, Hou Y, Liu D, Yehuda-Shnaidman E, Lee C, Lau J, Kurtz TW, Chan JY. Deficiency in the nuclear factor E2-related factor-2 transcription factor results in impaired adipogenesis and protects against diet-induced obesity. J Biol Chem. 2010;285:9292–9300. doi: 10.1074/jbc.M109.093955. [DOI] [PMC free article] [PubMed] [Google Scholar]
- 45.Reisman SA, Csanaky IL, Yeager RL, Klaassen CD. Nrf2 activation enhances biliary excretion of sulfobromophthalein by inducing glutathione-S-transferase activity. Toxicol Sci. 2009;109:24–30. doi: 10.1093/toxsci/kfp045. [DOI] [PMC free article] [PubMed] [Google Scholar]
- 46.Chanas SA, Jiang Q, McMahon M, McWalter GK, McLellan LL, Elcombe CR, Henderson CJ, Wolf CR, Moffat GJ, Itoh K, Yamamoto M, Hayes JD. Loss of the Nrf2 transcription factor causes a marked reduction in constitutive and inducible expression of the glutathione S-transferase Gsta1, Gsta2, Gstm1, Gstm2, Gstm3 and Gstm4 genes in the livers of male and female mice. Biochem J. 2002;365:405–416. doi: 10.1042/BJ20020320. [DOI] [PMC free article] [PubMed] [Google Scholar]
- 47.Shin S, Wakabayashi N, Misra V, Biswal S, Lee GH, Agoston ES, Yamamoto M, Kensler TM. NRF2 modulates aryl hydrocarbon receptor signaling: influence on adipogenesis. Mol Cell Biol. 2007;27:7188–7197. doi: 10.1128/MCB.00915-07. [DOI] [PMC free article] [PubMed] [Google Scholar]
- 48.Tahara EB, Navarete FD, Kowaltowski AJ. Tissue-, substrate-, and site-specific characteristics of mitochondrial reactive oxygen species generation. Free Radic Biol Med. 2009;46:1283–1297. doi: 10.1016/j.freeradbiomed.2009.02.008. [DOI] [PubMed] [Google Scholar]
- 49.Wakabayashi K, Okamura M, Tsutsumi S, Nishikawa NS, Tanaka T, Sakakibara I, Kitakami J, Ihara S, Hashimoto Y, Hamakubo T, Kodama T, Aburatani H, Sakai J. The peroxisome proliferator-activated receptor gamma/retinoid X receptor alpha heterodimer targets the histone modification enzyme PR-Set7/Setd8 gene and regulates adipogenesis through a positive feedback loop. Mol Cell Biol. 2009;29:3544–3555. doi: 10.1128/MCB.01856-08. [DOI] [PMC free article] [PubMed] [Google Scholar]


