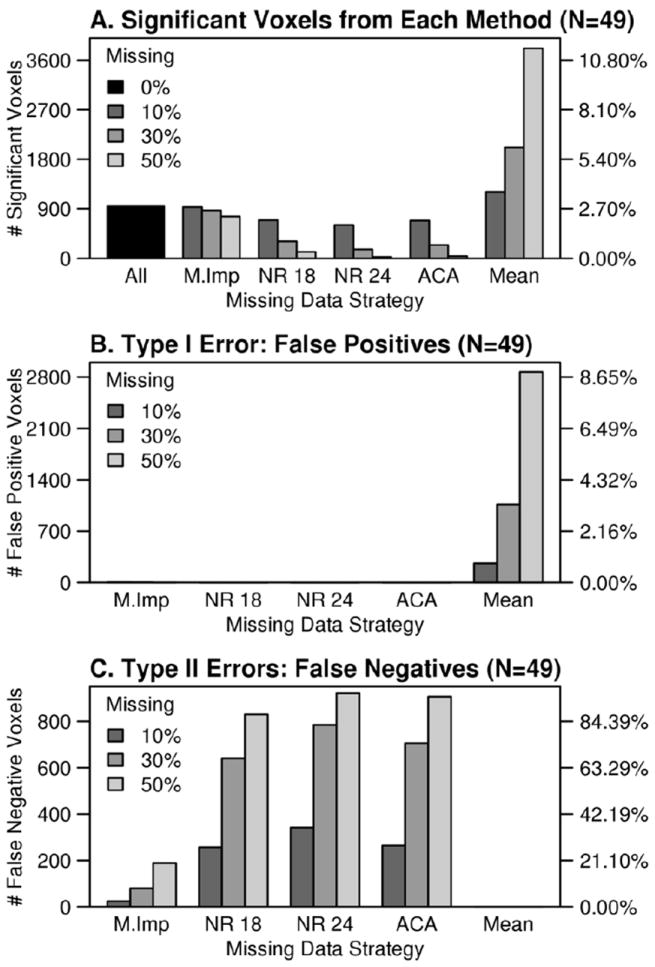
Figure 5.

A) The number of significant voxels in simulated-complete results compared to imputed results (N=49). Missing data methods were abbreviated as follows: M.Imp = multiple imputation, ACA = available case analysis, NR 18 = neighbor replacement (18 mm), NR 24 = neighbor replacement (24 mm), Mean = mean replacement. The second y-axis in A) indicates the proportion of total voxels that were significant at the p<0.05 level (Family-Wise Error corrected) for each approach. B) Mean replacement showed a strong Type I error bias. The second y-axis in B) shows the proportion of the non-significant voxels in the simulated-complete results that survived an identical threshold after imputation. C) Type II error rates were calculated by counting voxels that were significant according to simulated-complete t-tests, but non-significant after missing data were imputed. The second y-axis in C) gives the proportion significant voxels in the simulated-complete results that were not significant in the imputed results.
