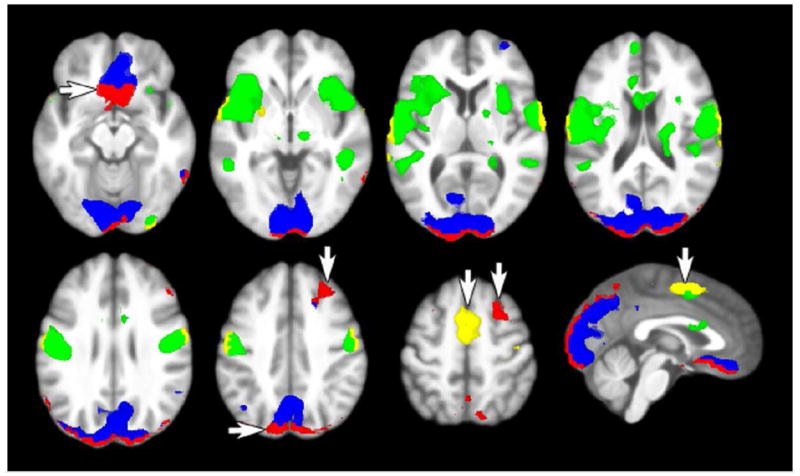
Figure 9.

Multiple imputation increased the spatial extent of clusters that showed significant task-correlated activity and revealed otherwise hidden clusters that contained missing data. The standard analysis found positive (green) and negative (blue) task-correlated activity, but multiple imputation identified 57.9% more voxels per cluster (positive: yellow, negative: red) on average.
