

Abstract
Public reporting on the quality of ambulatory health care is growing, but knowledge of how physician groups respond to such reporting has not kept pace. We examined responses to public reporting on the quality of diabetes care in 409 primary care clinics within seventeen large, multispecialty physician groups. We determined that a focus on publicly reported metrics, along with participation in large or externally sponsored projects, increased a clinic’s implementation of diabetes improvement interventions. Clinics were also more likely to implement interventions in more recent years. Public reporting helped drive both early implementation of a single intervention and ongoing implementation of multiple simultaneous interventions. To fully engage physician groups, accountability metrics should be structured to capture incremental improvements in quality, thereby rewarding both early and ongoing improvement activities.
Public reporting of health care quality is expanding rapidly, but the science of public reporting has not kept pace. There is some evidence that public reporting leads to improvement in reported quality metrics, but little is known about why this improvement occurs.1-3 In particular, it is not clear whether and how health care organizations use information from public reporting to make decisions.4 Most research has focused on patients’ use of publicly reported information on hospitals and health plans,1 leaving large gaps in our knowledge about the use of information from public reporting on ambulatory care.
The earliest and most well-established efforts to make data on the quality of ambulatory care publicly available have focused on patients with diabetes.5,6 Diabetes affects more than 8 percent of the US population7 and requires ongoing monitoring through laboratory testing.8,9 This simplifies the use of performance metrics in assessing diabetes care.
Yet despite widespread reporting on ambulatory diabetes performance,6 the link between public reporting and diabetes improvement activities is not understood. Greater understanding of how physician groups respond to public reporting could support the use of public reporting as an incentive to improve quality. This is particularly important for diabetes, given the widespread debate over the value of public reporting for diabetes metrics.10
We examined the link between public reporting of diabetes performance and diabetes-focused quality improvement activities in the Wisconsin Collaborative for Healthcare Quality, an organization of physician groups that has publicly reported its performance on diabetes care since 2004.11 We used data from a survey of diabetes quality improvement initiatives between 2003 and 2008 at 409 primary care clinics of the collaborative’s members.
The collaborative includes large, multispecialty physician groups encompassing approximately half of Wisconsin’s active primary care physicians. Such groups have repeatedly been shown to provide better care at lower cost.12 Thus, they are increasingly recognized as a logical population in which to examine care delivery, and are also likely to serve as a basis for development of accountable care organizations. Our study of the groups in the collaborative may thus shed light on how similar multispecialty physician groups might respond to the reporting initiatives intrinsic in accountable care.
Study Data And Methods
Sample
We invited twenty-one physician groups from the collaborative, representing 582 clinics, to participate in the study. Four groups did not participate, two because of competing responsibilities and two because they withdrew from the collaborative during the study. The participating groups had an average of 385 physicians—and an average of 156 primary care physicians—per group, for a total of 6,165 physicians. These groups are described further in Exhibit 1.
Exhibit 1.
Characteristics Of 17 Participating Physician Groups
| Characteristic | Total number of groups/mean number |
|---|---|
| Number of primary care clinics | |
| < 10 | 3 |
| 10-19 | 5 |
| 20-39 | 8 |
| 40-99 | 0 |
| 100 | 1 |
| Mean number of clinics (SD) | 24.1 (21.5) |
| Number of eligible diabetes patients, 2008 | |
| < 2,000 | 2 |
| 2,000-4,999 | 7 |
| 5,000-10,999 | 7 |
| 11,000-28,999 | 0 |
| 29,300 | 1 |
| Mean number of eligible diabetes patients (SD) | 7,369 (6,287) |
| Type of group | |
| Medical group | 13 |
| Integrated health care delivery system | 2 |
| Academic medical group practice | 2 |
| Primary owner | |
| Hospital, hospital system, or health care system | 13 |
| Physicians in group | 2 |
| Other | 2 |
SOURCE Authors’ physician group survey.
NOTE SD is standard deviation.
Of the seventeen participating groups, six did not return separate clinic surveys. Three of these six managed quality improvement centrally and returned a single survey for all of their clinics. The other three completed surveys representing multiple subgroups of clinics that had the same quality improvement experience. The other eleven groups returned separate surveys for each clinic.
We received individual responses for 178 of the 409 participating clinics and grouped responses for 231 clinics. Consequently, we had clinic-level information on quality improvement activities for 409 (70 percent) of the original 582 clinics and 91 percent of the clinics from the seventeen participating physician groups. In order to investigate annual variation, we created a data set of 2,454 clinic years.
Data
We conducted two separate surveys, one for each physician group as a whole and one for individual clinics within the group. Both the physician group and clinic surveys asked questions on quality improvement interventions as well as background questions about the groups’ and clinics’ organization and infrastructure.
Based on a review of effective improvement strategies,13-17 the clinic and physician group survey asked closed-ended questions about fifty-five quality improvement initiatives that might have been implemented at clinics or, in some instances group-wide. Twenty-two questions were related to improvement in diabetes care. The questions were organized around the Chronic Care Model, a widely adopted model that summarizes the basic elements for improving care in health systems.18 They focused on diabetes, hypertension, and cancer screening, areas in which the collaborative had publicly reported data for multiple years.
Measures
Our primary outcome measure was the number of interventions implemented during each year from 2003 to 2008, from the total of twenty-two possible diabetes improvement interventions. Eleven of the interventions—for example, the use of reminders to patients about existing upcoming appointments or to schedule follow-up tests —could be implemented by a physician group without clinic involvement. Our measure counted an intervention as implemented for clinics if it was implemented by either the clinic or the group.
We categorized clinic-years into the following groups: no interventions implemented; one intervention implemented; and two or more interventions implemented. We also conducted analyses in which we compared clinic-years with no interventions and those with any interventions.
We subcategorized the twenty-two diabetes improvement interventions into those directed at the patient (nine interventions), such as telephone appointment reminders; the provider (three interventions), such as provider education on diabetes; or the system (ten interventions), such as a registry of diabetes patients (see Supplemental Tables 1 and 2 in the online Appendix).19 We counted the number of interventions implemented during each year from 2003 to 2008 in each subcategory (patient-, provider-, or system-directed) and grouped them as above into categories (none, one, two or more interventions in that clinic-year).
The primary explanatory variable indicated whether, for each clinic-year, the physician group formally adopted a focus on one or more diabetes metrics in response to the collaborative’s reporting; adopted a diabetes focus, but not in response to that reporting; or did not prioritize any diabetes metrics. This was based on the physician group survey item: “Thinking about the years from 2003 through 2008, did your physician group formally choose to give priority to any of the quality improvement measures listed below?” The list included the following six diabetes metrics: hemoglobin A1c testing and control; low-density lipoprotein cholesterol testing and control; kidney function monitoring; and blood pressure control. Groups were asked to identify any year when a metric was chosen to be a quality improvement focus and then to indicate if this focus was chosen in response to the collaborative’s reporting. This item was only included in the physician group survey. Additional variables included in the models were time (in calendar years) and the number of diabetes interventions implemented prior to 2003.
Analysis
We used binomial and multinomial logistic regression to estimate the relationship between implementing diabetes interventions and adopting a formal focus on diabetes performance metrics; calendar years since 2003; and the number of diabetes interventions implemented prior to 2003. We calculated adjusted odds ratios and 95 percent confidence intervals, using robust variance estimates to account for clustering. We used the statistical analysis software Stata, version 11.2.
Limitations
Our study had several possible limitations. Our results represented the experience of only 409 clinics from a single voluntary reporting collaborative. However, the Wisconsin Collaborative for Healthcare Quality was one of the first and remains one of the largest collaborative organizations to report all-patient, all-payer performance for physician groups. Thus, it is of broad interest as a model of reporting based on physician groups.
In addition, our organizational survey was retrospective, and there might have been errors in recall or lack of knowledge about group-wide initiatives. As a result, we collected information from both groups and clinics, and we counted an intervention if it was implemented at either level.
It is theoretically possible that survey responses might have indicated what the respondents believed we hoped to hear. However, our contact with survey respondents was minimal, since the survey was mailed to them. Respondents were unaware of the study hypothesis that a focus on collaborative metrics was related to the implementation of specific interventions.
The front page of the clinic survey stated, “The purpose of the study is to identify the quality improvement initiatives undertaken at your physician group to address specific patient care and administrative practices, and when they were implemented.” The item about a possible focus on collaborative metrics was included only in the physician group survey, not in the clinic survey.
Finally, although the study allowed us to examine improvement at the clinic level, several physician groups managed implementation of improvement centrally, limiting variation among clinics. To account for this, we used robust estimates of the variance in our models.
Study Results
Group And Clinic Characteristics
Most of the seventeen physician groups were owned by a hospital, hospital system, or health care system (Exhibit 1). However, the groups varied greatly in size.
The clinics differed with respect to several factors that might affect diabetes care such as the use of an electronic health record, receipt of payments linked to the quality of care, and the socioeconomic background of patients (Exhibit 2). Clinics averaged 7.4 primary care physicians per clinic and were likely to be using an electronic health record at least partially, with implementation often occurring before the study period began. Although productivity or billing was the major factor in physician compensation, measures of clinical care and quality bonuses or incentive payments from insurance plans were also reported. The clinics’ patients were largely white and speakers of English, with access to private insurance or Medicare.
Exhibit 2.
Characteristics Of 409 Participating Clinics
| Characteristic | Percenta |
|---|---|
| EHR implementation | |
| Full | 58 |
| Partialb | 40 |
| None | 2 |
| Year clinic began using EHR system (n = 360) | |
| Before 2003 | 35 |
| 2003-05 | 23 |
| 2006-08 | 36 |
| After 2008 | 6 |
| Physicians reimbursed for group patient visits | 39 |
| Determinants of physician compensation | |
| Major factors | |
| Productivity or billing | 95 |
| Quality bonus/incentives from insurance plans | 1 |
| Measures of clinical care | 18 |
| Minor factors | |
| Productivity or billing | 3 |
| Quality bonus/incentives from insurance plans | 27 |
| Measures of clinical care | 47 |
| Percent of patients: | |
| Who are African American | |
| < 25 | 59 |
| ≥25 | 2 |
| Don’t know/missing data | 39 |
| Whose primary language is not English | |
| <25 | 75 |
| ≥25 | 1 |
| Don’t know/missing data | 24 |
| Who have Medicaid | |
| <25 | 71 |
| ≥25 | 12 |
| Don’t know/missing data | 17 |
| Who have Medicare | |
| <25 | 27 |
| ≥25 | 59 |
| Don’t know/missing data | 14 |
SOURCE Authors’ clinic survey.
NOTE EHR is electronic health record.
Percents may not sum to 100 due to rounding.
Patient records are partly electronic and partly on paper.
Choosing To Focus On Diabetes Metrics
For at least one year in the study period, sixteen of the seventeen groups adopted a formal focus on one or more diabetes, hypertension, or cancer screening measures publicly reported by the collaborative. Fifteen of the seventeen groups adopted a formal focus on one or more diabetes measures. This adoption was particularly common after 2004, the first year of formal reporting.
Twelve groups gave priority to at least one of the collaborative’s diabetes quality improvement metrics in response to the collaborative’s reporting. Nine groups indicated that these priorities were always or nearly always in response to that reporting. The number of groups formally focusing on collaborative metrics rose over time. Although only six groups prioritized one or more metrics in 2003, twelve groups reported doing so in 2008 (Exhibit 3).
Exhibit 3. Physician Group Focus On Diabetes Metrics, By Year.
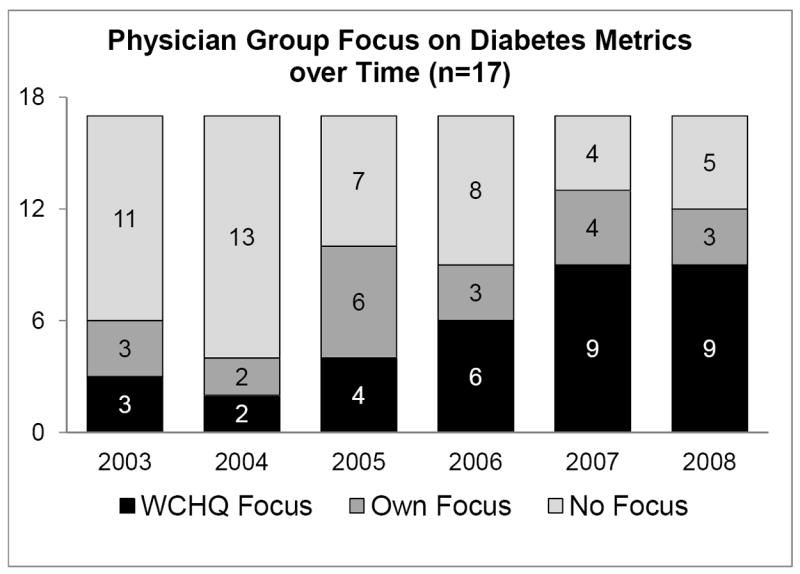
SOURCE Authors’ physician group survey.
NOTE WCHQ is Wisconsin Collaborative for Healthcare Quality.
Implementing Diabetes Quality Improvement Interventions
Before 2003 there was substantial variation in the extent and types of specific diabetes interventions implemented either by groups or individual clinics. However, more than 75 percent of clinics had implemented at least one of the twenty-two interventions (see Supplemental Table 1 in the Appendix).19
Of the patient-directed interventions, patient education was the most widely implemented, particularly one-on-one education (70%). Provider education was the most widely implemented provider-directed intervention (40%), followed by providers receiving data on the quality of their care for patients with diabetes (35%). The most commonly implemented system-directed interventions prior to 2003 were adoption of diabetes care guidelines (37%) and maintenance of a diabetes patient registry (36%).
Implementation of diabetes quality improvement initiatives increased substantially from 2003 to 2008, with several notable patterns of change (see Supplemental Table 2 in the Appendix).19 By 2008 nearly half of the clinics in the study had implemented eleven or more interventions (mean 8.7; standard deviation 4.5).
As of 2005 all but six percent of the clinics in the study had implemented at least one of the diabetes interventions. Of the patient-directed interventions, the use of phone and mail patient reminders about existing upcoming appointments or to schedule follow-up tests grew steadily. Of the provider-directed interventions, there was increased use of guideline-based reminders for providers at appointments about diabetes services that their patients should receive (such as a pop-up within an electronic health record or a reminder on the front of the chart). The use of several system-directed interventions also grew markedly, including the adoption of diabetes care guidelines, patient registries, predetermined diabetes orders or protocols for diabetes care, and the addition of a specialty-trained physician, such as an endocrinologist, to the care team.
Factors Related To Implementing The Interventions
Clinics from groups that focused on diabetes metrics, whether or not in response to the collaborative’s reporting, were more likely to implement at least one diabetes intervention in a particular year than clinics that did not focus on diabetes metrics (Exhibit 4). Clinics from groups responding to the collaborative’s reporting in that year by focusing on diabetes metrics were equally likely to implement patient-, provider-, or system-directed interventions (compared to clinics not focused on diabetes metrics). However, clinics from groups not responding to the collaborative’s reporting but still focusing on diabetes metrics were more likely to implement patient- and system-directed interventions, but less likely to implement provider-directed interventions.
Exhibit 4.
Factors Related To A Clinic’s Implementation Of Any Type Of Diabetes Intervention Per Year
| Factor | Type of diabetes intervention
|
|||||||
|---|---|---|---|---|---|---|---|---|
| Any type | Patient-directed | Provider-directed | System-directed | |||||
| OR | 95% CI | OR | 95% CI | OR | 95% CI | OR | 95% CI | |
| No formal focus on diabetes metrics (reference) | 1.00 | —a | 1.00 | —a | 1.00 | —a | 1.00 | —a |
| Formal focus in response to the collaborative | 1.30 | (1.06, 1.60) | 1.60 | (1.27, 2.02) | 2.11 | (1.53, 2.92) | 1.33 | (1.02, 1.74) |
| Formal focus, not in response to the collaborative | 1.27 | (1.00, 1.60) | 1.65 | (1.23, 2.2) | 0.62 | (0.38, 0.99) | 2.44 | (1.87, 3.18) |
| Time since 2003 (in years) | 1.13 | (1.07, 1.19) | 1.29 | (1.21, 1.36) | 1.25 | (1.15, 1.37) | 1.13 | (1.05, 1.21) |
| Number of diabetes interventions before 2003 | 0.98 | (0.96, 1.00) | 1.03 | (1.01, 1.06) | 1.08 | (1.05, 1.12) | 0.97 | (0.95, 0.99) |
SOURCE Authors’ physician group and clinic surveys.
NOTES An odds ratio (OR) greater than 1 suggests that the factor is associated with an increased likelihood of diabetes interventions. An odds ratio is considered significant if the confidence interval (CI) does not overlap with 1.
Not applicable.
Overall, the likelihood of a clinic’s implementing any diabetes intervention was greater in later years, irrespective of the type of intervention (patient-, provider-, or system-directed). As the number of interventions implemented in a clinic before 2003 increased, so did the likelihood of implementing patient- or provider-directed interventions after that date, although the likelihood of implementing a system-directed intervention declined.
In addition, clinics differed substantially according to the number of diabetes interventions that were implemented (Exhibit 5). Clinics focusing on diabetes metrics in response to collaborative reporting were more likely to implement single and multiple interventions in any year, compared to clinics that had no focus on diabetes metrics.
Exhibit 5.
Factors Related To A Clinic’s Implementation Of One Or More Diabetes Interventions Per Year
| Factor | OR | 95% CI |
|---|---|---|
| Implemented 1 intervention in the yeara | ||
| No formal focus on diabetes metrics (reference) | 1.00 | —b |
| Formal focus in response to the collaborative | 1.28 | (1.00, 1.64) |
| Formal focus, not in response to the collaborative | 0.76 | (0.56, 1.04) |
| Time since 2003 (in years) | 0.98 | (0.92, 1.05) |
| Number of diabetes interventions before 2003 | 0.95 | (0.93, 0.98) |
| Implemented 2 or more interventions in the yeara | ||
| No formal focus on diabetes metrics (reference) | 1.00 | —b |
| Formal focus in response to the collaborative | 1.49 | (1.09, 2.03) |
| Formal focus, not in response to the collaborative | 3.03 | (2.14, 4.28) |
| Time since 2003 (in years) | 1.53 | (1.42, 1.65) |
| Number of diabetes interventions before 2003 | 1.05 | (1.02, 1.08) |
SOURCE Authors’ physician group and clinic surveys.
NOTES An odds ratio (OR) greater than one suggests that the factor is associated with an increased likelihood of one or more diabetes interventions. An odds ratio is considered significant if the confidence interval (CI) does not overlap with 1.
Versus implemented no diabetes intervention in the year.
Not applicable.
Interestingly, this conclusion differed depending on whether the clinics had prior experience with diabetes improvement initiatives (data not shown). Using a test for significance (p < 0.0001), we found that among the clinics that had not implemented any interventions before 2003, those focusing on diabetes metrics in response to the collaborative’s reporting were more likely to implement single interventions compared to clinics with no focus on diabetes metrics (odds ratio: 1.79; 95% confidence interval: 1.14, 2.81). In contrast, among clinics that had implemented interventions before 2003, those focusing on diabetes metrics in response to the collaborative’s reporting were more likely to implement multiple interventions when compared to clinics with no focus on diabetes metrics (odds ratio: 1.69; 95% confidence interval: 1.21, 2.35).
Clinics focusing on diabetes metrics but not doing so in response to the collaborative’s reporting were more likely to implement multiple interventions in any year but not more likely to implement single interventions, compared to clinics that did not focus on diabetes metrics. Overall, in more recent calendar years, clinics were more likely than in previous years to implement multiple diabetes interventions, but not single interventions. The more interventions a clinic had implemented before 2003, the less likely it was to implement a single intervention and the more likely it was to implement multiple interventions in subsequent years.
Discussion
Despite rapidly increasing reliance on the public reporting of quality measures, there is little evidence about the relationship between quality measurement and quality improvement, particularly in the ambulatory care setting.3 We found that clinics in groups that focused on diabetes metrics in response to reporting by the collaborative were more likely to implement single and multiple diabetes improvement interventions of all types (patient-, provider-, or system-directed) during any year, compared to clinics that had no focus on diabetes metrics. However, the clinics without experience in diabetes improvement were more likely to implement single interventions, whereas the clinics with experience were more likely to implement multiple interventions.
In contrast, clinics in groups that focused on diabetes metrics but not in response to the collaborative’s reporting were more likely to implement multiple interventions in a year—particularly patient- and system-directed interventions—than they were to implement a single intervention. Overall, there was also a trend toward increased implementation of multiple interventions in all of the clinics in more recent years.
We asked quality directors from four physician groups that participated in the study to comment on why clinics chose to implement single versus multiple interventions in a given year. We discovered that clinics implementing single interventions tended to be in the early stages of quality improvement to improve diabetes care. One quality director commented that, with the group’s participation in the collaborative, its physicians were seeing standard comparative reports on their diabetes quality metrics for the first time. These reports motivated the physicians to “do something,” the director said, but “they just didn’t have the bandwidth to do more.”
Another director noted that several clinics implementing single interventions were “naïve…. They just hoped that they could make a small effort and change the metrics.”
Clinics that implemented multiple interventions sometimes did so in response to the collaborative’s reporting, but often they were participating in large or externally sponsored projects “instigated and led by [their] health system,” one of the directors told us. In one case, clinics had implemented a single physician-directed intervention as a “first step,” but the quality director of that group noted that “we needed broader organizational change to sustain the improvement.” Examples of these externally-sponsored projects included the National Committee for Quality Assurance’s medical home certification initiative, its diabetes recognition program, and the Association of American Medical Colleges’ national chronic care collaborative project.
Public reporting of quality has the potential to change the culture and behavior of an organization in ways that increase its engagement with performance improvement activities.20 However, literature on organizational change suggests that wholesale change is problematic and probably inappropriate, and that limits are set on this change by local systems.21
The fact that clinics with no prior experience in diabetes improvement were more likely to implement single interventions than multiple ones in response to the collaborative’s reporting supports the idea that public reporting may affect quality improvement through incremental organizational change. It may bring organizations off the sidelines to engage in an initial or early-stage improvement activity.
In contrast, organizations that focus on improvement but do not view themselves as responding to public reporting may have already developed an organizational culture in which improvement activities are seen as fully integrated into the fabric of the organization. The existence of such a culture facilitates the implementation of multiple improvement initiatives and permits participation in large, externally sponsored projects.
There is increased interest and activity at all levels in the public reporting of quality in primary care.22 Performance reporting requires substantial time and resources from primary clinicians,23,24 which makes it critical to begin understanding the value of these metrics in improving the quality of care.
Our results suggest that public reporting, along with participation in large or externally sponsored projects to improve quality, increased implementation of diabetes improvement interventions in outpatient clinics. Clinics were also more likely to implement interventions in more recent years compared to previous years. A focus on publicly reported metrics increased the likelihood of implementing a single intervention that might represent an initial or early step in quality improvement, as well as increasing the likelihood of multiple simultaneous interventions by clinics with more experience.
Future research should examine whether and how interventions driven by public reporting affect performance. Ultimately, the results of this study support the development of accountability metrics that meet the goal of “measurement for improvement.”3 (p. 688) Specifically, our findings support the development of accountability metrics that recognize incremental improvements in the quality of care, rewarding both early and ongoing improvement activities.
Supplementary Material
Acknowledgments
Disclosure Support for this project was provided by the Commonwealth Foundation (Grant No. 1089890). Additional support was provided by the Health Innovation Program and the Community-Academic Partnerships core of the University of Wisconsin Institute for Clinical and Translational Research, through Grant No. 1 UL1 RR025011 from the Clinical and Translational Science Award program of the National Center for Research Resources, National Institutes of Health. Additional funding for the project was provided by the University of Wisconsin School of Medicine and Public Health through the Wisconsin Partnership Program.
Notes
- 1.Fung CH, Lim YW, Mattke S, Damberg C, Shekelle PG. Systematic review: the evidence that publishing patient care performance data improves quality of care. Ann Intern Med. 2008;148(2):111–23. doi: 10.7326/0003-4819-148-2-200801150-00006. [DOI] [PubMed] [Google Scholar]
- 2.Damberg CL, Shortell SM, Raube K, Gillies RR, Rittenhouse D, McCurdy RK, et al. Relationship between quality improvement processes and clinical performance. Am J Manag Care. 2010;16(8):601–6. [PubMed] [Google Scholar]
- 3.Chassin MR, Loeb JM, Schmaltz SP, Wachter RM. Accountability measures: using measurement to promote quality improvement. N Engl J Med. 2010;363(7):683–8. doi: 10.1056/NEJMsb1002320. [DOI] [PubMed] [Google Scholar]
- 4.Colmers JM. Public reporting and transparency. New York (NY): Commonwealth Fund; 2007. [Google Scholar]
- 5.Marshall MN, Shekelle PG, Davies HT, Smith PC. Public reporting on quality in the United States and the United Kingdom. Health Aff (Millwood) 2003;22(3):134–48. doi: 10.1377/hlthaff.22.3.134. [DOI] [PubMed] [Google Scholar]
- 6.Leas BF, Berman B, Kash KM, Crawford AG, Toner RW, Goldfarb NI, et al. Quality measurement in diabetes care. Popul Health Manag. 2009;12(5):265–71. doi: 10.1089/pop.2009.0049. [DOI] [PubMed] [Google Scholar]
- 7.Centers for Disease Control and Prevention. National diabetes fact sheet: national estimates and general information on diabetes and prediabetes in the United States, 2011. Atlanta (GA): CDC; 2011. [Google Scholar]
- 8.Wyne K. Information technology for the treatment of diabetes: improving outcomes and controlling costs. J Manag Care Pharm. 2008;14(2):S12–S7. [PubMed] [Google Scholar]
- 9.Bu D, Hook JM, Pan E, Cusack CM, Walker J, Bates DW, et al. Benefits of information technology-enabled diabetes management. Diabetes Care. 2007;30(5):1137–42. doi: 10.2337/dc06-2101. [DOI] [PubMed] [Google Scholar]
- 10.Pogach L, Aron DC. Sudden acceleration of diabetes quality measures. JAMA. 2011;305(7):709–10. doi: 10.1001/jama.2011.153. [DOI] [PubMed] [Google Scholar]
- 11.Greer AL. Embracing accountability: physician leadership, public reporting, and teamwork in the Wisconsin Collaborative for Healthcare Quality. New York (NY): Commonwealth Fund; 2008. [Google Scholar]
- 12.Weeks WB, Gottlieb DJ, Nyweide DE, Sutherland JM, Bynum J, Casalino LP, et al. Higher health care quality and bigger savings found at large multispecialty medical groups. Health Aff (Millwood) 2010;29(5):991–7. doi: 10.1377/hlthaff.2009.0388. [DOI] [PubMed] [Google Scholar]
- 13.Shojania KG, McDonald KM, Wachter R, Owens D. Closing the quality gap: a critical analysis of quality improvement strategies: volume 1—series overview and methodology. Rockville (MD): Agency for Healthcare Research and Quality; 2004. [PubMed] [Google Scholar]
- 14.Shojania KG, Ranji SR, McDonald KM, Grimshaw JM, Sundaram V, Rushakoff RJ, et al. Effects of quality improvement strategies for type 2 diabetes on glycemic control: a meta-regression analysis. JAMA. 2006;296(4):427–40. doi: 10.1001/jama.296.4.427. [DOI] [PubMed] [Google Scholar]
- 15.Coleman K, Austin BT, Brach C, Wagner EH. Evidence on the Chronic Care Model in the new millennium. Health Aff (Millwood) 2009;28(1):75–85. doi: 10.1377/hlthaff.28.1.75. [DOI] [PMC free article] [PubMed] [Google Scholar]
- 16.Task Force on Community Preventive Services. Recommendations for client- and provider-directed interventions to increase breast, cervical, and colorectal cancer screening. Am J Prev Med. 2008;35(1):S21–S5. doi: 10.1016/j.amepre.2008.04.004. [DOI] [PubMed] [Google Scholar]
- 17.Klabunde CN, Lanier D, Breslau ES, Zapka JG, Fletcher RH, Ransohoff DF, et al. Improving colorectal cancer screening in primary care practice: innovative strategies and future directions. J Gen Intern Med. 2007;22(8):1195–205. doi: 10.1007/s11606-007-0231-3. [DOI] [PMC free article] [PubMed] [Google Scholar]
- 18.Wagner EH, Davis C, Schaefer J, Von Korff M, Austin B. A survey of leading chronic disease management programs: are they consistent with the literature? J Nurs Care Qual. 2002;16(2):67–80. [PubMed] [Google Scholar]
- 19.To access the Appendix, click on the Appendix link in the box to the right of the article online.
- 20.Marshall MN, Romano PS, Davies HTO. How do we maximize the impact of the public reporting of quality of care? Int J Qual Health Care. 2004;16:I57–63. doi: 10.1093/intqhc/mzh013. [DOI] [PubMed] [Google Scholar]
- 21.Davies H, Nutley S, Mannion R. Organisational culture and quality of health care. Qual Health Care. 2000;9(2):111–9. doi: 10.1136/qhc.9.2.111. [DOI] [PMC free article] [PubMed] [Google Scholar]
- 22.Lansky D. Improving quality through public disclosure of performance information. Health Aff (Millwood) 2002;21(4):52–62. doi: 10.1377/hlthaff.21.4.52. [DOI] [PubMed] [Google Scholar]
- 23.Halladay JR, Stearns SC, Wroth T, Spragens L, Hofstetter S, Zimmerman S, et al. Cost to primary care practices of responding to payer requests for quality and performance data. Ann Fam Med. 2009;7(6):495–503. doi: 10.1370/afm.1050. [DOI] [PMC free article] [PubMed] [Google Scholar]
- 24.Proceedings of the Agency for Healthcare Research and Quality Conference on Health Care Data Collection and Reporting 2006 Nov 8-9. Chicago, IL: Foundation of Research and Education of the American Health Information Management Association, Medical Group Management Association Center for Research. Collecting and reporting data for performance measurement: moving toward alignment. Available at: http://portal.ahrq.gov/portal/server.pt/gateway/PTARGS_0_227079_0_0_18/AHRQ_DataReport_final.pdf. [Google Scholar]
Associated Data
This section collects any data citations, data availability statements, or supplementary materials included in this article.