

Abstract
Multidrug and toxin extrusion 2 (MATE2-K (SLC47A2)), a polyspecific organic cation exporter, facilitates the renal elimination of the antidiabetes drug metformin. In this study, we characterized genetic variants of MATE2-K, determined their association with metformin response, and elucidated their impact by means of a comparative protein structure model. Four nonsynonymous variants and four variants in the MATE2-K basal promoter region were identified from ethnically diverse populations. Two nonsynonymous variants—c.485C>T and c.1177G>A—were shown to be associated with significantly lower metformin uptake and reduction in protein expression levels. MATE2-K basal promoter haplotypes containing the most common variant, g.−130G>A (>26% allele frequency), were associated with a significant increase in luciferase activities and reduced binding to the transcriptional repressor myeloid zinc finger 1 (MZF-1). Patients with diabetes who were homozygous for g.−130A had a significantly poorer response to metformin treatment, assessed as relative change in glycated hemoglobin (HbA1c) (−0.027 (−0.076, 0.033)), as compared with carriers of the reference allele, g.−130G (−0.15 (−0.17, −0.13)) (P = 0.002). Our study showed that MATE2-K plays a role in the antidiabetes response to metformin.
Introduction
The kidneys play an important role in the elimination of many endogenous compounds and drugs from the body.1 Elimination processes in the kidney are driven, in part, by membrane transporters expressed on the basolateral and apical membranes of renal epithelial cells, working in sequential steps to mediate tubular secretion. In 2005, Moriyama et al. identified and functionally characterized the human H+/organic cation antiporter multidrug and toxin extrusion 1 (MATE1),2 and in 2006, Inui et al. characterized a paralog, MATE2.3 MATE1 is an H+/organic cation antiporter on the apical membrane of the kidney tubules and on bile canaliculi. It uses a countergradient of protons to drive the transmembrane flux of organic cations into urine and bile. Various drugs, including metformin, as well as endogenous substances such as guanidine, have been shown to be substrates of MATE1.4 The finding that the renal clearance of metformin and cephalexin is lower in Mate1 knockout mice suggested the importance of MATE1 in the renal tubular secretion of drugs in vivo.5,6 Genetic variants in the basal promoter and exon regions of MATE1 have been previously identified and characterized by our group7,8 as well as by others.9,10 Importantly, some clinical studies have found an association between MATE1 genetic variants and response to metformin in patients with diabetes.11,12
Much less is known about MATE2. Two isoforms of MATE2 have been identified, one of which, MATE2-K, has been characterized as a membrane transporter in the kidney.3 MATE2-K is expressed specifically in the kidney and, like MATE1, it appears to transport an array of structurally diverse compounds, including many cationic drugs and endogenous compounds.3 Recently, Komatsu et al.13 characterized isoform 1 of MATE2 (NP_690872). Their study showed that both human MATE2 (isoform 1) and MATE2-K (isoform 2) (i) operate in the kidney as electroneutral H+/organic cation exchangers; (ii) express and localize in the kidney, with MATE2-K being slightly more abundant than MATE2; (iii) transport tetraethyl ammonium (TEA); and (iv) have similar inhibitor specificities.13 Two nonsynonymous single-nucleotide polymorphisms (SNPs), Lys64Asn and Gly211Val, with allele frequencies of 0.6 and 1.7% respectively, identified in 89 healthy Japanese subjects, exhibit decreased transport activities.9 In fact, Gly211Val results in complete loss of transport activity due to loss of protein expression on the cell surface.
In the current study, we elucidated genetic variations in the basal promoter and exonic regions of MATE2-K, identified by sequencing 272 DNA samples from four major US ethnic groups. We discovered several genetic variants with significant functional effects (Pro162Leu (c.485C>T); Gly393Arg (c.1177G>A) and g.−130G>A). Consistent with its enhanced basal promoter activity, g.−130G>A was associated with reduced clinical response to metformin in US diabetes patients who were of African or European origin. Pharmacogenomic studies of metformin disposition and response have focused on genetic variants in candidate transporters for metformin such as OCT1, OCT2, OCT3, and MATE112,14–18 and in candidate genes associated with metformin targets such as AMPK and PRKAG2.12 To our knowledge, this is the first study to examine the effect of variants in MATE2-K on response to metformin in ethnically diverse US populations. Our study suggests that MATE2-K plays an important role in the efficacy of metformin.
Results
Genetic polymorphisms and linkage disequilibrium analysis of the coding and basal promoter region of MATE2-K
We sequenced the coding and the basal promoter region of MATE2-K in 272 DNA samples from ethnically diverse US populations and identified genetic variants in these regions (Tables 1 and 2). Four nonsynonymous variants were identified, one of which, c.485C>T (Pro162Leu), was found to have an allele frequency >5% in African Americans. Four variants were identified in the basal promoter region. The variant g.−130G>A had the highest allele frequency in each of the four ethnic groups (Tables 1 and 2). Table 2 shows the frequencies of the common haplotypes in the MATE2-K basal promoter region. Haplotype 1 (H1), which consists of all the major alleles, had the highest frequency, followed by haplotype 2 (H2), containing g.−130G>A. Among the genetic variants described in Tables 1 and 2, only two intronic SNPs (rs9900497 and rs35263947) and one synonymous SNP (rs4924792) were in linkage disequilibrium (r2 >0.8) with the 5′-untranslated region (UTR) variant g.−130G>A in European, Asian, and Mexican Americans. In African Americans, the two intronic SNPs, rs9900497 and rs3526397, and the synonymous SNP rs4924792 were in poor linkage disequilibrium (r2 = 0.38, 0.41, and 0.17, respectively) with the 5′-UTR variant.
Table 1.
Genetic variants of MATE2-K identified in 272 DNA samples (68 from each of the four major ethnic groups)
| rs no. (dbSNP) or PMT ID |
Genomic position |
CDS position |
Nucleotide substitution |
Strand | Feature | Amino acid substitution |
Minor allele frequency | |||
|---|---|---|---|---|---|---|---|---|---|---|
| African Americans |
European Americans |
Asian Americans |
Mexican Americans |
|||||||
| Coding variants | ||||||||||
| PMT5599 | 19559039 | 207 | G>A | − | Exon | Ser69Ser | 0.000 | 0.000 | 0.037 | 0.000 |
| rs115261507 | 19557846 | 327 | C>T | − | Exon | Gly109Gly | 0.025 | 0.000 | 0.000 | 0.017 |
| rs4924792 | 19557828 | 345 | C>A | − | Exon | Gly115Gly | 0.458 | 0.306 | 0.492 | 0.364 |
| PMT5634 | 19556609 | 485 | C>T | − | Exon | Pro162Leu | 0.056 | 0.000 | 0.000 | 0.000 |
| PMT5640 | 19551676 | 702 | G>A | − | Exon | Lys234Lys | 0.000 | 0.008 | 0.000 | 0.000 |
| rs4925042 | 19549365 | 885 | C>T | − | Exon | Tyr295Tyr | 0.538 | 0.336 | 0.750 | 0.545 |
| rs34169093 | 19548024 | 969 | G>A | − | Exon | Ala323Ala | 0.200 | 0.023 | 0.000 | 0.038 |
| rs34399035 | 19525563 | 1177 | G>A | − | Exon | Gly393Arg | 0.000 | 0.009 | 0.000 | 0.008 |
| rs34416664 | 19525344 | 1320 | C>G | − | Exon | Ala440Ala | 0.000 | 0.009 | 0.000 | 0.008 |
| rs113679066 | 19522778 | 1514 | C>T | − | Exon | Thr505Ile | 0.007 | 0.000 | 0.000 | 0.000 |
| rs35526408 | 19522720 | 1572 | C>T | − | Exon | His524His | 0.000 | 0.000 | 0.000 | 0.007 |
| rs113234335 | 19522719 | 1573 | G>A | − | Exon | Ala525Thr | 0.007 | 0.000 | 0.000 | 0.000 |
| rs71369435 | 19522621 | 1671 | C>T | − | Exon | Leu557Leu | 0.000 | 0.007 | 0.000 | 0.000 |
| Basal promoter variantsa | ||||||||||
| PMT5598 | 19560626 | −166 | C>G | + | 5′-UTR | None | 0.015 | 0.000 | 0.000 | 0.000 |
| rs12943590 | 19560590 | −130 | G>A | + | 5′-UTR | None | 0.277 | 0.262 | 0.485 | 0.341 |
| PMT5596 | 19560506 | −46 | G>A | + | 5′-UTR | None | 0.008 | 0.000 | 0.000 | 0.000 |
| PMT5595 | 19560505 | −45 | C>T | + | 5′-UTR | None | 0.000 | 0.000 | 0.007 | 0.000 |
| Noncoding variants | ||||||||||
| rs9900497 | 19557985 | IVS2 (−107) | C>A | − | Intron | None | 0.475 | 0.290 | 0.531 | 0.364 |
| rs35263947 | 19550696 | IVS7 (−30) | G>A | − | Intron | None | 0.123 | 0.285 | 0.493 | 0.353 |
| rs12942065 | 19550539 | IVS9 (+14) | G>C | − | Intron | None | 0.731 | 0.646 | 0.956 | 0.691 |
| rs58045813 | 19549240 | IVS10 (+101) | C>T | − | Intron | None | 0.062 | 0.000 | 0.000 | 0.000 |
| rs16960349 | 19546969 | IVS12 (+28) | C>G | − | Intron | None | 0.055 | 0.000 | 0.000 | 0.000 |
| rs60425436 | 19523769 | IVS16 (+88) | T>C | − | Intron | None | 0.031 | 0.000 | 0.000 | 0.000 |
Nucleotide location of the variant is based on the translational start site according to the MATE2-K mRNA sequence NM_001099646.
CDS, coding sequence; PMT, pharmacogenomics of membrane transport; SNP, single-nucleotide polymorphism; UTR, untranslated region.
The number for the basal promoter variants (−250 to +50 bp of the transcription start site) refers to the nucleotide position upstream from the MATE2-K start codon.
Table 2.
Frequencies of the common haplotypes in the MATE2-K basal promoter region
| Haplotype number |
g.−166C>G | g.−130G>A | g.−46G>A | g.−45C>T | Minor allele frequency | |||
|---|---|---|---|---|---|---|---|---|
| African Americans | European Americans | Asian Americans | Mexican Americans | |||||
| H1 | C | G | G | C | 0.708 | 0.738 | 0.507 | 0.659 |
| H2 | C | A | G | C | 0.269 | 0.262 | 0.485 | 0.341 |
| H3 | G | G | G | C | 0.016 | 0.000 | 0.000 | 0.000 |
| H4 | C | G | G | T | 0.000 | 0.000 | 0.007 | 0.000 |
| H5 | C | A | A | C | 0.008 | 0.000 | 0.000 | 0.000 |
The minor alleles are shown in bold with underlines. Data were obtained from DNA samples from 272 unrelated individuals: 68 from each of four major ethnic groups. Position of the variant is based on the translational start site.
Functional studies of MATE2-K variants in the coding region
Through uptake studies in human embryonic kidney (HEK)-293 cells transfected with MATE2-K reference or its variants, we investigated whether nonsynonymous variants of MATE2-K affect its transport activity. After the cells were incubated with various compounds such as TEA, metformin, amiloride, and trospium for 5 min, the uptake of each was determined. TEA and metformin have been previously identified as MATE2-K substrates,4 whereas amiloride and trospium were tested as MATE2-K substrates for the first time in this study. The uptake levels of TEA and metformin in MATE2-K-reference HEK cells were 5.1 ± 1.0 and 4.4 ± 0.5 times greater, respectively, than those of empty vector−transfected HEK-293 cells (Figure 1a). The uptake levels of TEA and metformin were significantly reduced in HEK-293 cells expressing two MATE2-K variants, c.485C>T and c.1177G>A (three- to fivefold reduction in uptake as compared to the reference). In addition, the uptake of amiloride and trospium in MATE2-K-reference HEK cells were 2.8 ± 0.1 and 11.4 ± 1.0 times greater, respectively, than those of empty vector−transfected HEK-293 cells, suggesting that both compounds are substrates of MATE2-K. The rates of transport of metformin, TEA, amiloride, and trospium by the variants c.1514C>T and c.1573G>A were comparable to those of the reference MATE2-K (Figure 1a).
Figure 1.

Effect of MATE2-K nonsynonymous variants on (a) transport of four compounds by HEK-293 cells expressing MATE2-K reference and (b) protein levels of MATE2-K green fluorescent protein (GFP) chimeras. (a) Functional activities were measured 48 h after transfection of plasmids containing MATE2-K reference or its variants into HEK-293 cells. The cells were incubated with various substrates including tetraethyl ammonium (TEA) (5 µmol/l), metformin (10 µmol/l), amiloride (10 µmol/l), and trospium (10 µmol/l) for 5 min each, and the uptake of each drug was determined. The functional activity of each construct was compared with that of the empty vector (pcDNA5-FRT). The data shown represent mean values ± SE from triplicate wells in a representative experiment. *P < 0.05, +P < 0.01 vs. the reference. (b) MATE2-K protein levels were determined by immunoblotting with an antibody against GFP. Cells were harvested 48 h after transfection of HEK-293 cells with MATE2-K reference or its variants—pcDNA3.1 vectors tagged with GFP. Proteins were blotted with antibodies against GFP, β-actin, and neomycin phosphotransferase II. β-actin was used as an internal control and neomycin phosphotransferase II was used as a cis-transfection marker. Expression levels were compared with that of the reference.
Effect of genetic variants on expression levels of MATE2-K in HEK-293 cells
MATE2-K mRNA levels in HEK-293 cells harvested 30 h after transient transfection of the four nonsynonymous variants were comparable to the corresponding level in the reference cells (data not shown). We next assessed whether the nonsynonymous variants had any effect on MATE2-K protein expression levels. HEK-293 cells were transiently transfected with pcDNA3.1 plasmids containing the chimeras, green fluorescent protein (GFP)- MATE2-K reference and nonsynonymous variants (c.485C>T and c.1177G>A), or GFP (GFP vector only). We measured the GFP-tagged MATE2-K protein expression by means of immunoblotting, using an antibody against GFP. Consistent with their effect of reducing uptake, the MATE2-K variants c.1177G>A and c.485C>T resulted in expression levels that were lower by 31 and 66%, respectively, as compared with the reference cells (Figure 1b). The lower total protein levels of MATE2-K in the stable cell lines probably resulted in correspondingly lower levels on the plasma membrane; however, this was not determined.
Structure-based analysis of genetic variants of MATE2-K
The structure of MATE2-K was modeled on the basis of alignment with the X-ray structure of its recently crystallized homolog from Vibrio cholerae, NorM.19 The model includes the channel residues and 12 of the 13 predicted transmembrane helices. Most of the residues constituting the putative protonbinding site in NorM are conserved in MATE2-K, reflecting the functional similarity between MATE2-K and NorM (Supplementary Figure S2 online). We mapped onto the model the genetic variants discovered in our cohort as well as the variants reported in healthy Japanese volunteers.9 In total, four of the six nonsynonymous variants could be mapped onto the comparative model (Lys64Asn, Pro162Leu, Gly211Val, and Gly393Arg) (Figure 2a–d). The model provided a rationale for the negative effects of these four variants on MATE2-K function. Gly393 is located in the channel in relatively close proximity to the putative proton-binding site. Therefore, mutation of Gly393 to the positively charged arginine is likely to prevent MATE2-K interaction with cationic ligands, including protons. Pro162 and Gly211 are located in transmembrane helices 4 and 6, respectively. Mutations of these residues to leucine and valine, respectively, are likely to impact MATE2-K structures through (i) a decrease in the main chain’s flexibility (Gly) or rigidity (Pro), (ii) disruption of the helix–helix packing, and (iii) disruption of ligand transport, especially for Pro162, which is in close proximity to the channel. Lys64 is placed in the extracellular loop near the membrane-spanning residues; mutation to the uncharged asparagine residue can affect MATE2-K interaction with the membrane phospholipid head groups and other molecules as well as its posttranslational modifications.
Figure 2.
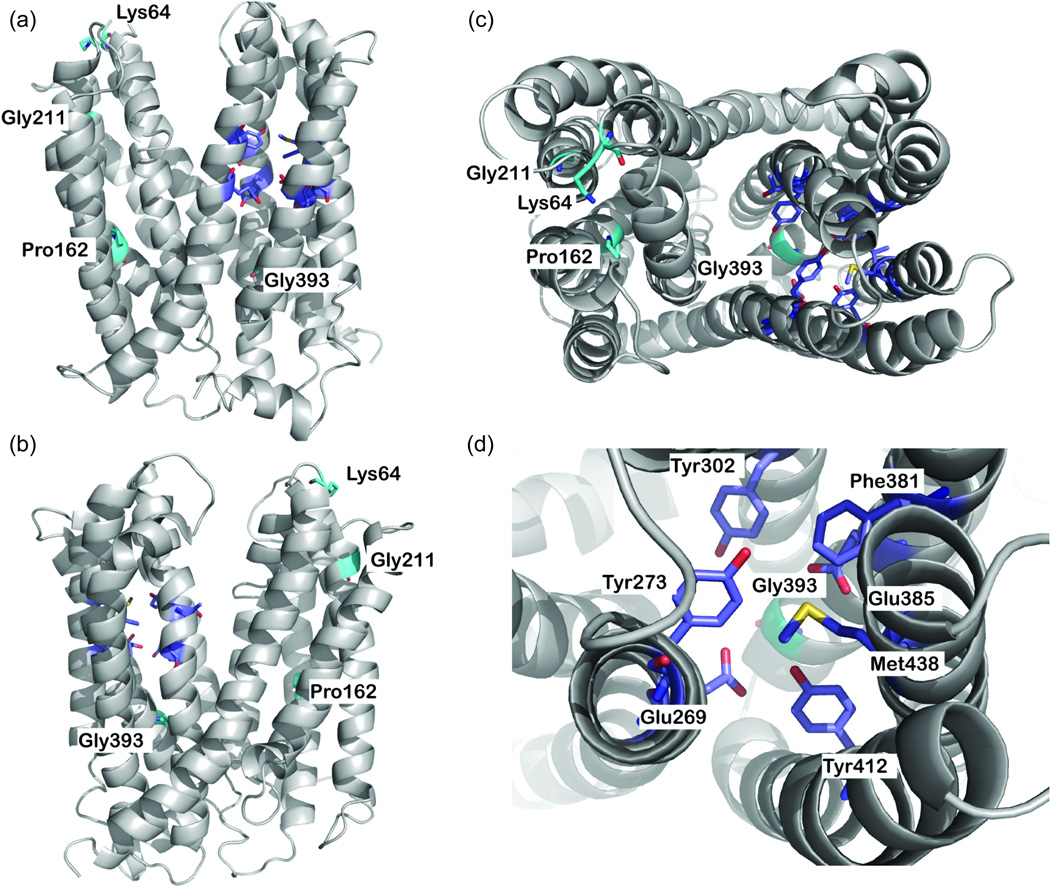
MATE2-K comparative model. (a,b) Side views and (c) top view of the predicted structure of MATE2-K. The backbone atoms of the model are depicted as a gray ribbon. Key residues are displayed as sticks; residues constituting the nonsynonymous variants are shown in cyan, and the putative proton binding site is shown in magenta. Oxygen, nitrogen, and hydrogen atoms are shown in red, blue, and white, respectively. (d) Top view of the putative proton binding site. In this model, two nonsynonymous variants, Pro162Leu (c.485C>T) and Gly393Arg (c.1177G>A), were discovered via Pharmacogenomics of Membrane Transporter (PMT) Projects (http://www.pharmacogenetics.ucsf.edu), and two nonsynonymous variants, Lys64Asn and Gly211Val, were previously reported by Japanese investigators.9 Also see Supplementary Figure S1 online for the putative secondary structure of MATE2-K showing the positions of four nonsynonymous variants and nine synonymous variants.
Basal promoter activity of MATE2-K variants
To characterize the effects of the basal promoter variants, we performed luciferase gene reporter assays using MATE2-KpGL4.11b. Of the four cell lines tested, the MATE2-K reference- HCT-116 cells showed the highest promoter activity (Figure 3a). HCT-116 cells were used in further reporter assays to examine the basal promoter activities of the variants (Figure 3b), whereas kidney cell lines (ACHN, HEK-293T, and LLC-PK1) were used to examine the basal promoter activities of the common haplotypes H1 (reference) and H2 (g.−130G>A) (Figure 3c, Table 2). The basal promoter activity levels of haplotypes 2 and 5, both of which contain the g.−130G>A variant, showed 60–65% higher reporter activity than the reference in HCT-116 and HEK-293T cells (Figure 3b,c).
Figure 3.

Reporter activities of MATE2-K reference basal promoter haplotype and variant haplotypes. Luciferase activities were measured 30 h after transfection with the reference plasmid in (a) four cell lines: ACHN (human kidney adenocarcinoma), HEK-293T (human embryonic kidney), HCT-116 (human colon carcinoma), and LLC-PK1 (porcine kidney epithelial); (b) the reference and variant plasmids in HCT-116 cell lines; and (c) the reference and g.−130G>A plasmids in ACHN, HEK-293T, and LLC-PK1. The reporter activity of each construct was compared with that of the empty vector (pGL4.11b(luc2)). The data shown represent mean values ± SD from triplicate wells in a representative experiment. *P < 0.05, +P < 0.01 vs. the reference.
Effect of the variant g.−130G>A on the binding affinity of MZF-1 within the MATE2-K basal promoter region
To determine the mechanism through which g.−130G>A enhances transcription rate, we used predictive algorithms to determine which of the transcription factors could bind to the MATE2-K, g.−130G>A 5′-UTR. The transcription factor myeloid zinc finger 1 (MZF-1) was identified using the Delta-Match query tool (David W. Williamson, personal communication). This query tool predicted that the g.−130G allele would bind with a higher affinity to MZF-1 than the g.−130A allele would. MZF-1 is known to regulate transcription during hematopoiesis, and it functions as an oncogene or tumor suppressor.20,21 We used electrophoretic mobility shift assays (EMSAs) to determine whether MZF-1 could bind to the 5′-UTR co ntaining the g.−130G>A site. Labeled oligonucleotides were incubated with nuclear protein extracts (25 µg) obtained from HCT-116 cells. There was a clear band when the MZF-1 probe was incubated with nuclear protein extract (lane 1, Figure 4a). The intensity of the band was reduced when a competition assay was performed using various concentrations of unlabeled MZF-1 consensus oligonucleotides (lanes 2 and 3, Figure 4a). These results suggest that MZF-1 is present in the complex. Both MATE2-K reference and variant probes formed DNA–protein complexes, but the intensity of the complex formed with the variant probe was lower by 13% as compared to the reference (lanes 4 and 7, Figure 4a). The intensities of the reference probe–protein complex bands were reduced with the competition assay using unlabeled MZF-1 consensus oligonucleotides, thereby indicating that these bands are complexes of DNA with MZF-1 (lanes 5 and 6, Figure 4a). A supershift assay was performed using an antibody against MZF-1 to demonstrate the specific binding of MZF-1 to this 5′-UTR of MATE2-K DNA (lane 8, Figure 4a). The addition of MZF-1 antibody resulted in the disappearance of the DNA–protein complex band (arrow), probably because the complex with the antibody shifted to a higher molecular weight. The supershifted band was not detectable with the labeled MZF-1 probe (lane 8, Figure 4a), probably because of the low intensity of the shifted bands. Other researchers have previously observed barely detectable bands in supershift assays.22,23
Figure 4.


Effect of myeloid zinc finger 1 (MZF-1) on the binding and activity of the MATE2-K 5′-UTR variant, g.−130G>A. (a) Electrophoretic mobility shift analysis of MZF-1, MATE2-K reference, and MATE2-K variant g.−130G>A oligonucleotides. Oligonucleotides (MZF-1: lanes 1–3 and 8; reference g.−130G: lanes 4–6; variant g.−130A: lane 7) were incubated with nuclear protein extracts (25 µg) obtained from HCT-116 (human colon carcinoma) cells. The arrow indicates the position of the DNA–protein complex. Competition reactions and supershift assay were performed using different folds (25 (lanes 2, 5) and 250 (lanes 3, 6)) of molar excess of unlabeled consensus MZF-1 oligonucleotides and antibody against MZF-1 (lane 8). (b) Luciferase activities were measured 30 h after the cotransfection of the reference or variant reporters and various amounts of MZF-1 plasmids into (i) HCT-116 and (ii) HEK-293T (human embryonic kidney) cells. The reporter activity of each construct was compared with that of the empty vector (pGL4.11b(luc2)). The data shown represent mean values ± SD from triplicate wells in a representative experiment. *P < 0.05, +P < 0.01, #P < 0.001 vs. the naive promoter activity.
Effect of MZF-1 on MATE2-K basal promoter activity
We examined the effect of MZF-1 on MATE2-K basal promoter activity by conducting a luciferase assay after overexpression of MZF-1 in HCT-116 and HEK-293T cells. Luciferase activity levels were measured 30 h after cotransfection of the MATE2-K reference or variant (g.−130G>A) reporter plasmids with increasing amounts of plasmids containing MZF-1. We observed that MZF-1 produced a dose-dependent repression of MATE2-K basal promoter activity, and that the repression was particularly strong in the presence of the reference g.−130G in both HCT-116 and HEK-293T cells (Figure 4b (i) and (ii)). Using publicly available microarray expression data, we observed high expression levels of MZF-1 and MATE2-K in kidney tissues as compared with kidney carcinoma cell lines (Supplementary Table S3 online).
Association between the MATE2-K 5′UTR variant and initial metformin response in type 2 diabetes mellitus patients
In a retrospective study, a total of 253 diabetes patients (189 selfreported Caucasians and 64 self-reported African Americans) met the study criteria and the quality-control standards for DNA and genotyping (Supplementary Figure S4 online). Table 3 shows the baseline characteristics of the patients with type 2 diabetes mellitus (T2DM) in whom metformin monotherapy was initiated, categorized by clinical site (Table 3 (i)) and ethnic group (Table 3 (ii)). Overall, there were no significant differences in the baseline characteristics of patients from the different clinical sites and ethnic groups. However, the body mass index of the patients from BioVU was significantly lower than that of patients from Marshfield Clinic and Kaiser South East (P < 0.01, Kruskal–Wallis test, followed by Dunn’s multiple comparison test). In addition, patients in Marshfield Clinic had significantly lower baseline glycated hemoglobin (HbA1c) levels than did patients in Kaiser South East and BioVU (P <0.01, Kruskal–Wallis test, followed by Dunn’s multiple comparison test). On average, the mean baseline HbA1c level was 8.04 ± 1.42% and decreased to 6.81 ± 0.89%. There was no statistically significant difference in the relative change in HbA1c level among the three cohorts (Kruskal–Wallis test, P = 0.09) or between the two ethnic groups (Mann–Whitney test, P = 0.56). The average time between baseline HbA1c measurement and the start of metformin therapy was 14 ± 23 days, whereas the average time between the start of metformin monotherapy and the first HbA1c measurement after the initiation of treatment was 160 ± 52 days. We evaluated the correlation between each of the following variables and relative change in HbA1c: age, body mass index, gender, treatment gap (time between start of treatment and HbA1c measurement), average metformin dose, and creatinine clearance. Overall, only average metformin daily dose had a significant correlation with relative change in HbA1c level (r = −0.0015 (95% confidence interval (CI): −0.00067, −0.0023); P = 0.00042).
Table 3.
Baseline characteristics of patients with type 2 diabetes on metformin monotherapy. The baseline characteristics are compared across (i) the three clinical sites and (ii) ethnicity
| (i) Clinical site | (ii) Ethnicity | Total | ||||
|---|---|---|---|---|---|---|
| Marshfield Clinic | Kaiser South East | BioVU | Caucasian | African American | ||
| Number | 105 | 73 | 75 | 189 | 64 | 253 |
| Male | 50 (47.6%) | 23 (31.5%) | 37 (49.3%) | 94 (49.7%) | 16 (25.0%) | 110 (43.5%) |
| Female | 55 (52.4%) | 50 (68.5%) | 38 (50.7%) | 95 (50.3%) | 48 (75.0%) | 143 (56.5%) |
| Caucasian | 105 | 20 | 64 | — | — | 189 (74.6%) |
| African American | 0 | 53 | 11 | — | — | 64 (25.4%) |
| Quantitative traits | ||||||
| Age (years) | 57 ± 13 | 59 ± 11 | 57 ± 13 | 57 ± 13 | 58 ± 12 | 57 ± 12 |
| BMI (kg/m2) | 37.5 ± 8.6 (35.7) | 38 ± 8.6 (36.1)a | 32.8 ± 6.0 (31.1)b | 36.0 ± 8.5 (34.2)c | 35.0 ± 6.0 (34.0)d | 35.9 ± 8.1 (34.2) |
| Baseline HbA1c (%) | 7.72 ± 1.26 (7.50) | 8.22 ± 1.39 (8.00) | 8.32 ± 1.60 (7.90) | 7.97 ± 1.42 (7.60) | 8.25 ± 1.45 (8.00) | 8.04 ± 1.43 (7.70) |
| Average metformin daily dose (mg) | 901 ± 328 | 915 ± 454 | 1013 ± 472 | 963 ± 392 | 865 ± 467 | 938 ± 414 |
| Creatinine clearancee (ml/min/1.73 m2) | 81.2 ± 21.1 | 82.0 ± 17.1 | NA | 80.2 ± 20.1f | 84.8 ± 17.7g | 81.6 ± 19.5 |
Data shown represent mean ± SD (median).
BMI, body mass index; GFR, glomerular filtration rate; HbA1c, glycated hemoglobin; NA, not available; Scr, serum creatinine.
Only 34 people with BMI information.
Only 74 people with BMI information.
Only 178 people with BMI information.
Only 35 people with BMI information.
The following equation was used to estimate creatinine clearance from serum creatinine levels: Scr.GFR (ml/min/1.73 m2) = 175 × (Scr)−1.154 × (Age)−0.203 × (0.742 if female) × (1.212 if African American).47 Weight was not required in this equation as the results are normalized to 1.73 m2 body surface area, which is an accepted average adult surface area.
Only 125 people with creatinine value.
Only 53 people with creatinine value.
A total of 253 samples were successfully genotyped for the MATE2-K g.−130G>A variant, with 96% concordance in all the samples selected for validation by sequencing. The minor allele frequency for g.−130G>A was 28% in Caucasians and 22% in African Americans. All variants were in Hardy–Weinberg equilibrium (P > 0.10).
We evaluated the relative change in HbA1c level for each genotype group in the (i) Marshfield Clinic alone (N = 105), (ii) the combined Caucasian group (N = 189), and (iii) the combined Caucasian and African-American group (N = 253) (Table 4). The results in Table 4 (i and ii) show that patients who were homozygous for the variant allele (g.130A/A) had an attenuated response to metformin. There were significant differences in relative change in HbA1c between the homozygous variant group (AA) and the homozygous and heterozygous reference groups (GG and GA) in the Marshfield Clinic cohort and in the combined Caucasian group (all Mann–Whiney nonparametric P values <0.01; Table 4 (i and ii)). The association was significant, but weaker, in the combined Caucasian and African-American group (Table 4 (iii)), whereas it was not statistically significant in the Kaiser South East, BioVU, or African-American cohorts (data not shown), probably because there were only a few patients who were homozygous for the variant allele (AA) in these cohorts (only 6, 2, and 4 patients, respectively). In the linear regression model, the average daily dose was added as a covariate. Based on the results for the mean relative change in HbA1c in each genotype group (Table 4), linear regression analysis of reduction in HbA1c levels was carried out under a recessive model for the genetic variant. The results showed that the MATE2-K homozygous variant allele was associated with a significantly smaller relative change in HbA1c levels after initiation of metformin in the Marshfield Clinic (coefficient = 0.13 (95% CI: 0.047, 0.21); P = 0.0025, Table 4 (i)). The results were more significant in the combined Caucasian group (coefficient = 0.12 (95% CI: 0.052, 0.20); P = 0.00084, Table 4 (ii)) and remained significant in the combined Caucasian and African- American group (coefficient = 0.091 (95% CI: 0.025, 0.16); P = 0.0073, Table 4 (iii)).
Table 4.
Association analyses of MATE2-K variants with metformin response
| (i) Marshfield Clinic (N = 105) | ||
| Genotype group g.−130G>A | Number | Mean relative change (95% confidence interval) |
| GG | 58 | −0.13 (−0.16,−0.099) |
| GA | 37 | −0.13 (−0.18,−0.095) |
| AA | 10 | −0.0097 (−0.076,0.068) |
| GG/GA | 95 | −0.13 (−0.16,−0.11) |
| Statistical analyses | ||
| Kruskal–Wallis test (P value) | 0.029 | |
| Mann–Whitney test (GG/GA vs. AA) (P value) | 0.0091 | |
| Linear regression model (recessive):relative change = variant allele + dose | Coefficient = 0.13 (0.047,0.21);P = 0.0025 | |
| (ii) Caucasians (N = 189) | ||
| Genotype group g.−130G>A | Number | Mean relative change (95% confidence interval) |
| GG | 98 | −0.13 (−0.16,−0.11) |
| GA | 77 | −0.16 (−0.20,−0.13) |
| AA | 14 | −0.027 (−0.076,0.033) |
| GG/GA | 175 | −0.15 (−0.17,−0.13) |
| Statistical analyses | ||
| Kruskal–Wallis test (P value) | 0.0035 | |
| Mann–Whitney test (GG/GA vs. AA) (P value) | 0.0020 | |
| Linear regression model (recessive):relative change = variant allele + dose | Coefficient = 0.12 (0.052,0.20);P = 0.00084 | |
| (iii) Caucasians and African Americans (n = 253) | ||
| Genotype group g.−130G>A | Number | Mean relative change (95% confidence interval) |
| GG | 139 | −0.13 (−0.15,−0.11) |
| GA | 96 | −0.16 (−0.19,−0.13) |
| AA | 18 | −0.059 (−0.11,−0.0032) |
| GG/GA | 235 | −0.14 (−0.16,−0.12) |
| Statistical analyses | ||
| Kruskal–Wallis test (P value) | 0.047 | |
| Mann–Whitney test (GG/GA vs. AA) (P value) | 0.031 | |
| Linear regression model (recessive):Relative change = variant allele + dose + ethnicity | Coefficient = 0.091 (0.025,0.16);P = 0.0073 | |
| (iv) Caucasians and African Americans (n = 248):removed African-American carriers of the variant c.485C>T | ||
| Genotype group g.−130G>A | Number | Mean relative change (95% confidence interval) |
| GG | 139 | −0.13 (−0.15,−0.11) |
| GA | 93 | −0.16 (−0.19,−0.13) |
| AA | 16 | −0.039 (−0.085,0.017) |
| GG/GA | 232 | −0.14 (−0.16,−0.12) |
| Statistical analyses | ||
| Kruskal–Wallis test (P value) | 0.013 | |
| Mann–Whitney test (GG/GA vs. AA) (P value) | 0.0078 | |
| Linear regression model (recessive):relative change = variant allele + dose + ethnicity | Coefficient = 0.11 (0.038,0.18);P = 0.0026 | |
Mean relative change of glycated hemoglobin (HbA1c) lewis were calculated for each MATE2-K g.−130G>A genotype group in the Marshfield Clinic (N = 105), Caucasians (N = 189), or the combined group of Caucasians and African America (N = 253). The 95% confidence intervals were calculated by nonparametric bootstrap estimates of the 95% confidence interval. Relative change = (treatment HbA1c minus baseline HbA1c)/baseline HbA1c. Relative change of −0.13 is interpreted as a decrease in HbA1c level by 13% from baseline. In the linear regression model, the coefficient represents the increase (positive value) or decrease (negative value) in relative change in HbA1c for those patients who carry the homozygous variant g.−130G>A allele. Boldface values signify P < 0.05.
Association between the MATE2-K nonsynonymous variant and initial metformin response in T2DM patients
We evaluated the effect of the common MATE2-K nonsynonymous variant c.485C>T on metformin response in African Americans from Kaiser South East. Of the 53 African Americans in the Kaiser South East cohort, 5 were heterozygous for c.485C>T. Although the changes were not statistically significant, there was a greater reduction in HbA1c levels during treatment in the patients who were heterozygous for c.485C>T, (−0.16% (95% CI: −0.28, −0.44) vs. −0.11% (95% CI: −0.16, −0.070), Mann–Whitney nonparametric P values ~0.4). The linkage disequilibrium analysis showed that the MATE2-K nonsynonymous variant c.485C>T was in complete linkage disequilibrium (D′ = 1.0 (0.4−1.0), lod = 2.62) with the 5′-UTR variant g.−130G>A (r2 = 0.18). These variants are ~3,900 bp apart. Given that the reduced-function coding variant, c.485C>T, would oppose the effect of the gain-of-function 5′-UTR variant, we removed the data for the five patients who were heterozygous for c.485C>T (two patients who were homozygous for the 5′-UTR variant g.−130G>A and three who were heterozygous for g.−130G>A) and determined the effect of the MATE2-K variant g.−130G>A on metformin response in the combined group of Caucasians and African Americans (Table 4(iv)). Despite the small numbers, we saw a greater association of the homozygous variant g.−130G>A with reduced response to metformin (Mann–Whitney nonparametric P values <0.05 in Table 4 (iii) vs. P values <0.01 in Table 4 (iv)). Other functional variants in OCT1 (R61C, G401S, 420Del, and G465R),14,16–18 OCT2 (A270S),24 and MATE1 (Intron 10, rs2289669)12,25 that have been shown to have an effect on metformin disposition or metformin response were selected to determine their associations with metformin response in this cohort. However, none of these functional variants was found to be significantly associated with relative change in HbA1c (Supplementary Table S2 online).
Discussion
Functional changes in the activity or expression level of MATE2-K caused by genetic variants in the coding or basal promoter regions of this transporter may result in changes in the expression and activity levels of drugs that are substrates for the transporter. This study was conducted to identify and functionally characterize genetic variants in the coding and basal promoter regions of MATE2-K in populations constituting four major ethnic groups. We identified four nonsynonymous variants in the coding region. The c.485C>T variant was found at a minor allele frequency of 5.6% in the African-American SOPHIE cohort (N = 63) and 4.7% in the African-American patients in the Kaiser South East cohort (N = 53). This novel variant has not been reported in any known SNP database, including the 1000 Human Genomes Project.26
Recently, Kajiwara et al.9 found that the nonsynonymous MATE2-K variant Gly211Val was associated with a complete loss of transport activity, mainly because of a decrease in MATE2-K protein expression. Although the allelic frequency of Gly211Val in the Japanese sample was 1.7%, it was not observed in our cohort of 68 individuals with Chinese ancestry. In our study, the two nonsynonymous MATE2-K variants, c.485C>T and c.1177G>A, were associated with significantly reduced transport activities in uptake assays using various cationic compounds (Figure 1). Our results from immunoblotting analysis suggest that the decreased activity levels of c.485C>T were due largely to a decrease in protein expression (Figure 1b). Consistent with the reduced function of Pro162Leu and Gly393Arg, we observed that Pro162 (located in the hydrophobic membrane domain (Figure 2)) and Gly393 (located in the hydrophilic cytoplasm site) are conserved across multiple species. By contrast, the variants that did not affect function occurred at sites that were not evolutionarily conserved (Supplementary Figure S3 online). The model showed that the Gly393Arg, which changes a glycine to positively charged arginine, would decrease the interaction of cationic ligands with MATE2-K (Figure 2c,d). This prediction is consistent with the dramatically reduced uptake of the cationic compounds in HEK-293 cells expressing the variant Gly393Arg, despite the observation that the total protein expression for Gly393Arg is comparable to that in MATE2-K reference cells. The model also predicted that two previously identified nonsynonymous variants9 would have deleterious effects on the transport function of MATE2-K.
The most common variant of the basal promoter region in this study, g.−130G>A, was associated with a significant increase in promoter activity in reporter assays (Figure 3b). Transcription factor binding site analysis suggested that MZF-1 could bind to the region encompassing g.−130G>A and that the binding affinity would be variant-dependent; MZF-1 would have a higher binding affinity for the g.−130G allele than for the minor allele. MZF-1 appears to be a repressor of the chloramphenicol acetyl transferase reporter gene in nonhematopoietic cell lines.27,28 MZF-1 contains 13 zinc fingers that interact with two different consensus sequences, AGTGGGGA and CGGGNGAGGGGGAA, for fingers 1–4 and fingers 5–13, respectively.21 We observed that MATE2-K contains the sequence GGAGGAGGGGCTA, which is similar to the consensus sequence recognized by MZF-1. The variant g.−130G>A results in the sequence GGAGGAGGAGCTA, which is not as good a match as the reference is. Therefore, we predicted that MZF-1 would preferentially bind to the reference DNA sequence rather than to the variant sequence. The results of EMSA supported our hypothesis. The intensity of the DNA-MZF-1 complex was decreased in the presence of g.−130G>A (Figure 4a). We also demonstrated that MZF-1 represses MATE2-K transcription (Figure 4b), establishing that this transcription factor may be important in regulating the expression of MATE2-K. Data from microarray experiments suggest that there are higher expression levels of MZF-1 (and MATE2-K) in kidney tissue samples as compared with cancer cell lines (Supplementary Table S3 online). These data suggest that MZF-1 could play a role in regulating MATE2-K expression levels in kidney tissue.
Previously, two separate studies have shown that the MATE1 intronic variants rs2289669 and rs8065082 have significant effects on metformin response,12,15 although the mechanism underlying the effects of these SNPs has not been determined. In our study group of 189 Caucasians, we observed an association of the intronic variant rs2289669 with relative change in HbA1c level, almost at the level of statistical significance (P = 0.055) (Supplementary Table S2 online). Unlike Becker et al.,15 we focused only on patients who had recently been diagnosed with T2DM and initiated on metformin monotherapy. Examination of the MATE1 intronic variant rs2289669 showed that it is not in linkage disequilibrium with the MATE2-K variants that we genotyped. Previously, we and others have shown that OCT1 reduced-function variants (R61C, 420Del, G401S, and G465R) and an OCT2 variant (A270S) are determinants of metformin pharmacokinetics16,18,24,29,30 and pharmacodynamics in healthy subjects.17 However, our results (Supplementary Table S2 online) also support findings from other studies showing that the variants may not have a significant effect on metformin response in patients with T2DM.12,14
To our knowledge, there have been no studies investigating the effects of genetic variants of MATE2-K on metformin response. Although a small study in Japanese diabetes patients (n = 48) found no association between either of the MATE1 or MATE2-K coding region variants and metformin disposition,31 that study had only two patients who were carriers of the reduced-function MATE2-K variant Gly211Val. In our study, we focused on the common 5′-UTR variant g.−130G>A, which is associated with enhanced promoter activity. Our hypothesis was that individuals with this variant would eliminate metformin more quickly, and that the therapeutic effect in these patients would therefore be lower. Our clinical results were consistent with our hypothesis. That is, patients who were homozygous for the g.−130G>A variant had a markedly weaker response to metformin (only a 2.7% relative reduction in HbA1c vs. 15% in all others) (N = 189 Caucasians, Table 4 (ii); Mann–Whitney test P value = 0.002). With the available data, we were not able to determine whether a pharmacokinetic mechanism was responsible for the effect of the variant on metformin response and could not evaluate the contribution of this variant to metformin pharmacokinetics. The significance was weaker when we combined the Caucasian and African-American patients; however, when we removed the data for the five patients with the reduced-function nonsynonymous variant c.485C>T, the association became stronger (compare the results in Table 4 (iii) and (iv)). We proposed that the reducedfunction coding variant c.485C>T would oppose the effects of the gain-of-function 5′-UTR variant. After adjusting for the relative change in HbA1c with average daily dose and ethnicity in a linear regression model, the significance of this association remained (Table 4).
Interestingly, the recent findings of the genome-wide association study of glycemic response to metformin in ~3,000 European T2DM patients did not identify any significant SNPs (P < 0.0001) in metformin transporter genes.32 However the platform used in that study did not include the MATE2-K g.−130G>A SNP, nor were any SNPs on the platform in strong linkage disequilibrium with the g.−130G>A SNP. Other studies of genetic factors associated with response to metformin have not included MATE2-K g.130G>A. Our study demonstrates that rare variants in MATE2-K, such as c.485C>T, and in other transporters that are functionally deleterious, if not considered in the analyses, may add complexity to the identification of significant common SNPs associated with response to metformin.
In conclusion, a common gain-of-function 5′-UTR variant of MATE2-K, g.−130G>A, is significantly associated with poor glycemic response to metformin in newly diagnosed T2DM patients. Future studies to evaluate its effects on metformin plasma levels and clearance will provide important information on the mechanism by which MATE2-K contributes to the anti-diabetes effects of metformin and on how the g.−130G>A variant, in particular, modulates metformin response. The next key challenge in pharmacogenomics research is to demonstrate that the use of this genetic information will improve outcomes for patients and lead to personalized medicine in clinical practice.33
Methods
An overview of the methods used in this study is provided here; the details of these methods, statistical analyses, and associated references are available in the Supplementary Data online.
Genetic analysis of MATE2-K variants
Genomic DNA samples were collected from unrelated healthy individuals from four major ethnic groups (68 each from European Americans, African Americans, Chinese Americans, and Mexican Americans) as a part of the Study of Pharmacogenetics in Ethnically Diverse Populations (SOPHIE).29
Cellular assays
Cellular transport uptake studies and luciferase assays were performed as described previously.7,8,34,35 See Supplementary Table S1 online for oligonucleotide primers used for different experiments related to molecular cloning, genotyping or EMSA.
Immunoblotting assay and real-time PCR
Both assays were performed as described36–38 on HEK-293 cells transfected with MATE2-K reference sequence or variants. EMSA. EMSA was performed as previously described8,39 using nuclear protein extracts from HCT-116 cells.
Structure-based analysis and comparative model
The structure of MATE2-K was modeled using MODELLER-10v8,40 based on the X-ray structure of the MATE homolog from Vibrio cholerae, NorM (Protein Data Bank identified 3MKT).19
Assessment of metformin response
We used large-scale DNA databanks linked to electronic medical records systems at Marshfield Clinic Research Foundation,41 Kaiser Permanente South East, Georgia,42 and BioVU (Vanderbilt University’s DNA databank)43–46 to select T2DM patients who had been prescribed metformin monotherapy as their initial hypoglycemic medication. We used relative change in HbA1c to assess metformin response in the first 90–270 days after the initiation of metformin monotherapy, where relative change = (treatment HbA1c minus baseline HbA1c)/baseline HbA1c.
Supplementary Material
Acknowledgments
Financial Support: This study was supported by grants from the National Institutes of Health (K.M.G. (GM61390, GM36780, and GM74929), R.A.W. (DK080007), D.M.R. (HL65962), A.Sc. (F32 GM088991), and A.Sa. (GM61390)) and the Agency for Healthcare Research and Quality. J.H.C. is partially supported by a National Research Foundation of Korea grant funded by the Korean government (MEST) (2010-0029353). S.W.Y. and K.M.G. gratefully acknowledge the support from Institute for Human Genetics, UCSF.
Footnotes
Conflict of Interest: The authors declared no conflict of interest.
SUPPLEMENTARY MATERIAL
Supplementary material is linked to the online version of the paper at http://www.nature.com/cpt
References
- 1.Fujita T, Urban TJ, Leabman MK, Fujita K, Giacomini KM. Transport of drugs in the kidney by the human organic cation transporter, OCT2 and its genetic variants. J. Pharm. Sci. 2006;95:25–36. doi: 10.1002/jps.20536. [DOI] [PubMed] [Google Scholar]
- 2.Otsuka M, Matsumoto T, Morimoto R, Arioka S, Omote H, Moriyama Y. A human transporter protein that mediates the final excretion step for toxic organic cations. Proc. Natl. Acad. Sci. USA. 2005;102:17923–17928. doi: 10.1073/pnas.0506483102. [DOI] [PMC free article] [PubMed] [Google Scholar]
- 3.Masuda S, et al. Identification and functional characterization of a new human kidney-specific H+/organic cation antiporter, kidney-specific multidrug and toxin extrusion 2. J. Am. Soc. Nephrol. 2006;17:2127–2135. doi: 10.1681/ASN.2006030205. [DOI] [PubMed] [Google Scholar]
- 4.Tanihara Y, Masuda S, Sato T, Katsura T, Ogawa O, Inui K. Substrate specificity of MATE1 and MATE2-K, human multidrug and toxin extrusions/ H(+)-organic cation antiporters. Biochem. Pharmacol. 2007;74:359–371. doi: 10.1016/j.bcp.2007.04.010. [DOI] [PubMed] [Google Scholar]
- 5.Watanabe S, Tsuda M, Terada T, Katsura T, Inui K. Reduced renal clearance of a zwitterionic substrate cephalexin in MATE1-deficient mice. J. Pharmacol. Exp. Ther. 2010;334:651–656. doi: 10.1124/jpet.110.169433. [DOI] [PubMed] [Google Scholar]
- 6.Tsuda M, Terada T, Mizuno T, Katsura T, Shimakura J, Inui K. Targeted disruption of the multidrug and toxin extrusion 1 (mate1) gene in mice reduces renal secretion of metformin. Mol. Pharmacol. 2009;75:1280–1286. doi: 10.1124/mol.109.056242. [DOI] [PubMed] [Google Scholar]
- 7.Chen Y, et al. Genetic variants in multidrug and toxic compound extrusion-1, hMATE1, alter transport function. Pharmacogenomics J. 2009;9:127–136. doi: 10.1038/tpj.2008.19. [DOI] [PMC free article] [PubMed] [Google Scholar]
- 8.Choi JH, et al. Identification and characterization of novel polymorphisms in the basal promoter of the human transporter, MATE1. Pharmacogenet Genomics. 2009;19:770–780. doi: 10.1097/FPC.0b013e328330eeca. [DOI] [PMC free article] [PubMed] [Google Scholar]
- 9.Kajiwara M, et al. Identification of multidrug and toxin extrusion (MATE1 and MATE2-K) variants with complete loss of transport activity. J. Hum. Genet. 2009;54:40–46. doi: 10.1038/jhg.2008.1. [DOI] [PubMed] [Google Scholar]
- 10.Meyer zu Schwabedissen HE, Verstuyft C, Kroemer HK, Becquemont L, Kim RB. Human multidrug and toxin extrusion 1 (MATE1/SLC47A1) transporter: functional characterization, interaction with OCT2 (SLC22A2), and single nucleotide polymorphisms. Am. J. Physiol. Renal Physiol. 2010;298:F997–F1005. doi: 10.1152/ajprenal.00431.2009. [DOI] [PubMed] [Google Scholar]
- 11.Becker ML, Visser LE, van Schaik RH, Hofman A, Uitterlinden AG, Stricker BH. Genetic variation in the organic cation transporter 1 is associated with metformin response in patients with diabetes mellitus. Pharmacogenomics J. 2009;9:242–247. doi: 10.1038/tpj.2009.15. [DOI] [PubMed] [Google Scholar]
- 12.Jablonski KA, et al. Common variants in 40 genes assessed for diabetes incidence and response to metformin and lifestyle intervention in the diabetes prevention program. Diabetes. 2010;59:2672–2681. doi: 10.2337/db10-0543. [DOI] [PMC free article] [PubMed] [Google Scholar]
- 13.Komatsu T, et al. Characterization of the human MATE2 proton-coupled polyspecific organic cation exporter. Int. J. Biochem. Cell Biol. 2011;43:913–918. doi: 10.1016/j.biocel.2011.03.005. [DOI] [PubMed] [Google Scholar]
- 14.Zhou K, et al. Reduced-function SLC22A1 polymorphisms encoding organic cation transporter 1 and glycemic response to metformin: a GoDARTS study. Diabetes. 2009;58:1434–1439. doi: 10.2337/db08-0896. [DOI] [PMC free article] [PubMed] [Google Scholar]
- 15.Becker ML, Visser LE, van Schaik RH, Hofman A, Uitterlinden AG, Stricker BH. Genetic variation in the multidrug and toxin extrusion 1 transporter protein influences the glucose-lowering effect of metformin in patients with diabetes: a preliminary study. Diabetes. 2009;58:745–749. doi: 10.2337/db08-1028. [DOI] [PMC free article] [PubMed] [Google Scholar]
- 16.Tzvetkov MV, et al. The effects of genetic polymorphisms in the organic cation transporters OCT1, OCT2, and OCT3 on the renal clearance of metformin. Clin. Pharmacol. Ther. 2009;86:299–306. doi: 10.1038/clpt.2009.92. [DOI] [PubMed] [Google Scholar]
- 17.Shu Y, et al. Effect of genetic variation in the organic cation transporter 1 (OCT1) on metformin action. J. Clin. Invest. 2007;117:1422–1431. doi: 10.1172/JCI30558. [DOI] [PMC free article] [PubMed] [Google Scholar]
- 18.Shu Y, et al. Effect of genetic variation in the organic cation transporter 1, OCT1, on metformin pharmacokinetics. Clin. Pharmacol. Ther. 2008;83:273–280. doi: 10.1038/sj.clpt.6100275. [DOI] [PMC free article] [PubMed] [Google Scholar]
- 19.He X, et al. Structure of a cation-bound multidrug and toxic compound extrusion transporter. Nature. 2010;467:991–994. doi: 10.1038/nature09408. [DOI] [PMC free article] [PubMed] [Google Scholar]
- 20.Noll L, Peterson FC, Hayes PL, Volkman BF, Sander T. Heterodimer formation of the myeloid zinc finger 1 SCAN domain and association with promyelocytic leukemia nuclear bodies. Leuk. Res. 2008;32:1582–1592. doi: 10.1016/j.leukres.2008.03.024. [DOI] [PubMed] [Google Scholar]
- 21.Lenny N, Westendorf JJ, Hiebert SW. Transcriptional regulation during myelopoiesis. Mol. Biol. Rep. 1997;24:157–168. doi: 10.1023/a:1006859700409. [DOI] [PubMed] [Google Scholar]
- 22.Saji T, Kikuchi R, Kusuhara H, Kim I, Gonzalez FJ, Sugiyama Y. Transcriptional regulation of human and mouse organic anion transporter 1 by hepatocyte nuclear factor 1 alpha/beta. J. Pharmacol. Exp. Ther. 2008;324:784–790. doi: 10.1124/jpet.107.128249. [DOI] [PubMed] [Google Scholar]
- 23.Manna SK, Mukhopadhyay A, Aggarwal BB. IFN-alpha suppresses activation of nuclear transcription factors NF-kappa B and activator protein 1 and potentiates TNF-induced apoptosis. J. Immunol. 2000;165:4927–4934. doi: 10.4049/jimmunol.165.9.4927. [DOI] [PubMed] [Google Scholar]
- 24.Chen Y, et al. Effect of genetic variation in the organic cation transporter 2 on the renal elimination of metformin. Pharmacogenet. Genomics. 2009;19:497–504. doi: 10.1097/FPC.0b013e32832cc7e9. [DOI] [PMC free article] [PubMed] [Google Scholar]
- 25.Becker ML, Visser LE, van Schaik RH, Hofman A, Uitterlinden AG, Stricker BH. Genetic variation in the multidrug and toxin extrusion 1 transporter protein influences the glucose-lowering effect of metformin in patients with diabetes: a preliminary study. Diabetes. 2009;58:745–749. doi: 10.2337/db08-1028. [DOI] [PMC free article] [PubMed] [Google Scholar]
- 26.1000 Genomes Project Consortium. A map of human genome variation from population-scale sequencing. Nature. 2010;467:1061–1073. doi: 10.1038/nature09534. [DOI] [PMC free article] [PubMed] [Google Scholar]
- 27.Morris JF, et al. The myeloid zinc finger gene, MZF-1, regulates the CD34 promoter in vitro. Blood. 1995;86:3640–3647. [PubMed] [Google Scholar]
- 28.Hromas R, et al. Hematopoietic transcriptional regulation by the myeloid zinc finger gene, MZF-1. Curr. Top. Microbiol. Immunol. 1996;211:159–164. doi: 10.1007/978-3-642-85232-9_16. [DOI] [PubMed] [Google Scholar]
- 29.Wang ZJ, Yin OQ, Tomlinson B, Chow MS. OCT2 polymorphisms and in-vivo renal functional consequence: studies with metformin and cimetidine. Pharmacogenet. Genomics. 2008;18:637–645. doi: 10.1097/FPC.0b013e328302cd41. [DOI] [PubMed] [Google Scholar]
- 30.Song IS, et al. Genetic variants of the organic cation transporter 2 influence the disposition of metformin. Clin. Pharmacol. Ther. 2008;84:559–562. doi: 10.1038/clpt.2008.61. [DOI] [PubMed] [Google Scholar]
- 31.Toyama K, et al. Heterozygous variants of multidrug and toxin extrusions (MATE1 and MATE2-K) have little influence on the disposition of metformin in diabetic patients. Pharmacogenet. Genomics. 2010;20:135–138. doi: 10.1097/FPC.0b013e328335639f. [DOI] [PubMed] [Google Scholar]
- 32.The GoDARTS and UKPDS Diabetes Pharmacogenetics Study Group et al. Common variants near ATM are associated with glycemic response to metformin in type 2 diabetes. Nat. Genet. 2011;43:117–120. doi: 10.1038/ng.735. [DOI] [PMC free article] [PubMed] [Google Scholar]
- 33.Roden DM, Tyndale RF. Pharmacogenomics at the tipping point: challenges and opportunities. Clin. Pharmacol. Ther. 2011;89:323–327. doi: 10.1038/clpt.2010.340. [DOI] [PubMed] [Google Scholar]
- 34.Chen Y, Zhang S, Sorani M, Giacomini KM. Transport of paraquat by human organic cation transporters and multidrug and toxic compound extrusion family. J. Pharmacol. Exp. Ther. 2007;322:695–700. doi: 10.1124/jpet.107.123554. [DOI] [PubMed] [Google Scholar]
- 35.Yee SW, et al. Identification and characterization of proximal promoter polymorphisms in the human concentrative nucleoside transporter 2 (SLC28A2) J. Pharmacol. Exp. Ther. 2009;328:699–707. doi: 10.1124/jpet.108.147207. [DOI] [PMC free article] [PubMed] [Google Scholar]
- 36.Urban TJ, et al. Functional effects of protein sequence polymorphisms in the organic cation/ergothioneine transporter OCTN1 (SLC22A4) Pharmacogenet Genomics. 2007;17:773–782. doi: 10.1097/FPC.0b013e3281c6d08e.. [DOI] [PubMed] [Google Scholar]
- 37.Chen L, et al. Role of organic cation transporter 3 (SLC22A3) and its missense variants in the pharmacologic action of metformin. Pharmacogenet. Genomics. 2010;20:687–699. doi: 10.1097/FPC.0b013e32833fe789. [DOI] [PMC free article] [PubMed] [Google Scholar]
- 38.Shima JE, et al. Genetic variants of human organic anion transporter 4 demonstrate altered transport of endogenous substrates. Am. J. Physiol. Renal Physiol. 2010;299:F767–F775. doi: 10.1152/ajprenal.00312.2010. [DOI] [PMC free article] [PubMed] [Google Scholar]
- 39.Xu J, Wu Y, He L, Yang Y, Moore SA, Hsu CY. Regulation of cytokineinduced iNOS expression by a hairpin oligonucleotide in murine cerebral endothelial cells. Biochem. Biophys. Res. Commun. 1997;235:394–397. doi: 10.1006/bbrc.1997.6800. [DOI] [PubMed] [Google Scholar]
- 40.Sali A, Blundell TL. Comparative protein modelling by satisfaction of spatial restraints. J. Mol. Biol. 1993;234:779–815. doi: 10.1006/jmbi.1993.1626. [DOI] [PubMed] [Google Scholar]
- 41.McCarty CA, Wilke RA. Biobanking and pharmacogenomics. Pharmacogenomics. 2010;11:637–641. doi: 10.2217/pgs.10.13. [DOI] [PubMed] [Google Scholar]
- 42.Platt R, et al. Multicenter epidemiologic and health services research on therapeutics in the HMO Research Network Center for Education and Research on Therapeutics. Pharmacoepidemiol. Drug Saf. 2001;10:373–377. doi: 10.1002/pds.607. [DOI] [PubMed] [Google Scholar]
- 43.Pendergrass S, Dudek SM, Roden DM, Crawford DC, Ritchie MD. Visual integration of results from a large DNA biobank (biovu) using synthesis-view. Pac. Symp. Biocomput. 2011:265–275. doi: 10.1142/9789814335058_0028. [DOI] [PMC free article] [PubMed] [Google Scholar]
- 44.Ritchie MD, et al. Robust replication of genotype-phenotype associations across multiple diseases in an electronic medical record. Am. J. Hum. Genet. 2010;86:560–572. doi: 10.1016/j.ajhg.2010.03.003. [DOI] [PMC free article] [PubMed] [Google Scholar]
- 45.Wilke RA, et al. The emerging role of electronic medical records in pharmacogenomics. Clin. Pharmacol. Ther. 2011;89:379–386. doi: 10.1038/clpt.2010.260. [DOI] [PMC free article] [PubMed] [Google Scholar]
- 46.Roden DM, et al. Development of a large-scale de-identified DNA biobank to enable personalized medicine. Clin. Pharmacol. Ther. 2008;84:362–369. doi: 10.1038/clpt.2008.89. [DOI] [PMC free article] [PubMed] [Google Scholar]
- 47.Levey AS, et al. Using standardized serum creatinine values in the modification of diet in renal disease study equation for estimating glomerular filtration rate. Ann. Intern. Med. 2006;145:247–254. doi: 10.7326/0003-4819-145-4-200608150-00004. [DOI] [PubMed] [Google Scholar]
Associated Data
This section collects any data citations, data availability statements, or supplementary materials included in this article.