The noninvasive nature, accuracy, and longitudinal repeatability of pseudo-continuous arterial spin–labeled perfusion MR imaging should facilitate its use in neurodevelopmental studies.
Abstract
Purpose:
To evaluate the longitudinal repeatability and accuracy of cerebral blood flow (CBF) measurements by using pseudo-continuous arterial spin–labeled (pCASL) perfusion magnetic resonance (MR) imaging in typically developing children.
Materials and Methods:
Institutional review board approval with HIPAA compliance and informed consent were obtained. Twenty-two children aged 7–17 years underwent repeated pCASL examinations 2–4 weeks apart with a 3-T MR imager, along with in vivo blood T1 and arterial transit time measurements. Phase-contrast (PC) MR imaging was performed as the reference standard for global blood flow volume. Intraclass correlation coefficient (ICC) and within-subject coefficient of variation (wsCV) were used to evaluate accuracy and repeatability.
Results:
The accuracy of pCASL against the reference standard of PC MR imaging increased on incorporating subjectwise in vivo blood T1 measurement (ICC: 0.32 vs 0.58). The ICC further increased to 0.65 by using a population-based model of blood T1. Additionally, CBF measurements with use of pCASL demonstrated a moderate to good level of longitudinal repeatability in whole brain (ICC = 0.61, wsCV = 15%), in gray matter (ICC = 0.65, wsCV = 14%), and across 16 brain regions (mean ICC = 0.55, wsCV = 17%). The mean arterial transit time was 1538 msec ± 123 (standard deviation) in the pediatric cohort studied, which showed an increasing trend with age (P = .043).
Conclusion:
Incorporating developmental changes in blood T1 is important for improving the accuracy of pCASL CBF measurements in children and adolescents; the noninvasive nature, accuracy, and longitudinal repeatability should facilitate the use of pCASL perfusion MR imaging in neurodevelopmental studies.
© RSNA, 2012
Introduction
Arterial spin labeling (ASL) provides a noninvasive means for quantifying regional cerebral blood flow (CBF) by using magnetically labeled blood as an endogenous tracer (1). CBF is coupled to neural activity and serves as a surrogate of regional brain function. Given the noninvasive nature of the method and the ease of implementation, the technique has particular appeal for pediatric populations. In neurodevelopmental studies, quantitative CBF may serve as an important marker of cognitive development in healthy children as well as an early indicator of aberrant changes in brain function as might occur in childhood brain disorders (2). However, even normative pediatric quantitative perfusion data are sparse at best, primarily owing to safety concerns and technical difficulties associated with existing methods that rely on radioisotope tracers, such as positron emission tomography (PET). In contrast, ASL perfusion magnetic resonance (MR) imaging is ideally suited for pediatric perfusion imaging as it is totally noninvasive and provides superior signal-to-noise ratio compared with perfusion images in adults (due to intrinsically high baseline CBF as well as prolonged blood-brain T1 in children) (3,4). Additionally, the capability for absolute CBF quantification with ASL facilitates longitudinal studies to follow neurodevelopmental changes (5).
To date, a handful of ASL perfusion MR imaging studies have been performed in the pediatric populations and have demonstrated CBF variations with age that generally match those in PET literature (5–7). To facilitate routine use of ASL for CBF quantification in neurodevelopmental studies, the long-term reproducibility as well as the accuracy of the method in pediatric populations needs to be more thoroughly evaluated. The goal of the present study was to evaluate the longitudinal repeatability and accuracy of CBF measurements by using pseudo-continuous ASL (pCASL) perfusion MR imaging (8,9) in typically developing children. Since arterial transit time (the duration for the labeled blood to flow into brain tissue) and blood T1 are critical physiologic parameters affecting the accuracy of ASL perfusion quantification, we also performed in vivo measurements of arterial transit time and blood T1 in the pediatric cohort, and investigated their effects on CBF quantification.
Materials and Methods
Subjects
This prospective study received institutional review board approval and was Health Insurance Portability and Accountability Act compliant. Between June and October of 2009, 22 normally developing pediatric subjects (age range, 7–17 years; mean age, 11 years ± 3 [standard deviation]; 15 boys [mean age, 9.7 years; range, 7–17 years] and seven girls [mean age, 12.7 years; range, 8–17 years], including 12 Caucasian, seven African American, and three Asian subjects) were recruited after informed consent was obtained from a parent or legal guardian, as well as from the child. Each subject was imaged twice within 2–4 weeks. Inclusion criteria were as follows: typically healthy developing children between 7 and 17 years of age, with English as the primary language. Exclusion criteria included subjects with history of neurologic or psychiatric disorder, abuse of drugs or alcohol, and major systemic disease; subjects whose caregivers do not speak English; and subjects with contraindications to MR imaging or with known claustrophobia. No subjects were excluded in the present study. All examinations were performed with use of a 3-T imager (Verio; Siemens Medical Solutions, Erlangen, Germany) by using a 32-channel head coil.
Imaging Protocol
A balanced gradient version of a pCASL sequence as described by Wu et al (9) in 2007 was used in our imaging protocol. The labeling plane was prescribed 9 cm below the central section of the imaging volume. Imaging parameters were as follows: repetition time, 4000 msec; echo time, 22 msec; field of view, 20 cm; matrix, 96 × 96; 16 sections with 6 mm thickness and 1.2 mm gap; labeling duration of 1.5 seconds and postlabeling delay of 1.2 seconds; spin-echo echo-planar imaging; generalized autocalibrating partially parallel acquisition (GRAPPA) with an acceleration factor of two. Each section acquisition took 60 msec, resulting in a postlabeling delay range of 1.2–2.1 seconds from the bottom to the top section. The total imaging time with 80 acquisitions was 5.5 minutes. Arterial transit time was measured by using flow-encoding arterial spin tagging (FEAST) (10), which consisted of interleaved diffusion-weighted pCASL acquisitions with b values of 0 and 10 sec/mm2 (velocity encoding = 8 mm/sec). Imaging parameters were field of view, 20 cm; repetition time, 3500 msec; echo time, 48 msec; matrix, 64 × 64; eight sections with 8-mm thickness and 2-mm gap; GRAPPA with an acceleration factor of two, and background suppression by using two inversion pulses during the postlabeling delay of 1 second.
Additionally, a segmented multiphase inversion-recovery prepared balanced steady-state free precession imaging sequence was used for in vivo blood T1 measurements at the level of the superior sagittal sinus, according to parameters outlined in Wu et al in 2010 (11). Time-resolved flow velocities in the internal carotid and vertebral arteries were measured by using a pulse-gated phase-contrast (PC) sequence at the identical position of the labeling plane of pCASL. Imaging parameters were field of view, 20 cm; matrix size, 256 × 256; flip angle, 15°; repetition time, 25 msec; echo time, 5 msec; 5 mm section thickness; and velocity encoding of 100 cm/sec. A three-dimensional magnetization-prepared rapid gradient echo acquisition was used for high-spatial-resolution T1-weighted anatomic images for the estimation of brain volume.
Data Analysis
Raw echo-planar images were realigned by using SPM8 (available at: http://www.fil.ion.ucl.ac.uk/spm/) and brain was extracted by using the skull stripping function of Mricro (available at: http://www.cabiatl.com/mricro/). Excessive motion (ghosting in phase-encoding direction causing >4-pixel shift) was detected in four (18%) of 22 subjects, and the four pCASL studies with motion artifacts were abandoned for further analyses. Quantitative CBF values were calculated by using a standard one-compartment perfusion model with and without incorporating in vivo blood T1, respectively:
 |
where f is CBF, R1a is the longitudinal relaxation rate of blood (default is 0.61 sec−1) (12), Mcon is the average control image intensity, α is the tagging efficiency (0.85), τ (1.5 second) is the duration of the labeling pulse, w is the postlabeling delay time, δ is arterial transit time, and λ (0.9 g/mL) is blood/tissue water partition coefficient.
For FEAST, arterial transit time, δ, was calculated based on the following two equations,
and
where ΔM and ΔM’ represent the pCASL signal acquired without and with diffusion gradients, respectively, where A is a constant. CBF and arterial transit time data were analyzed by V.J. and D.J.J.W. (with 3 and more than 10 years of experience, respectively).
For PC MR imaging, a mask created from the magnitude images was superimposed on the phase difference images to obtain the average blood flow velocity (in centimeters per second) in the main feeding vessels to the brain (internal carotid arteries and basilar artery). The product of the average flow velocity and the cross-sectional area of the main arteries gave the average blood flow volume in units of milliliters per minute. The average blood flow volume was then divided by the brain volume estimated from magnetization-prepared rapid gradient echo images by using a semiautomated region growing segmentation algorithm implemented in ITKSnap (http://www.itksnap.org/pmwiki/pmwiki.php) to obtain mean global CBF in standard units (mL/100 g/min), assuming a mean brain density of 1.05 g/mL (13). PC MR imaging was analyzed by V.J.
CBF maps were coregistered with structural MR images in each subject by using SPM8. A structural and perfusion template of the 22 children was constructed by using the ANTS (Advanced Normalization Tools Software; available at http://www.picsl.upenn.edu/ANTS) software based on diffeomorphic transformation (14). Tissue segmentation of gray matter, white matter, and cerebrospinal fluid was also performed by using ANTS (15), which also provided an anatomic mask of 16 cortical brain regions of interest for extracting mean CBF (16). Construction of pediatric templates and segmentation of brain tissue were performed by J.D. and B.A. (each with more than 5 years of experience).
Statistical Analysis
The reproducibility of pCASL CBF measurements in the whole brain, gray matter, and white matter, as well as in 16 representative brain regions was analyzed by computing the intraclass correlation coefficient (ICC) and within-subject coefficient of variation (wsCV) between two repeated examinations. Further, the accuracy was determined by computing the ICC between global CBF measurements obtained by using PC MR imaging with those of pCASL with and without in vivo blood T1 adjustment, respectively, with PC MR imaging used as the reference standard. The latter has previously been shown to yield accurate physiologic flow values (17). Additionally, CBF values were calculated by using blood T1 values predicted by a model by Wu et al (11) that was based on each subject’s age and sex. The distribution of differences between repeated measurements was examined for normality by using box plots and Shapiro-Wilk W test. If a distribution deviated from normal, the CV and ICC were computed based on log transformed data as outlined in Floyd et al (18).
Results
Test-Retest Repeatability
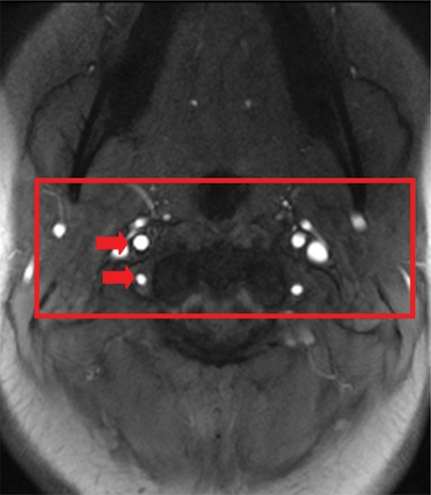
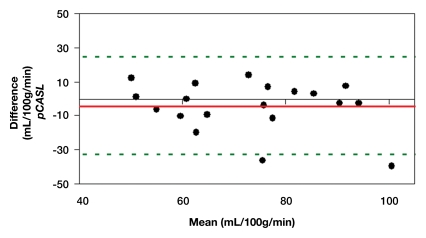
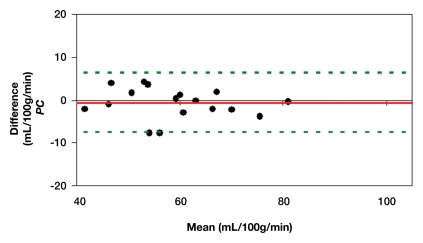
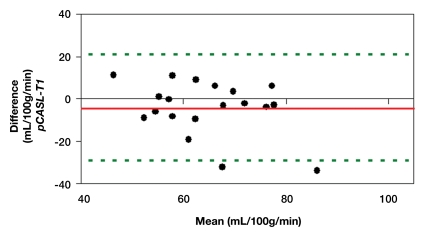
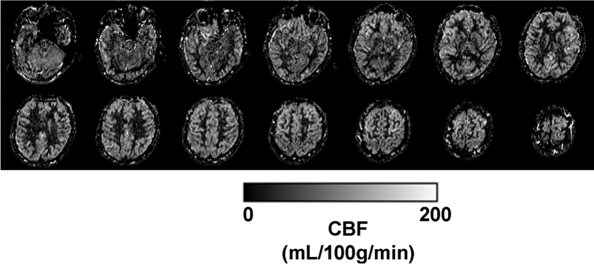
Representative magnitude and phase maps of PC MR imaging and pCASL CBF maps are shown in Figure 1. Owing to data quality issues, repeated pCASL and PC MR imaging studies in 18 (82%) of 22 participants were usable. The pCASL CBF measurements showed a moderate (ICC = 0.4–0.6) to good (ICC = 0.6–0.8) level of test-retest reproducibility between repeated studies acquired 2–4 weeks apart (Fig 2a). The computed ICC and wsCV of global CBF were 0.61 and 14.9%, respectively. As expected, PC MR imaging demonstrated higher test-retest reproducibility (ICC: 0.95; wsCV: 3.1%) (Fig 2b). However, after incorporating in vivo blood T1 measurements in the CBF calculation, the ICC of test-retest reproducibility decreased to 0.41, while the wsCV (14.8%) remained unchanged (Fig 2c).
Figure 1a:
(a) Magnitude image obtained at PC MR imaging in a 17-year-old subject highlights the internal carotid and vertebral arteries (arrows). (b) Corresponding velocity map of the arteries. The red box in a represents the section of the image zoomed in the velocity map. (c) Perfusion images obtained with pCASL in the same subject.
Figure 2a:
(a–c) Bland-Altman plots represent the test-retest agreement (longitudinal reproducibility) of (a) pCASL, (b) PC, and (c) T1-corrected pCASL whole-brain CBF measurements. Solid red and dotted green lines are the mean bias and limits of agreement (1.96× standard deviation), respectively.
Figure 2b:
(a–c) Bland-Altman plots represent the test-retest agreement (longitudinal reproducibility) of (a) pCASL, (b) PC, and (c) T1-corrected pCASL whole-brain CBF measurements. Solid red and dotted green lines are the mean bias and limits of agreement (1.96× standard deviation), respectively.
Figure 2c:
(a–c) Bland-Altman plots represent the test-retest agreement (longitudinal reproducibility) of (a) pCASL, (b) PC, and (c) T1-corrected pCASL whole-brain CBF measurements. Solid red and dotted green lines are the mean bias and limits of agreement (1.96× standard deviation), respectively.
Figure 1b:
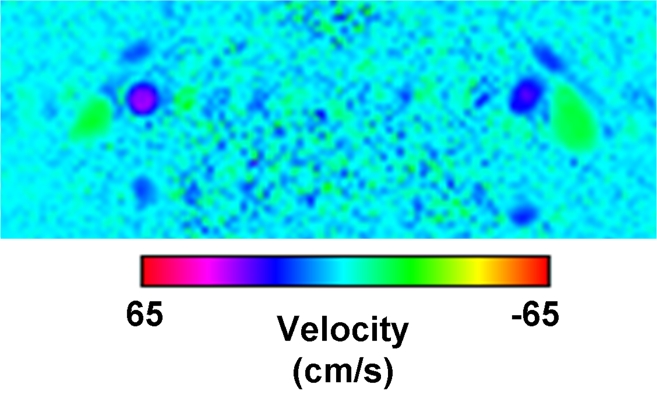
(a) Magnitude image obtained at PC MR imaging in a 17-year-old subject highlights the internal carotid and vertebral arteries (arrows). (b) Corresponding velocity map of the arteries. The red box in a represents the section of the image zoomed in the velocity map. (c) Perfusion images obtained with pCASL in the same subject.
Figure 1c:
(a) Magnitude image obtained at PC MR imaging in a 17-year-old subject highlights the internal carotid and vertebral arteries (arrows). (b) Corresponding velocity map of the arteries. The red box in a represents the section of the image zoomed in the velocity map. (c) Perfusion images obtained with pCASL in the same subject.
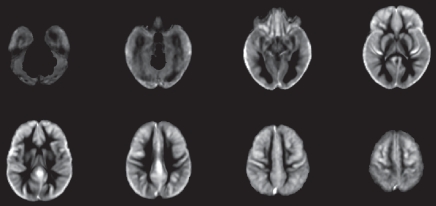
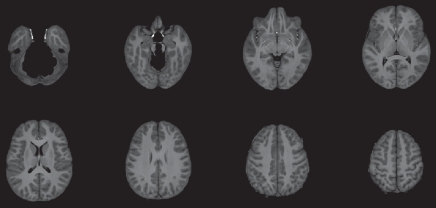
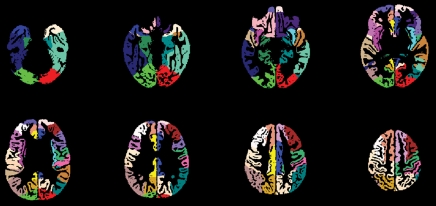
The CBF template constructed by using ANTS from the 22 children is shown in Figure 3a, along with the anatomic masks for cortical gray matter (Fig 3b, 3c). The high precision of diffeomorphic transformation by ANTS resulted in a pediatric perfusion template with high anatomic details. The test-retest results of mean CBF (by using assumed blood T1 of 1.65 second) in 16 regions of interest are listed in Table 1. The mean CBF values in gray matter demonstrated a good level of test-retest repeatability (ICC: 0.65, wsCV: 14.4%). However, the repeatability of mean CBF values in white matter was relatively poor (ICC: 0.29, wsCV: 22.9%). Across 16 regions of interest, the mean wsCV was 16.7% (range, 11.8%–22.7%) and mean ICC was 0.55 (range, 0.24–0.85). Aside from the four frontal regions of interest with ICCs of 0.4 or less, the rest of the 12 brain regions demonstrated moderate to good test-retest repeatability.
Figure 3a:
(a) Perfusion and (b) structural templates calculated by using data from all 22 subjects. (c) Cortical gray matter brain masks used for calculating structural/regional mean CBF.
Figure 3b:
(a) Perfusion and (b) structural templates calculated by using data from all 22 subjects. (c) Cortical gray matter brain masks used for calculating structural/regional mean CBF.
Figure 3c:
(a) Perfusion and (b) structural templates calculated by using data from all 22 subjects. (c) Cortical gray matter brain masks used for calculating structural/regional mean CBF.
Table 1.
Test-Retest Results of Mean CBF in 16 Cortical Regions of Interest and Gray and White Matter
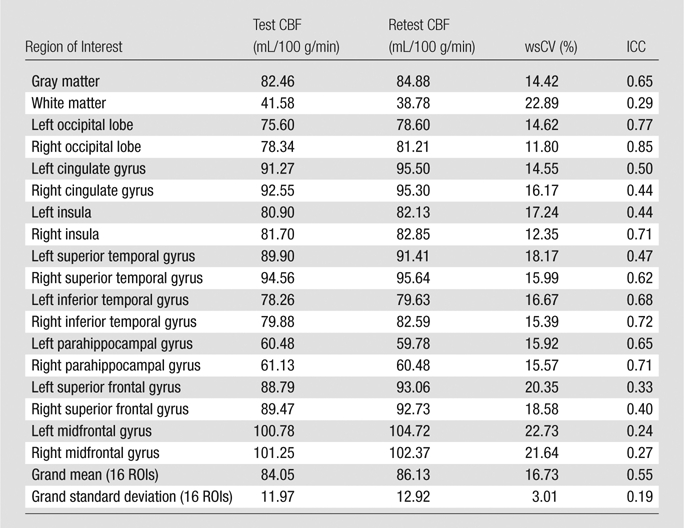
Note.—Test-retest results of mean CBF were obtained by using an assumed blood T1 of 1.65 second. ROI = region of interest.
Accuracy of pCASL against PC MR Imaging
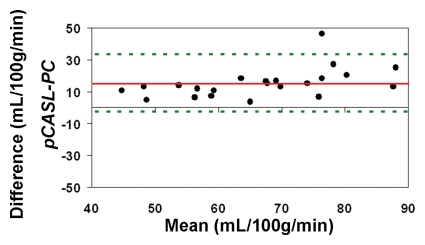
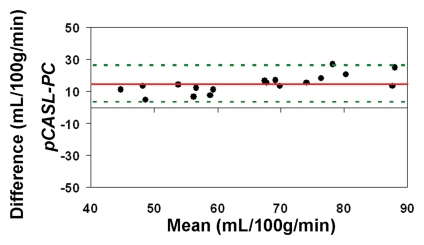
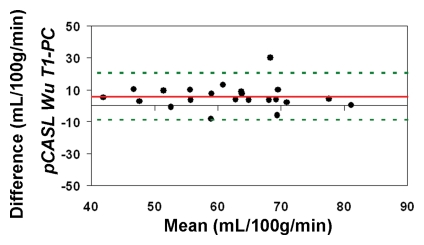
The average CBF in this cohort of healthy children between 7 and 17 years of age measured by using PC MR imaging and pCASL (with an assumed blood T1 of 1.65 second at 3 T) was 59 mL/100 g/min ± 11 and 74 mL/100 g/min ± 15, respectively (P < .001, paired t test). With CBF computed by using PC MR imaging as the reference standard, the pCASL CBF measurements demonstrated a low level of accuracy (Fig 4a). The ICC was 0.32 between pCASL and PC MR imaging global CBF measurements for all 22 participants. After excluding four subjects who had only a single measurement for either pCASL or PC MR imaging, the ICC increased to 0.49 (Fig 4b).
Figure 4a:
Bland-Altman plots show the agreement of pCASL whole-brain CBF measurements by using (a, b) default (1650 msec), (c, d) measured, and (e, f) Wu model–predicted blood T1 values with PC MR imaging. Data from all 22 subjects are shown in a, c, and e, and data from 18 subjects who underwent repeat imaging are shown in b, d, and f. Solid red and dotted green lines are the mean bias and limits of agreement (1.96 × standard deviation), respectively.
Figure 4b:
Bland-Altman plots show the agreement of pCASL whole-brain CBF measurements by using (a, b) default (1650 msec), (c, d) measured, and (e, f) Wu model–predicted blood T1 values with PC MR imaging. Data from all 22 subjects are shown in a, c, and e, and data from 18 subjects who underwent repeat imaging are shown in b, d, and f. Solid red and dotted green lines are the mean bias and limits of agreement (1.96 × standard deviation), respectively.
Figure 4d:
Bland-Altman plots show the agreement of pCASL whole-brain CBF measurements by using (a, b) default (1650 msec), (c, d) measured, and (e, f) Wu model–predicted blood T1 values with PC MR imaging. Data from all 22 subjects are shown in a, c, and e, and data from 18 subjects who underwent repeat imaging are shown in b, d, and f. Solid red and dotted green lines are the mean bias and limits of agreement (1.96 × standard deviation), respectively.
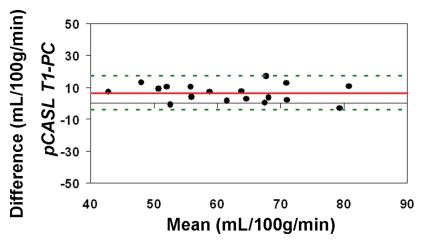
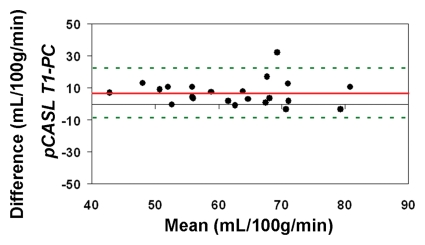
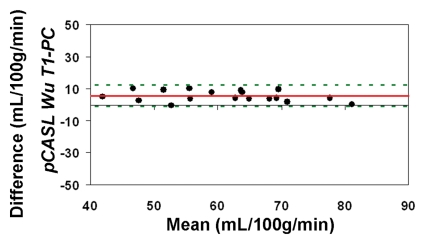
When using in vivo blood T1 measurements in the CBF calculation, the ICC between pCASL and PC MR imaging global CBF measurements improved to 0.58 and 0.73 for all 22 subjects and for the 18 participants with repeated examinations, respectively (Fig 4c, 4d). The mean calculated CBF with in vivo blood T1 measurements was 65 mL/100 g ± 10. The test-retest reproducibility and age dependence of in vivo blood T1 measurements have been demonstrated previously (wsCV = 4%, ICC = 0.55) (11). Furthermore, by using the blood T1 predicted by a population-based model derived by Wu et al (11) (T1 = 2115.6 − 21.5*age − 73.3*sex, where sex = 1 for males and 0 for females), the ICC compared with PC MR imaging increased to 0.65 and 0.84 for all 22 participants and for the 18 participants, respectively (Fig 4e, 4f). In general, pCASL CBF measurements with or without T1 correction were significantly correlated with PC MR imaging measurements (Table 2, R > 0.99; P < .0001).
Figure 4c:
Bland-Altman plots show the agreement of pCASL whole-brain CBF measurements by using (a, b) default (1650 msec), (c, d) measured, and (e, f) Wu model–predicted blood T1 values with PC MR imaging. Data from all 22 subjects are shown in a, c, and e, and data from 18 subjects who underwent repeat imaging are shown in b, d, and f. Solid red and dotted green lines are the mean bias and limits of agreement (1.96 × standard deviation), respectively.
Figure 4e:
Bland-Altman plots show the agreement of pCASL whole-brain CBF measurements by using (a, b) default (1650 msec), (c, d) measured, and (e, f) Wu model–predicted blood T1 values with PC MR imaging. Data from all 22 subjects are shown in a, c, and e, and data from 18 subjects who underwent repeat imaging are shown in b, d, and f. Solid red and dotted green lines are the mean bias and limits of agreement (1.96 × standard deviation), respectively.
Figure 4f:
Bland-Altman plots show the agreement of pCASL whole-brain CBF measurements by using (a, b) default (1650 msec), (c, d) measured, and (e, f) Wu model–predicted blood T1 values with PC MR imaging. Data from all 22 subjects are shown in a, c, and e, and data from 18 subjects who underwent repeat imaging are shown in b, d, and f. Solid red and dotted green lines are the mean bias and limits of agreement (1.96 × standard deviation), respectively.
Table 2.
Fitted Slope with 95% Confidence Intervals and Correlation Coefficients of Repeatability and Accuracy Assessments by Using a Linear Regression Model with Zero Intercept
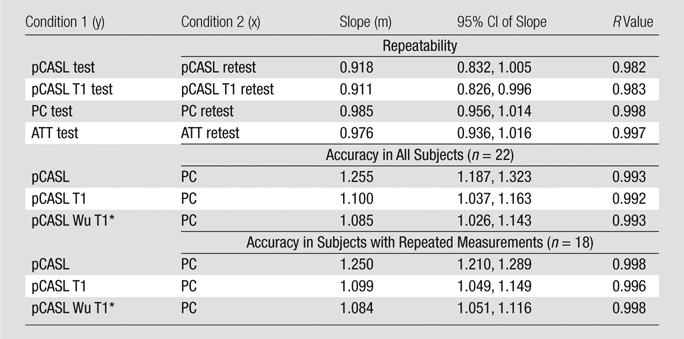
Note.—ATT = arterial transit time, CI = confidence interval.
Indicates the blood T1 predicted by a population-based model derived by Wu et al.
Arterial Transit Time
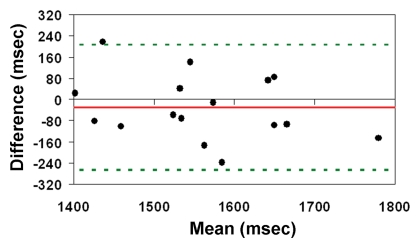
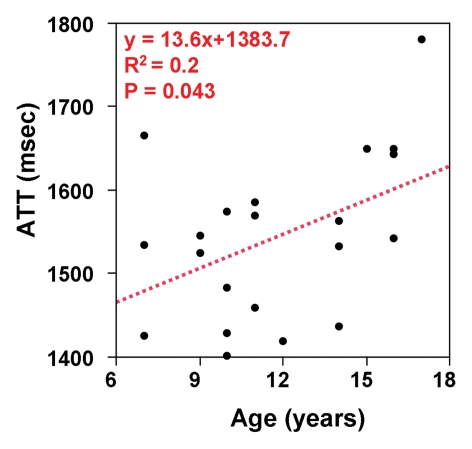
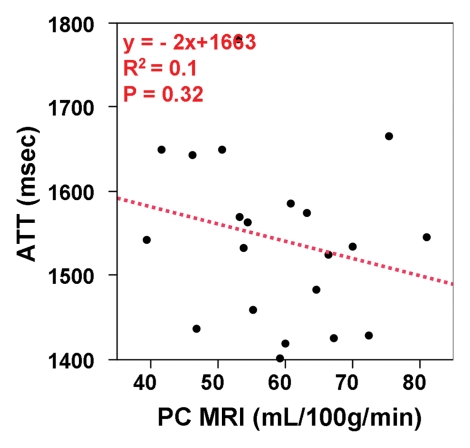
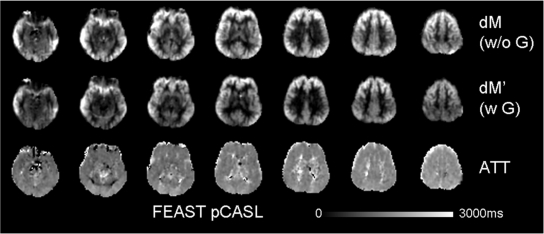
The mean arterial transit time for the labeled blood to reach microvasculature measured with FEAST was 1538 msec ± 123. The test-retest repeatability of arterial transit time measurements were an ICC of 0.48 and wsCV equal to 5.52% (Fig 5a). There was a trend of increasing arterial transit time with age (P = .043) (Fig 5b). Arterial transit time also demonstrated a negative association with blood flow volume by using PC MR imaging (P = .32). However, this negative association did not reach statistical significance (Fig 5c). Representative arterial transit time maps generated by using FEAST are shown in Figure 6. The in vivo measurements of arterial transit time justify the use of a constant postlabeling delay in our experiment (1.2–2.14 second from bottom to top section, with a mean of 1.68 second) to measure CBF by using pCASL.
Figure 5a:
(a) Bland-Altman plot of test-retest agreement of mean arterial transit time measurements. Solid red and dotted green lines are the mean bias and limits of agreement (1.96× standard deviation), respectively. (b, c) Scatterplots demonstrate the effect of (b) age and (c) PC-estimated CBF on arterial transit time (ATT).
Figure 5b:
(a) Bland-Altman plot of test-retest agreement of mean arterial transit time measurements. Solid red and dotted green lines are the mean bias and limits of agreement (1.96× standard deviation), respectively. (b, c) Scatterplots demonstrate the effect of (b) age and (c) PC-estimated CBF on arterial transit time (ATT).
Figure 5c:
(a) Bland-Altman plot of test-retest agreement of mean arterial transit time measurements. Solid red and dotted green lines are the mean bias and limits of agreement (1.96× standard deviation), respectively. (b, c) Scatterplots demonstrate the effect of (b) age and (c) PC-estimated CBF on arterial transit time (ATT).
Figure 6:
Images from the FEAST sequence obtained in a representative subject (9-year-old boy). Top and middle rows represent images acquired without and with diffusion-weighted gradients, respectively. The bottom row represents the calculated maps of arterial transit time (ATT).
Discussion
Our study demonstrated a moderate to good level of longitudinal repeatability of global and regional pCASL based CBF measurements in a normally developing cohort aged 7–17 years. With use of PC MR imaging as the reference standard of global blood flow, the accuracy of pCASL CBF measurements was improved by incorporating in vivo measurement of blood T1, and further by using a population-based estimate of blood T1 in CBF calculation. The mean arterial transit time measured by FEAST was 1.5 second in children 7–17 years of age and showed a trend of increasing value with age. The findings reported in our study are expected to provide a reference standard for future perfusion MR imaging studies in neurodevelopmental disorders.
In the present study, the longitudinal test-retest results of CBF measurements over the whole brain and in gray matter, as well as in 16 representative brain regions, were encouraging. The tagging efficiency (85%) of pCASL has been shown to be robust by theoretical calculations within a flow velocity range from 20 to 80 cm/sec and is well preserved when the field inhomogeneity is within 3 ppm at 3 T (8,9). Compared with past studies investigating the longitudinal reproducibility of ASL-based perfusion quantification in adults (14,18–21), our study demonstrated that a similar level of longitudinal repeatability can be achieved by using pCASL perfusion MR imaging in healthy children aged 7–17 years. In this work we also tested the accuracy of pCASL-based global CBF quantification by comparing it with PC MR imaging. PC MR imaging is a fast, simple, yet highly reliable technique to measure global blood flow volume and has been previously used by Aslan et al (22) as the reference standard to validate pCASL perfusion measurements in adults. Our results demonstrated that incorporating in vivo measurement of venous blood T1 in CBF calculation increased the accuracy of pCASL CBF measurements. Furthermore, by using a population-based estimate of blood T1 as predicted by the Wu et al model (11) further increased the accuracy of pCASL CBF measurements. As an important parameter determining the tracer half-life in ASL, it has been shown that blood T1 decreases with age as a whole and is higher in female than in male subjects, consistent with expected developmental changes and sex differences (after puberty) in human hematocrit level (11). Our results suggest that the accuracy of pCASL CBF measurements in children is sensitive to developmental changes of blood T1 and may cause overestimation of CBF if adult parameters were assumed.
Another important physiologic parameter in ASL perfusion quantification is the arterial transit time, defined as the time taken for the labeled blood to reach microvasculature. By using FEAST, we observed a trend toward an increase in arterial transit time with age. This observation is consistent with known ultrasonography studies on carotid flow velocity changes with age as well as with our own PC MR imaging measurements (23). In the present study, a constant postlabeling delay (1.2–2.14 seconds from bottom to top section, with a mean of 1.68 second) was used that was justified by the measured mean arterial transit time of 1538 msec ± 123 in the cohort of children and adolescents. However, the postlabeling delay was shorter than the arterial transit time in two children. After incorporating in vivo measurements of arterial transit time in CBF quantification in these two children, both repeatability and accuracy did not change significantly.
This study had several limitations. First, venous, instead of arterial, blood T1 values were used for CBF calculation. The former is known to have a shorter blood T1 (12), which could partly explain the slight overestimation of pCASL perfusion values even after T1 correction. In the future, in vivo measurement of arterial blood T1 should be used once the technique becomes available. Another caveat of the present study is that in vivo measurement of blood T1 may have its own variability which caused a slight decrease of test-retest repeatability of pCASL CBF measurements. The use of blood T1 values predicted by the Wu et al model based on individual subject’s age and sex provides an optimal solution for balancing the accuracy and longitudinal repeatability of pCASL CBF measurements in the pediatric population. Nevertheless, for children with neurologic or systemic diseases that affect blood T1 (eg, sickle cell disease), an in vivo measurement of blood T1 is still preferable. It should also be noted that our study was conducted at 3 T, whereas a large portion of clinical imagers perform at a lower 1.5-T field. Higher magnetic field strength is naturally advantageous for ASL as it provides not only increased signal-to-noise ratio but also prolonged tracer half-life due to increases in T1. It is plausible that the observed levels of longitudinal repeatability and accuracy might decrease at 1.5 T.
For future applications of pCASL perfusion MR imaging to study neurodevelopmental disorders, it is recommended that PC MR imaging and in vivo measurement of blood T1 be included as part of the imaging protocol. Both acquisitions are short (1 minute for each) and are expected to improve the longitudinal repeatability and accuracy of CBF measurements in children. Regarding other physiologic parameters such as the T2 of blood, T1 and T2 of brain tissue, and the equilibrium blood magnetization (M0blood), past theoretical analyses and experimental data have shown that their effects on CBF quantification are relatively small with negligible differences compared with CBF calculated by using the standard model used in the our study (24,25). Future perfusion MR imaging studies should also be performed in infants and toddlers younger than 6 years of age as there is a large knowledge gap on the development of brain function and physiology in this population.
In conclusion, our study demonstrated a moderate to good level of repeatability and accuracy of pCASL perfusion MR imaging in typical developing children aged 7–17 years, taking into account age-related variations in several key physiologic parameters. The noninvasive nature, accuracy, and longitudinal repeatability of pCASL perfusion MR imaging should facilitate its use in neurodevelopmental studies.
Advances in Knowledge.
• Cerebral blood flow (CBF) measurements with use of pseudo-continuous arterial spin labeling (pCASL) provide a moderate to good level of longitudinal repeatability in typically developing children 7–17 years of age.
• The accuracy of pCASL CBF measurements improves by incorporating developmental changes of blood T1 in pediatric populations.
• The mean arterial transit time is 1.5 second in children aged 7–17 years and shows a trend of increasing arterial transit time with age.
Implication for Patient Care.
• Our results provide a reference for future applications of pCASL perfusion MR imaging in children with neurodevelopmental disorders.
Disclosures of Potential Conflicts of Interest: V.J. No potential conflicts of interest to disclose. J.D. No potential conflicts of interest to disclose. B.A. No potential conflicts of interest to disclose. M.G. No potential conflicts of interest to disclose. S.X.X. No potential conflicts of interest to disclose. T.R. Financial activities related to the present article: none to disclose. Financial activities not related to the present article: consultancy for Prism Clinical Imaging (no overlap). Other relationships: stock/stock options in Prism Clinical Imaging (no overlap). J.A.D. Financial activities related to the present article: none to disclose. Financial activities not related to the present article: Consultancy for Alzheimer’s Disease Neuroimaging Initiative (Pfizer), NIH and Pfizer funding for research involving ASL MR imaging, inventor on University of Pennsylvania’s patent for ASL MRI and entitled to institutional royalty sharing. Other relationships: none to disclose. H.H. No potential conflicts of interest to disclose. F.W.W. No potential conflicts of interest to disclose. D.J.J.W. No potential conflicts of interest to disclose.
Received July 18, 2011; revision requested September 20; revision received November 15; accepted December 7; final version accepted December 14.
Supported by the American Recovery and Reinvestment Act (grant MH080892-S1).
Funding: This research was supported by the National Institutes of Health (grant R01-MH080892) and National Institute of Child Health and Human Development Pediatric Functional Neuroimaging Research Network (HHSN275200900018C).
Abbreviations:
- ASL
- arterial spin labeling
- CBF
- cerebral blood flow
- FEAST
- flow-encoding arterial spin tagging
- ICC
- intraclass correlation coefficient
- PC
- phase contrast
- pCASL
- pseudo-continuous ASL
- wsCV
- within-subject coefficient of variation
References
- 1.Detre JA, Leigh JS, Williams DS, Koretsky AP. Perfusion imaging. Magn Reson Med 1992;23(1):37–45 [DOI] [PubMed] [Google Scholar]
- 2.Miller B, Nagy D, Finlay BL, Chance B, Kobayashi A, Nioka S. Consequences of reduced cerebral blood flow in brain development. I. Gross morphology, histology, and callosal connectivity. Exp Neurol 1993;124(2):326–342 [DOI] [PubMed] [Google Scholar]
- 3.Wang J, Licht DJ. Pediatric perfusion MR imaging using arterial spin labeling. Neuroimaging Clin N Am 2006;16(1):149–167, ix. [DOI] [PubMed] [Google Scholar]
- 4.Wang J, Licht DJ, Jahng GH, et al. Pediatric perfusion imaging using pulsed arterial spin labeling. J Magn Reson Imaging 2003;18(4):404–413 [DOI] [PubMed] [Google Scholar]
- 5.Wang J, Rao H, Detre JA. Arterial spin labeling perfusion MRI in developmental neuroscience. In: Rumsey JM, Ernst M, eds. Neuroimging in developmental clinical neuroscience. Cambridge, Mass: Cambridge University Press, 2009; 326–343 [Google Scholar]
- 6.Taki Y, Hashizume H, Sassa Y, et al. Correlation between gray matter density-adjusted brain perfusion and age using brain MR images of 202 healthy children. Hum Brain Mapp 2011;32(11):1973–1985 [DOI] [PMC free article] [PubMed] [Google Scholar]
- 7.Biagi L, Abbruzzese A, Bianchi MC, Alsop DC, Del Guerra A, Tosetti M. Age dependence of cerebral perfusion assessed by magnetic resonance continuous arterial spin labeling. J Magn Reson Imaging 2007;25(4):696–702 [DOI] [PubMed] [Google Scholar]
- 8.Dai W, Garcia D, de Bazelaire C, Alsop DC. Continuous flow-driven inversion for arterial spin labeling using pulsed radio frequency and gradient fields. Magn Reson Med 2008;60(6):1488–1497 [DOI] [PMC free article] [PubMed] [Google Scholar]
- 9.Wu WC, Fernández-Seara M, Detre JA, Wehrli FW, Wang J. A theoretical and experimental investigation of the tagging efficiency of pseudocontinuous arterial spin labeling. Magn Reson Med 2007;58(5):1020–1027 [DOI] [PubMed] [Google Scholar]
- 10.Wang J, Alsop DC, Song HK, et al. Arterial transit time imaging with flow encoding arterial spin tagging (FEAST). Magn Reson Med 2003;50(3):599–607 [DOI] [PubMed] [Google Scholar]
- 11.Wu WC, Jain V, Li C, et al. In vivo venous blood T1 measurement using inversion recovery true-FISP in children and adults. Magn Reson Med 2010;64(4):1140–1147 [DOI] [PMC free article] [PubMed] [Google Scholar]
- 12.Lu H, Clingman C, Golay X, van Zijl PC. Determining the longitudinal relaxation time (T1) of blood at 3.0 Tesla. Magn Reson Med 2004;52(3):679–682 [DOI] [PubMed] [Google Scholar]
- 13.Herscovitch P, Raichle ME. What is the correct value for the brain: blood partition coefficient for water? J Cereb Blood Flow Metab 1985;5(1):65–69 [DOI] [PubMed] [Google Scholar]
- 14.Chen Y, Wang DJ, Detre JA. Test-retest reliability of arterial spin labeling with common labeling strategies. J Magn Reson Imaging 2011;33(4):940–949 [DOI] [PMC free article] [PubMed] [Google Scholar]
- 15.Avants BB, Epstein CL, Grossman M, Gee JC. Symmetric diffeomorphic image registration with cross-correlation: evaluating automated labeling of elderly and neurodegenerative brain. Med Image Anal 2008;12(1):26–41 [DOI] [PMC free article] [PubMed] [Google Scholar]
- 16.Avants BB, Tustison NJ, Song G, Cook PA, Klein A, Gee JC. A reproducible evaluation of ANTs similarity metric performance in brain image registration. Neuroimage 2011;54(3):2033–2044 [DOI] [PMC free article] [PubMed] [Google Scholar]
- 17.Mostbeck GH, Caputo GR, Higgins CB. MR measurement of blood flow in the cardiovascular system. AJR Am J Roentgenol 1992;159(3):453–461 [DOI] [PubMed] [Google Scholar]
- 18.Floyd TF, Ratcliffe SJ, Wang J, Resch B, Detre JA. Precision of the CASL-perfusion MRI technique for the measurement of cerebral blood flow in whole brain and vascular territories. J Magn Reson Imaging 2003;18(6):649–655 [DOI] [PubMed] [Google Scholar]
- 19.Parkes LM, Rashid W, Chard DT, Tofts PS. Normal cerebral perfusion measurements using arterial spin labeling: reproducibility, stability, and age and gender effects. Magn Reson Med 2004;51(4):736–743 [DOI] [PubMed] [Google Scholar]
- 20.Wang Y, Saykin AJ, Pfeuffer J, et al. Regional reproducibility of pulsed arterial spin labeling perfusion imaging at 3T. Neuroimage 2011;54(2):1188–1195 [DOI] [PMC free article] [PubMed] [Google Scholar]
- 21.Jiang L, Kim M, Chodkowski B, et al. Reliability and reproducibility of perfusion MRI in cognitively normal subjects. Magn Reson Imaging 2010;28(9):1283–1289 [DOI] [PMC free article] [PubMed] [Google Scholar]
- 22.Aslan S, Xu F, Wang PL, et al. Estimation of labeling efficiency in pseudocontinuous arterial spin labeling. Magn Reson Med 2010;63(3):765–771 [DOI] [PMC free article] [PubMed] [Google Scholar]
- 23.Schöning M, Staab M, Walter J, Niemann G. Transcranial color duplex sonography in childhood and adolescence. Age dependence of flow velocities and waveform parameters. Stroke 1993;24(9):1305–1309 [DOI] [PubMed] [Google Scholar]
- 24.Wu WC, St Lawrence KS, Licht DJ, Wang DJ. Quantification issues in arterial spin labeling perfusion magnetic resonance imaging. Top Magn Reson Imaging 2010;21(2):65–73 [DOI] [PubMed] [Google Scholar]
- 25.Chen Y, Wang Z, Detre JA. Impact of equilibrium magnetization of blood on ASL quantification [abstr]. In: Proceedings of the Nineteenth Meeting of the International Society for Magnetic Resonance in Medicine. Berkeley, Calif: International Society for Magnetic Resonance in Medicine, 2011; 300 [Google Scholar]


