We found that it is possible to assess in vivo the grade of ductal carcinoma in situ by using dynamic contrast-enhanced and diffusion-weighted imaging features on breast MR images.
Abstract
Purpose:
To develop a model incorporating dynamic contrast material–enhanced (DCE) and diffusion-weighted (DW) magnetic resonance (MR) imaging features to differentiate high-nuclear-grade (HNG) from non-HNG ductal carcinoma in situ (DCIS) in vivo.
Materials and Methods:
This HIPAA-compliant study was approved by the institutional review board and requirement for informed consent was waived. A total of 55 pure DCIS lesions (19 HNG, 36 non-HNG) in 52 women who underwent breast MR imaging at 1.5 T with both DCE and DW imaging (b = 0 and 600 sec/mm2) were retrospectively reviewed. The following lesion characteristics were recorded or measured: DCE morphology, DCE maximum lesion size, peak initial enhancement at 90 seconds, worst-curve delayed enhancement kinetics, apparent diffusion coefficient (ADC), contrast-to-noise ratio (CNR) at DW imaging with b values of 0 and 600 sec/mm2, and T2 signal effects (measured with CNR at b = 0 sec/mm2). Univariate and stepwise multivariate logistic regression modeling was performed to identify MR imaging features that optimally discriminated HNG from non-HNG DCIS. Discriminative abilities of models were compared by using the area under the receiver operating characteristic curve (AUC).
Results:
HNG lesions exhibited larger mean maximum lesion size (P = .02) and lower mean CNR for images with b value of 600 sec/mm2 (P = .004), allowing discrimination of HNG from non-HNG DCIS (AUC = 0.71 for maximum lesion size, AUC = 0.70 for CNR at b = 600 sec/mm2). Differences in CNR for images with b value of 0 sec/mm2 (P = .025) without corresponding differences in ADC values were observed between HNG and non-HNG lesions. Peak initial enhancement was the only kinetic variable to approach significance (P = .05). No differences in lesion morphology (P = .11) or worst-curve delayed enhancement kinetics (P = .97) were observed. A multivariate model combining CNR for images with b value of 600 sec/mm2 and maximum lesion size most significantly discriminated HNG from non-HNG (AUC = 0.81).
Conclusion:
The preliminary findings suggest that DCE and DW MR imaging features may aid in identifying patients with high-risk DCIS. Further study may yield a model combining MR characteristics with histopathologic data to facilitate lesion-specific targeted therapies.
© RSNA, 2012
Introduction
Ductal carcinoma in situ (DCIS) of the breast is a preinvasive neoplasm encompassing a broad spectrum of disease, ranging from clinically quiescent to aggressive precursor of invasive breast cancer. With use of more widespread screening mammography (1), there is clear evidence that the incidence of DCIS has increased since the early 1980s. This increased detection is associated with both benefits and potential harms for patients. Although the survival of the treated DCIS patients approaches 100% (2), there are concerns that many women undergo unnecessary surgery and radiation treatment for disease that would not progress or adversely impact the patient’s health if left untreated. These concerns regarding potential breast cancer overtreatment, in particular for patients with DCIS, have received substantial attention from the Institute of Medicine, the National Institutes of Health, and the recent United States Preventive Services Task Force in their guidelines for breast cancer screening (3). Recently, a National Institutes of Health panel of experts concluded that there is a critical need to “identify MRI [magnetic resonance imaging] features that can be combined with clinical and biological characteristics to better stratify risk in patients who have DCIS” (4).
Pathologically, high-nuclear-grade (HNG) DCIS correlates with a greater risk of progression to invasive disease and local recurrence (5,6) than its non-HNG counterpart. While dynamic contrast material–enhanced (DCE) MR imaging more accurately depicts DCIS than does mammography (7,8), attempts to differentiate the grade of DCIS with DCE MR imaging have yielded mixed results. Several prior investigations have shown that HNG DCIS is more visible on DCE MR images than non-HNG DCIS (9–11). However, Jansen et al (12) demonstrated no significant differences in kinetic or morphologic features among DCIS grades.
Diffusion-weighted (DW) imaging is a nonenhanced MR technique that reflects the microstructural properties of tissue, such as cell density and membrane integrity. By assessing water mobility, DW imaging assesses distinct tissue properties compared with DCE imaging. In support of this concept, multiple studies have demonstrated promise for DW imaging as an adjunct to DCE imaging for breast lesion characterization (13–15). DCIS has recently been characterized on DW images, demonstrating that HNG and non-HNG DCIS lesions exhibit different signal intensities on DW images (16). A recent pilot study has also suggested that DCIS grades may exhibit differences in apparent diffusion coefficient (ADC) values on DW images (17). These compelling preliminary findings suggest that multiparametric MR imaging features may serve as biomarkers for DCIS grade assessment. The aim of this study was to develop a model incorporating DCE MR imaging and DW variables to differentiate HNG from non-HNG DCIS in vivo.
Materials and Methods
Patient Population
The protocol for this study was approved by our institutional review board and was compliant with the Health Insurance Portability and Accountability Act. Because of the retrospective nature of the study, requirements for informed consent were waived. A review of our MR imaging database was performed to identify eligible patients who underwent breast MR imaging from October 7, 2005 to June 7, 2008. The entire patient cohort for this study was included in a previously published article evaluating the DW imaging characteristics of DCIS (16); this cohort differed in that DCE data including synopses of automatically generated computer-aided evaluation kinetics were required for inclusion.
Inclusion and Exclusion Criteria
Patients with a pathologic diagnosis of pure DCIS (DCIS without foci of invasive disease, confirmed on lumpectomy or mastectomy specimens) who underwent a clinical breast MR imaging that included both DCE and DW sequences were included. Breast MR imaging was performed either before or after the initial diagnosis of DCIS but prior to definitive surgical therapy.
Ninety-six distinct pathologically proved pure DCIS lesions in 87 women were identified as meeting inclusion criteria. Sixteen lesions in 13 women were excluded due to absence of suspicious enhancement (10 lesions) or obscuration due to biopsy changes (hematomas or seromas, six lesions) on postbiopsy DCE images. Nineteen lesions in 17 patients were excluded due lack of synopses of automatically generated computer-aided evaluation kinetics. Synopses of automated kinetics were generated with computer-aided evaluation software (CADstream; Merge Healthcare, Chicago, Ill) for lesions that demonstrated initial enhancement above a minimum threshold of 50% or greater increase in pixel signal intensity. Therefore, 61 lesions in 57 women were eligible for the study.
Of the 61 potential pure DCIS lesions identified for the study, six lesions in five women were excluded due to substantial misregistration artifact on DW images due to patient motion and/or eddy current-induced distortions (described below). Thus, the final cohort included 55 distinct pure DCIS lesions in 52 women.
MR Imaging Acquisition
All MR imaging examinations were performed with a 1.5-T imager (GE Signa HD; GE Healthcare, Waukesha, Wis) by using a dedicated eight-channel bilateral breast coil. The images were acquired in axial orientation and included T2-weighted fast spin-echo, T1-weighted non–fat-suppressed, T1-weighted fat-suppressed DCE before and after contrast material administration, and DW sequences.
The DCE MR imaging protocol follows guidelines established by the American College of Radiology breast MR imaging accreditation program (18). DCE MR imaging was performed by using T1-weighted three-dimensional fast spoiled gradient-recalled echo sequence with parallel imaging (VIBRANT; GE Healthcare) with repetition time msec/echo time msec of 6.2/3, flip angle of 10°, and field of view of 32–38 cm. For optimal field homogeneity, separate volume shimming was performed on each breast prior to imaging. From October 2005 through June 2006, the images were obtained with 2.2-mm section thickness, 350 × 350 acquisition matrix, and five postcontrast acquisitions centered at 90, 180, 270, 360, and 450 seconds. From July 2006 through June 2008, the images were obtained with 1.6-mm section thickness, 420 × 420 acquisition matrix, and three postcontrast acquisitions centered at 90, 270, and 450 seconds. The contrast agent was 0.1 mmol per kilogram of body weight gadodiamide (Omniscan; GE Healthcare).
DW imaging was performed after DCE MR imaging by using an echo-planar imaging sequence with parallel imaging (reduction factor of two, 7000/71.5, three signals acquired, acquisition matrix of 192 × 192, 36-cm field of view, 5-mm section thickness, gap of 0. DW imaging was performed with b values of 0 and 600 sec/mm2 (applied in six independent directions). Total DW imaging time was 160 seconds.
Image Interpretation
DCE MR images were prospectively interpreted by four fellowship-trained radiologists specialized in breast imaging, ranging from 3 to 13 years of experience at the times of interpretations. Each lesion was assessed by using the American College of Radiology Breast Imaging Reporting and Data System (BI-RADS) lexicon incorporating morphologic and kinetic features (19). Lesion size and location, features of computer-aided evaluation kinetics, and BI-RADS assessment and recommendation were recorded at the time of interpretation. Two computer-aided evaluation kinetic features previously shown to have diagnostic value were recorded (20,21): peak initial enhancement (greatest percentage of signal intensity increase at first contrast-enhanced sequence with k space centered at 90 seconds) and worst-curve delayed phase enhancement categorized by the single most suspicious curve type (any washout > any plateau > any persistent). This information was entered into our clinical database and then later extracted for the purpose of this study.
All DW imaging analyses were performed retrospectively offline by a breast imaging fellow with 1 year of breast imaging experience. All lesions were identified on DW images based on prior DCE MR imaging findings. ADC maps and directionally averaged DW images were calculated by the fellow, who was trained in the use of image-processing tools: in-house JAVA-based software incorporating ImageJ (National Institutes of Health, public domain) and JDTI (Daniel P. Barboriak Laboratory, Duke University School of Medicine, Durham, NC) (22). Each DW sequence was visually inspected for substantial motion by comparing images with b value of 0 sec/mm2 with images with b value of 600 sec/mm2 for substantial misregistration. Regions of interest were drawn on the averaged images with b value of 600 sec/mm2 for the lesion and for normal nonadipose fibroglandular breast tissue in the contralateral breast. These regions of interest were then propagated onto the T2-weighted images with b value of 0 sec/mm2 and ADC maps. Mean signal intensity of DW images (b = 0 and 600 sec/mm2) and ADC values were calculated and recorded for each lesion and normal breast tissue. A contrast-to-noise ratio (CNR) between each lesion and normal tissue on DW images was calculated as described previously (23):
 |
where μlesion and μtissue are the mean DW signal intensities for DCIS and normal-tissue regions of interest, respectively, and σlesion and σtissue are the corresponding region-of-interest standard deviations. A CNR greater than 0 for image with b value of 600 sec/mm2 indicates higher DW signal intensity on the image in a lesion versus normal tissue. T2 measures were approximated for each lesion from the images with b value of 0 sec/mm2 by calculating the CNR utilizing the Equation. The images with b value of 0 sec/mm2 were used to calculate T2 relaxation properties rather than the conventional T2-weighted fast spin-echo images to ensure accurate registration between the images with b value of 600 sec/mm2 and T2-weighted measures.
Clinical Data
Pathology reports were reviewed to confirm the final worst pathologic diagnosis for each lesion, specifically assessing for upgrade to higher nuclear grade DCIS or invasive disease at final surgery. These reports were also reviewed to record DCIS grade and presence of necrosis. The patient age at the time of breast MR imaging and the clinical indications for breast MR imaging were also recorded.
Statistical Analysis
Mean CNR for images with b values of 0 and 600 sec/mm2, ADC, maximum lesion size, and peak initial enhancement were calculated for all lesions, as well as for HNG versus non-HNG DCIS. Differences in these MR imaging features and associations of DCE morphology (mass vs non–mass-like enhancement) and worst-curve delayed enhancement kinetics (washout, plateau, or persistent) between DCIS grades were assessed with logistic regression analysis. To investigate the influence of T2 shine-through on CNR calculations for images with b value of 600 sec/mm2, the correlation between that CNR and T2-weighted CNR measures for images with b value of 0 sec/mm2 was calculated. Univariate and stepwise multivariate logistic regression modeling was performed to identify DCE and DW features that optimally discriminated HNG from non-HNG DCIS, and the discriminative abilities of models were compared by using areas under the receiver operating characteristic (ROC) curve (AUCs). All computations were performed with SAS software (version 9.2; SAS, Cary, NC). ROC curve analysis was performed by using MedCalc software (version 11.5.1.0; Mariakerke, Belgium). For all analyses, P <.05 was considered to indicate a significant difference.
Results
The mean age of the patients was 55 years ± 13(standard deviation). The majority of patients presented for breast MR imaging for evaluation of the extent of disease for newly diagnosed biopsy-proved cancer (45 of 52, 86.5%). The remaining indications were for high-risk screening (four of 52, 7.7%), problem-solving (two of 52, 3.8%), and short-interval follow-up of a previously seen MR finding (one of 52, 1.9%). The majority of DCIS lesions manifested as non–mass-like enhancement (42 of 55) on DCE MR images, while 12 manifested as masses and one as a focus. On DCE MR images, the average maximum lesion size for all DCIS lesions was 29.3 mm ± 21.3, the mean peak initial enhancement was 167.2% ± 107.7, and 69% (38 of 55) of lesions demonstrated delayed washout. On DW images, the mean ADC value was 1.5 × 10⁻³ mm2/sec ± 0.2; the mean CNR for images with b value of 0 sec/mm2 was 2.2 ± 3 and that for all DCIS lesions was 0.6 ± 1.4. The CNR measures for DW images with b value of 0 and 600 sec/mm2 were significantly correlated (r = 0.77, P <.001).
Features of HNG and Non-HNG DCIS on DW and DCE MR Images
On DW images with b of 600 sec/mm2, HNG lesions exhibited a lower mean CNR (0.71 ± 4.0) than did non-HNG lesions (2.9 ± 1.72, P = .004) (Table 1). However, there was no significant difference (P = .48) in the mean ADC between HNG and non-HNG DCIS. On DW images with b of 0 sec/mm2 there were significant differences (P = .025) in the mean CNR between HNG (0.07 ± 1.53) and non-HNG (0.92 ± 1.2) DCIS. On DCE images, HNG lesions demonstrated a larger mean maximum lesion size (P = .02), averaging 15 mm larger than the size of non-HNG lesions. Of the kinetic features examined, only peak initial enhancement approached significance (P = .05), with HNG DCIS demonstrating a trend of higher peak initial enhancement than non-HNG DCIS.
Table 1.
DCIS Lesion Characteristics: DW Imaging and DCE

Note.—Unless otherwise indicated, data are means ± standard deviation.
Computed with univariate logistic regression.
There was no significant difference in lesion morphology based on DCIS grade (P = .11), although it was observed that 83% (10 of 12) of DCIS mass lesions were non-HNG (Table 2). There was also no difference in worst-curve delayed enhancement kinetics, which were similarly distributed between HNG and non-HNG lesions (P = .97). Examples of non-HNG and HNG lesions with DCE and DW features are provided in Figures 1 and 2, respectively.
Table 2.
DCIS Lesion Characteristics: DCE Morphology and DCE Worst-Curve Delayed Enhancement Kinetics

Data are number of lesions, with percentages in parentheses.
Computed with univariate logistic regression.
Single case of focus was excluded for the purpose of morphologic analysis.
Figure 1a:
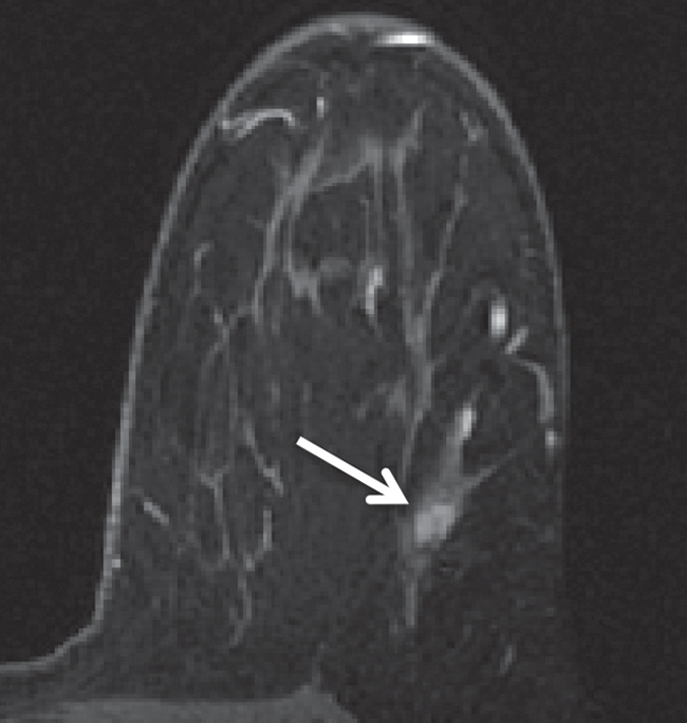
Non-HNG DCIS lesion on (a, b) DCE and (c, d) DW (b = 600 sec/mm2) MR images in 42-year-old woman. (a) T1-weighted fat-suppressed image shows 9-mm focal area (arrow) of non–mass-like enhancement. (b) The lesion demonstrates 178% peak initial enhancement with areas of delayed washout (red), persistent (blue), and plateau (green) kinetic features. (c) The lesion demonstrates high signal intensity (arrow), with a calculated CNR of 2.655. (d) On ADC map the lesion demonstrates low signal intensity (arrow), with a mean ADC value of 1.28 × 10⁻³ mm2/sec.
Figure 2a:
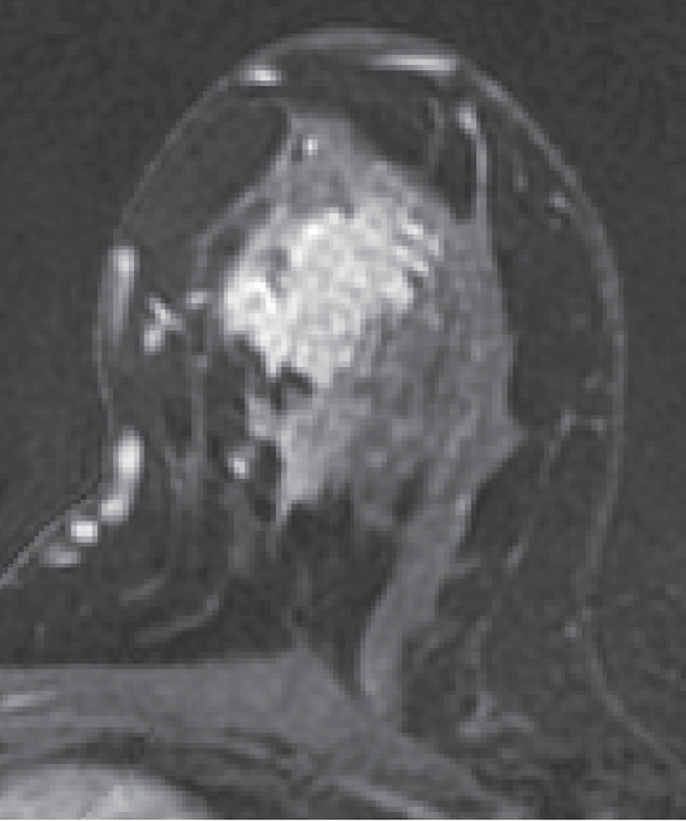
HNG DCIS lesion on (a, b) DCE and (c, d) DW (b = 600 sec/mm2) MR images in 37-year-old woman. (a) T1-weighted fat-suppressed image shows 51-mm mass. (b) The mass demonstrates 146% peak initial enhancement with areas of delayed washout (red), persistent (blue), and plateau (green) kinetic features. (c) The lesion demonstrated high signal intensity, with a calculated CNR of 2.35. (d) On ADC map the lesion demonstrates low signal intensity, with a mean ADC value of 1.45 × 10⁻³ mm2/sec.
Figure 1b:
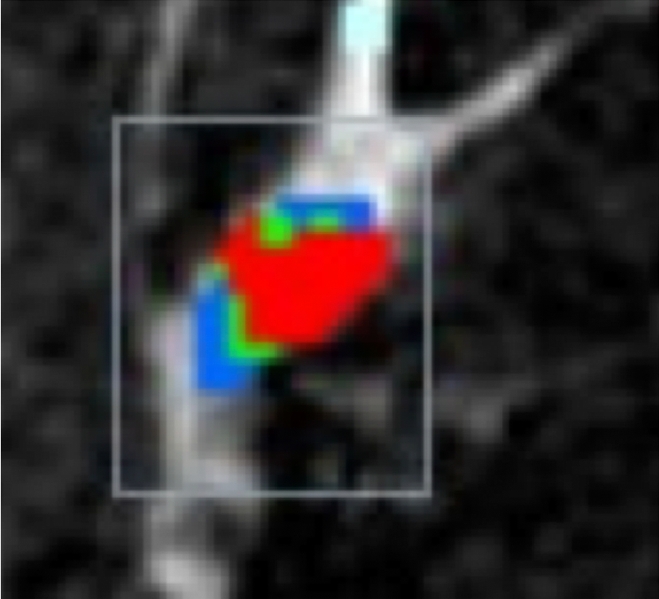
Non-HNG DCIS lesion on (a, b) DCE and (c, d) DW (b = 600 sec/mm2) MR images in 42-year-old woman. (a) T1-weighted fat-suppressed image shows 9-mm focal area (arrow) of non–mass-like enhancement. (b) The lesion demonstrates 178% peak initial enhancement with areas of delayed washout (red), persistent (blue), and plateau (green) kinetic features. (c) The lesion demonstrates high signal intensity (arrow), with a calculated CNR of 2.655. (d) On ADC map the lesion demonstrates low signal intensity (arrow), with a mean ADC value of 1.28 × 10⁻³ mm2/sec.
Figure 1c:
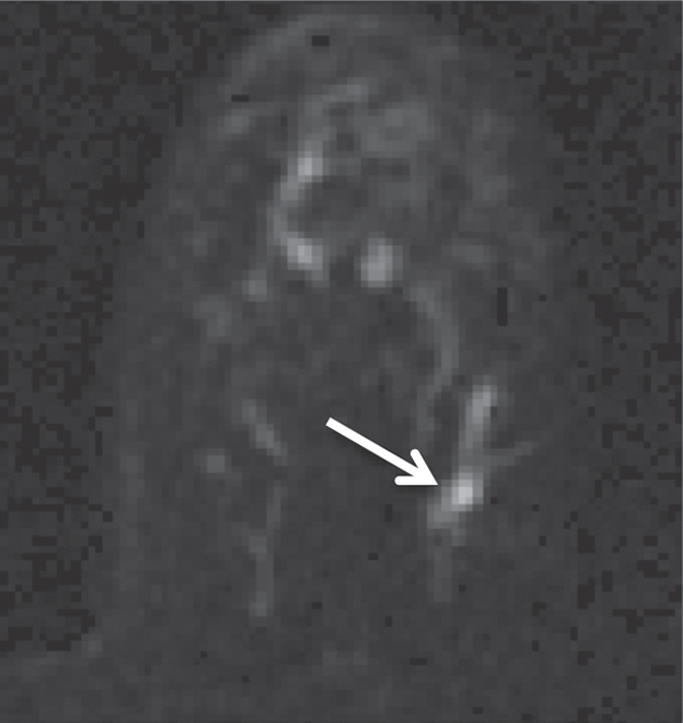
Non-HNG DCIS lesion on (a, b) DCE and (c, d) DW (b = 600 sec/mm2) MR images in 42-year-old woman. (a) T1-weighted fat-suppressed image shows 9-mm focal area (arrow) of non–mass-like enhancement. (b) The lesion demonstrates 178% peak initial enhancement with areas of delayed washout (red), persistent (blue), and plateau (green) kinetic features. (c) The lesion demonstrates high signal intensity (arrow), with a calculated CNR of 2.655. (d) On ADC map the lesion demonstrates low signal intensity (arrow), with a mean ADC value of 1.28 × 10⁻³ mm2/sec.
Figure 1d:
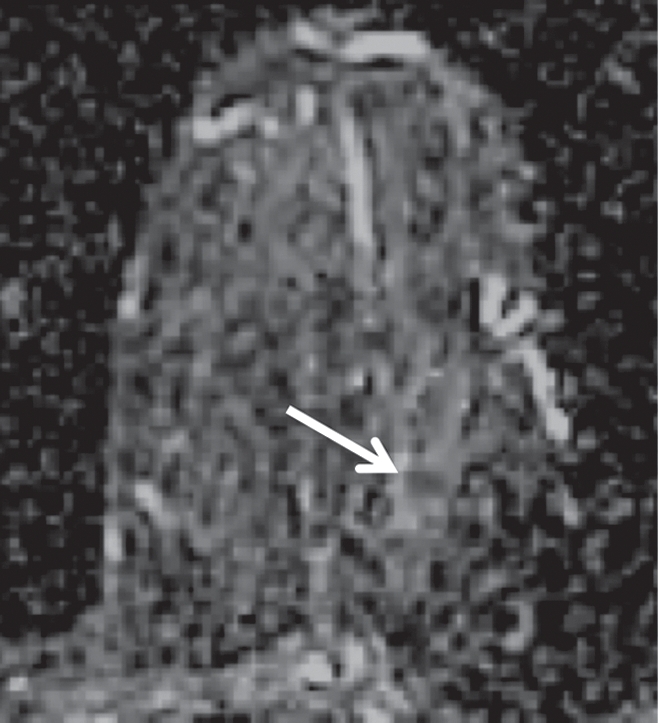
Non-HNG DCIS lesion on (a, b) DCE and (c, d) DW (b = 600 sec/mm2) MR images in 42-year-old woman. (a) T1-weighted fat-suppressed image shows 9-mm focal area (arrow) of non–mass-like enhancement. (b) The lesion demonstrates 178% peak initial enhancement with areas of delayed washout (red), persistent (blue), and plateau (green) kinetic features. (c) The lesion demonstrates high signal intensity (arrow), with a calculated CNR of 2.655. (d) On ADC map the lesion demonstrates low signal intensity (arrow), with a mean ADC value of 1.28 × 10⁻³ mm2/sec.
Figure 2b:
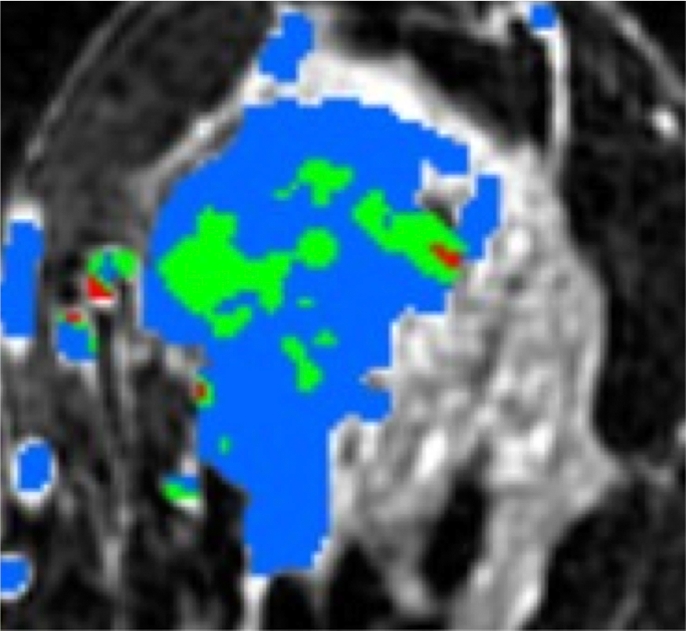
HNG DCIS lesion on (a, b) DCE and (c, d) DW (b = 600 sec/mm2) MR images in 37-year-old woman. (a) T1-weighted fat-suppressed image shows 51-mm mass. (b) The mass demonstrates 146% peak initial enhancement with areas of delayed washout (red), persistent (blue), and plateau (green) kinetic features. (c) The lesion demonstrated high signal intensity, with a calculated CNR of 2.35. (d) On ADC map the lesion demonstrates low signal intensity, with a mean ADC value of 1.45 × 10⁻³ mm2/sec.
Figure 2c:
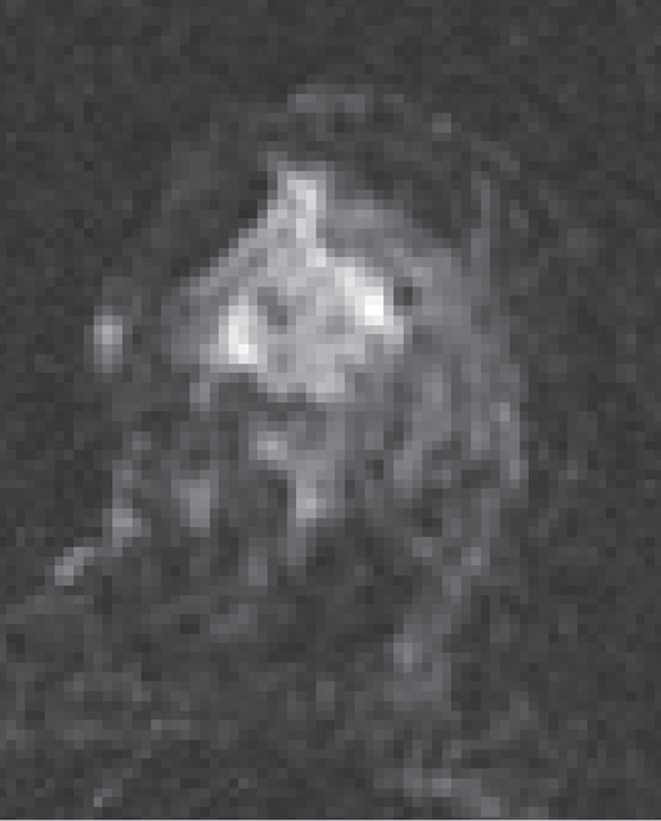
HNG DCIS lesion on (a, b) DCE and (c, d) DW (b = 600 sec/mm2) MR images in 37-year-old woman. (a) T1-weighted fat-suppressed image shows 51-mm mass. (b) The mass demonstrates 146% peak initial enhancement with areas of delayed washout (red), persistent (blue), and plateau (green) kinetic features. (c) The lesion demonstrated high signal intensity, with a calculated CNR of 2.35. (d) On ADC map the lesion demonstrates low signal intensity, with a mean ADC value of 1.45 × 10⁻³ mm2/sec.
Figure 2d:
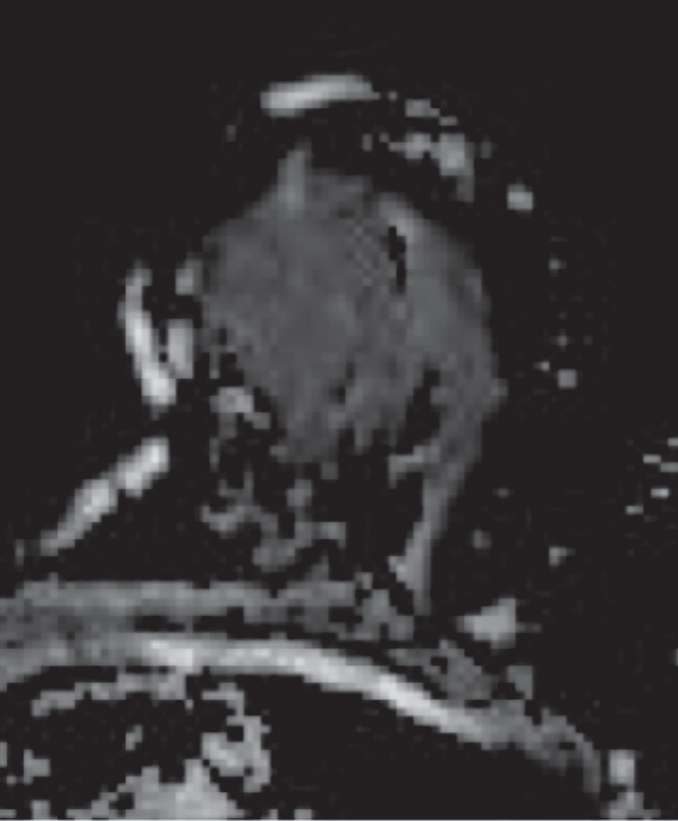
HNG DCIS lesion on (a, b) DCE and (c, d) DW (b = 600 sec/mm2) MR images in 37-year-old woman. (a) T1-weighted fat-suppressed image shows 51-mm mass. (b) The mass demonstrates 146% peak initial enhancement with areas of delayed washout (red), persistent (blue), and plateau (green) kinetic features. (c) The lesion demonstrated high signal intensity, with a calculated CNR of 2.35. (d) On ADC map the lesion demonstrates low signal intensity, with a mean ADC value of 1.45 × 10⁻³ mm2/sec.
Discrimination of DCIS Grade with Univariate Modeling
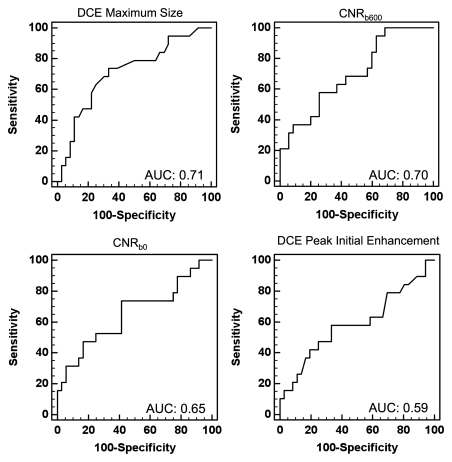
Univariate logistic regression modeling showed that maximum lesion size (AUC, 0.71; 95% confidence interval [CI]: 0.574, 0.826) and CNR for DW images with b value of 600 sec/mm2 (AUC, 0.70; 95% CI: 0.561, 0.818) provided the most accurate discrimination of HNG from non-HNG DCIS, followed by CNR for DW images with b value of 0 sec/mm2 (AUC, 0.65; 95% CI: 0.512, 0.775; Fig 3). Peak initial enhancement was the only kinetic variable that allowed marginal discrimination of DCIS grade (AUC, 0.59; 95% CI: 0.448, 0.720). Neither lesion morphology nor worst-curve delayed enhancement kinetics allowed discrimination of DCIS grade with univariate modeling.
Figure 3:
Univariate ROC curves. Relative abilities of DCE maximum lesion size, CNR at DW imaging with b values of 600 sec/mm2 (CNRb600) and 0 sec/mm2 (CNRb0), and peak initial enhancement at imaging 90 seconds after contrast material administration for discrimination of HNG from non-HNG DCIS, as measured by their respective AUCs.
Discrimination of DCIS Grade with Multivariate Modeling
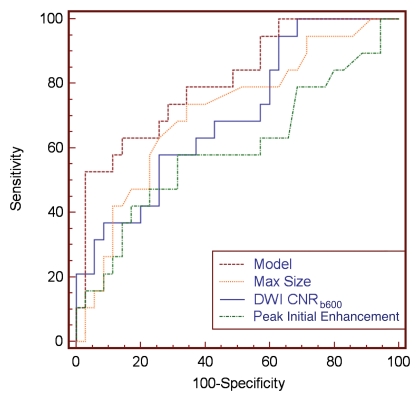
Stepwise multivariate analysis of univariate discriminators (maximum lesion size, CNR for DW images with b value of 0 and 600 sec/mm2, and peak initial enhancement) identified CNR for DW images with b value of 600 sec/mm2 and maximum lesion size as significant independent predictors of DCIS grade (P = .006 and .007, respectively). According to the ROC curve analysis, the combined model incorporating maximum lesion size and CNR (b = 600 sec/mm2) features discriminated HNG from non-HNG DCIS more accurately than any single variable (AUC, 0.81; 95% CI: 0.679, 0.903), though the differences between the model and the individual variables were not significant (model vs CNR [b = 600 sec/mm2], P = .1681; model vs maximum lesion size, P = .074; Fig 4).
Figure 4:
Comparison of optimal multivariate model with individual univariate models with ROC curve analysis. Graph shows that a model incorporating both CNR for DW images with b of 600 sec/mm2 (CNRb600) and maximal (Max) lesion size provided the best discriminative ability (AUC = 0.81) than did individual parameters (AUC = 0.71 for maximum size, AUC = 0.70 for CNR).
Discussion
DCIS is a heterogeneous breast malignancy with variable invasive potential that has been shown to be dependent in part on the pathologic grade. However, there are persistent controversies regarding which forms of DCIS warrant aggressive therapy (24), which raises concerns of overtreatment. Thus, the identification of highly specific imaging biomarkers that could allow more individualized therapies that accurately match lesion-specific DCIS biology could have a substantial benefit for patient morbidity. Recent developments in advanced breast MR imaging technology (eg, higher field strength DW techniques) hold promise for the identification of such predictive imaging markers. Previous studies evaluating DCIS grade with MR imaging have focused on the use of either DCE (8,10–12) or DW imaging (16,17) features alone; to our knowledge, no study to date has examined the combination of these MR imaging techniques to assess in vivo DCIS grade. In our study, we found that HNG DCIS can be successfully discriminated from non-HNG DCIS, with up to 81% accuracy, by using a combination of DCE and DW characteristics.
Individually, DCE maximum lesion size and CNR for images with b of 600 sec/mm2 provided the greatest discriminatory abilities (AUC = 0.71 and 0.70, respectively). Larger DCIS lesions corresponded with higher grade DCIS, which was not unexpected given the association of HNG DCIS with more extensive involvement at diagnosis due to more aggressive biology. The higher CNR (b = 600 sec/mm2) in non-HNG DCIS lesions is likely due to greater T2 shine-through, as there was no corresponding significant difference in ADC values (and thus no significant difference in diffusion restriction) between HNG and non-HNG DCIS. This is supported by our findings of significantly higher T2-weighted signal intensities (as measured by CNR for images with b of 600 sec/mm2]) in non-HNG lesions compared with HNG lesions. It is possible that non-HNG lesions have higher fluid content than HNG lesions in vivo, which could account for this phenomenon. The lack of differences in ADC suggests that the levels of cellularity between HNG and non-HNG DCIS lesions are similar. However, in multivariate modeling, CNR for images with b of 600 sec/mm2 was more predictive than CNR for images with b of 0 sec/mm2, suggesting that DCIS appearance on DW images is multifactorial and differences in vascularity and perfusion, as well as differences in baseline normal-tissue values, could be contributing to the observed differences in the CNR between the grades. It should also be noted that the lack of observed differences in ADC values between DCIS grades disagrees with recently published results of a pilot study by Iima et al (17). Thus, further studies are needed to better explain the observed differences among DCIS grades on DW images.
Overall, individual kinetic parameters provided little value for DCIS grade discrimination, which is in agreement with the findings of Jansen et al (12). Specifically, we observed an equal distribution of worst-curve delayed enhancement kinetic profiles between HNG and non-HNG lesions, though there was a trend toward greater peak initial enhancement in HNG lesions (P = .05). This could reflect the unique enhancement characteristics of DCIS, which is generally known to reach overall peak enhancement later than its invasive counterparts (12). It is possible that HNG lesions have greater basement membrane permeability, which could account for higher initial enhancement measures, causing these lesions to demonstrate overall similar kinetic curves to those of invasive breast cancers. It is worth noting that peak initial enhancement was calculated at 90 seconds and may not reflect the true peak enhancement over time for more slowly enhancing DCIS lesions, which may partially explain why this kinetic parameter was not a significant predictor. Further studies with advanced MR imaging techniques such as higher temporal resolution at higher field strength could yield increased value for the role of enhancement kinetics for DCIS grade assessment.
The ability to accurately predict in vivo DCIS grade has multiple clinical implications. DCIS lesions themselves are heterogeneous and thus susceptible to sampling error at core needle biopsy, with upgrade to higher grade or even foci of invasive disease relatively common at final surgical excision (25). A model that accurately predicts DCIS grade may also be able to predict which lesions are likely to be upgraded after surgical excision, allowing for more accurate pretreatment assessment and planning. Further, this model could be investigated for application in closely related high-risk lesions, such as atypical ductal hyperplasia, to predict the likelihood of upgrade to DCIS at surgical excision.
Perhaps most promising, incorporation of imaging characteristics with histopathologic and clinical information could create a model for more individualized therapy of DCIS. The current standard-of-care for DCIS treatment is either mastectomy or breast-conserving surgery with radiation therapy (26,27). In the case of breast-conserving therapy, radiation therapy provides a lower rate of local recurrence in all subgroups of DCIS lesions; however, the extent of its value has been shown to be significantly lower in cases of small low-grade DCIS lesions, in which surgical excision resulted in at least 1 cm of clear margins (6). A recent study by Hughes et al (28) demonstrated that patients with small (< 2.5 cm) non-HNG DCIS lesions with surgical margins of 3 mm or greater had an acceptably low rate (6%) of local recurrence at 5 years after excision without radiation therapy, while HNG DCIS recurred locally at a higher rate without radiation therapy in 15% of patients. Imaging models that could augment DCIS risk stratification could thus decrease morbidity by identifying patients in whom radiation therapy is unnecessary.
Although our results yielded promise for the use of MR imaging to assess DCIS grade in vivo, our study had several statistical limitations. Six lesions were excluded owing to obscuration due to postbiopsy changes, which could have led to an overestimation of the utility of CNR measures on DW images by excluding cases for which this parameter was not useful. Ten lesions were excluded due to absence of enhancement on DCE MR images and 19 lesions were excluded because they did not reach a 50% minimal enhancement threshold for the generation of synopsis of automated computer-aided evaluation kinetics; this could have introduced bias and led to an overestimate of the utility of the kinetic features for DCIS grade discrimination. However, given that we found little use for kinetic features in our modeling, the impact of this limitation is believed to be minimal. While the multivariate model of maximum lesion size and CNR for images with b of 600 sec/mm2 had a greater AUC than individual parameters, the differences were not statistically significant. Thus, this study provides insufficient evidence to suggest the multivariate model will have greater diagnostic performance clinically. Finally, the study included a relatively small sample size of lesions, and thresholds for ROC curve analysis were determined by the study population; both of these factors could thus overestimate diagnostic performance.
Our study also had some technical limitations. Our DCE MR imaging protocol was optimized for maximal spatial resolution; as a result, temporal sampling is limited. Higher temporal resolution could provide a more accurate assessment of the contrast-enhancement curve. To achieve adequate signal-to-noise ratio, the DW acquisition was 5 mm, which could result in partial volume averaging. This limitation could be overcome by utilizing longer imaging times or by imaging at higher field strength (29). The DW examinations in this study were performed with a diffusion sensitization of b of 600 sec/mm2; utilization of higher b values and field strength may alter DW signal intensities of the breast lesions (23,30). Furthermore, the use of a nonzero minimum b value and a higher maximum b value for ADC calculations could improve accuracy for measuring restricted diffusion by eliminating perfusion effects (23). All DW examinations were performed after the injection of a gadolinium-based contrast agent. There are conflicting reports on the effects of gadolinium-based agents on the calculated ADC values (31–33), and it may be preferable to perform this sequence prior to contrast agent administration.
In summary, we found that it is possible to assess DCIS grade in vivo by using DCE and DW features on breast MR images. DCE maximum lesion size, CNR for images with b of 600 sec/mm2, and T2 signal intensity (CNR at b = 0 sec/mm2) provided similar discriminative abilities, identifying HNG DCIS correctly 71%, 70%, and 65% of the time, respectively. Our optimal model using both CNR for images with b of 600 sec/mm2 and maximum lesion size identified HNG DCIS lesions with 81% accuracy. DCE MR imaging kinetic features were not helpful in DCIS grade assessment. Further research evaluating the ability of imaging to predict prognostic DCIS characteristics is warranted and could lead to improved DCIS risk stratification and more individualized therapies.
Advances in Knowledge.
• On dynamic contrast-enhanced (DCE) MR images, high-nuclear-grade (HNG) ductal carcinoma in situ (DCIS) lesions on average present as larger (mean size, 38.7 mm ± 22.9) than non-HNG DCIS (mean size, 23.7 mm ± 18.9) lesions (P = .02).
• Non-HNG DCIS demonstrates higher diffusion-weighted (DW) signal intensity and higher T2 signal intensity than HNG DCIS (P = .004 and .025, respectively) but no difference in apparent diffusion coefficiens (P = .48).
• The semi-quantitative kinetic feature of worst-curve delayed enhancement (P = .97) provides no value for in vivo discrimination of DCIS grade, while peak initial enhancement (P = .05) approaches significance.
• A combination of DCE maximum lesion size and DW signal intensity can be used to discriminate HNG from non-HNG DCIS in vivo (area under the receiver operating characteristic curve = 0.81).
Implication for Patient Care.
• Our preliminary study demonstrates that MR features may serve as biomarkers for HNG DCIS; this could lead to increased diagnostic confidence from core biopsy sampling and could facilitate more individualized therapies.
Disclosures of Potential Conflicts of Interest: H.R. Financial activities related to the present article: author received ISMRM Trainee stipend for travel to 2011 ISMRM meeting to present an earlier version of this study. Financial activities not related to the present article: institution received grant from the Breast Cancer Research Program Pilot Project Fund. Other relationships: none to disclose. S.C.P. Financial activities related to the present article: none to disclose. Financial activities not related to the present article: institution received grant from Philips Healthcare. Other relationships: none to disclose. W.B.D. No potential conflicts of interest to disclose. R.L.G. No potential conflicts of interest to disclose. K.H.A. Financial activities related to the present article: institution received grant from Seattle Cancer Care Alliance. Financial activities not related to the present article: none to disclose. Other relationships: none to disclose. S.P. No potential conflicts of interest to disclose. C.D.L. Financial activities related to the present article: institution received grant from Fred Hutchinson Cancer Research Center. Financial activities not related to the present article: author received fees for consultancy from Philips, Bayer, and GE; institution has a grant pending from GE; author received fees for lectures and payment for development of educational presentations from GE. Other relationships: none to disclose.
Received July 7, 2011; revision requested September 7; revision received November 8; accepted December 7; final version accepted December 14.
H.R. supported by a 2010-2011 RSNA Research Fellow Grant.
Funding: This research was supported by the National Institutes of Health (grant RO1CA151326).
Abbreviations:
- ADC
- apparent diffusion coefficient
- AUC
- area under the receiver operating characteristic curve
- CI
- confidence interval
- CNR
- contrast-to-noise ratio
- DCE
- dynamic contrast material–enhanced
- DCIS
- ductal carcinoma in situ
- DW
- diffusion weighted
- HNG
- high-nuclear-grade
- ROC
- receiver operating characteristic
References
- 1.Ries LAG, Krapcho M, Mariotto A, et al. SEER cancer statistics review 1975-2004. Bethesda, Md: National Cancer Institute; http://seer.cancer.gov/csr/1975_2004/. Published November 2006. Accessed November 2011 [Google Scholar]
- 2.Morrow M, Strom EA, Bassett LW, et al. Standard for breast conservation therapy in the management of sinvasive breast carcinoma. CA Cancer J Clin 2002;52(5):277–300 [DOI] [PubMed] [Google Scholar]
- 3.Nelson HD, Tyne K, Naik A, Bougatsos C, Chan BK, Humphrey L. Screening for breast cancer: an update for the U.S. Preventive Services Task Force. Ann Intern Med 2009;151(10):727–737, W237–W242 [DOI] [PMC free article] [PubMed] [Google Scholar]
- 4.Allegra CJ, Aberle DR, Ganschow P, et al. National Institutes of Health State-of-the-Science Conference statement: diagnosis and management of ductal carcinoma in situ. September 22-24, 2009. J Natl Cancer Inst 2010;102(3):161–169 [DOI] [PubMed] [Google Scholar]
- 5.Kerlikowske K, Molinaro A, Cha I, et al. Characteristics associated with recurrence among women with ductal carcinoma in situ treated by lumpectomy. J Natl Cancer Inst 2003;95(22):1692–1702 [DOI] [PubMed] [Google Scholar]
- 6.Mokbel K, Cutuli B. Heterogeneity of ductal carcinoma in situ and its effects on management. Lancet Oncol 2006;7(9):756–765 [DOI] [PubMed] [Google Scholar]
- 7.Lehman CD. Magnetic resonance imaging in the evaluation of ductal carcinoma in situ. J Natl Cancer Inst Monogr 2010;2010(41):150–151 [DOI] [PMC free article] [PubMed] [Google Scholar]
- 8.Kuhl CK, Schrading S, Bieling HB, et al. MRI for diagnosis of pure ductal carcinoma in situ: a prospective observational study. Lancet 2007;370(9586):485–492 [DOI] [PubMed] [Google Scholar]
- 9.Facius M, Renz DM, Neubauer H, et al. Characteristics of ductal carcinoma in situ in magnetic resonance imaging. Clin Imaging 2007;31(6):394–400 [DOI] [PubMed] [Google Scholar]
- 10.Neubauer H, Li M, Kuehne-Heid R, Schneider A, Kaiser WA. High grade and non-high grade ductal carcinoma in situ on dynamic MR mammography: characteristic findings for signal increase and morphological pattern of enhancement. Br J Radiol 2003;76(901):3–12 [DOI] [PubMed] [Google Scholar]
- 11.Rosen EL, Smith-Foley SA, DeMartini WB, Eby PR, Peacock S, Lehman CD. BI-RADS MRI enhancement characteristics of ductal carcinoma in situ. Breast J 2007;13(6):545–550 [DOI] [PubMed] [Google Scholar]
- 12.Jansen SA, Newstead GM, Abe H, Shimauchi A, Schmidt RA, Karczmar GS. Pure ductal carcinoma in situ: kinetic and morphologic MR characteristics compared with mammographic appearance and nuclear grade. Radiology 2007;245(3):684–691 [DOI] [PubMed] [Google Scholar]
- 13.Partridge SC, Rahbar H, Murthy R, et al. Improved diagnostic accuracy of breast MRI through combined apparent diffusion coefficients and dynamic contrast-enhanced kinetics. Magn Reson Med 2011;65(6):1759–1767 [DOI] [PMC free article] [PubMed] [Google Scholar]
- 14.Partridge SC, Mullins CD, Kurland BF, et al. Apparent diffusion coefficient values for discriminating benign and malignant breast MRI lesions: effects of lesion type and size. AJR Am J Roentgenol 2010;194(6):1664–1673 [DOI] [PubMed] [Google Scholar]
- 15.Partridge SC, Demartini WB, Kurland BF, Eby PR, White SW, Lehman CD. Differential diagnosis of mammographically and clinically occult breast lesions on diffusion-weighted MRI. J Magn Reson Imaging 2010;31(3):562–570 [DOI] [PubMed] [Google Scholar]
- 16.Rahbar H, Partridge SC, Eby PR, et al. Characterization of ductal carcinoma in situ on diffusion weighted breast MRI. Eur Radiol 2011;21(9):2011–2019 [DOI] [PubMed] [Google Scholar]
- 17.Iima M, Le Bihan D, Okumura R, et al. Apparent diffusion coefficient as an MR imaging biomarker of low-risk ductal carcinoma in situ: a pilot study. Radiology 2011;260(2):364–372 [DOI] [PubMed] [Google Scholar]
- 18.American College of Radiology Breast Magnetic Resonance Imaging (MRI) Accreditation Program. http://www.acr.org/accreditation/Breast-MRI. Published 2010. Accessed September 15, 2011 [DOI] [PMC free article] [PubMed]
- 19.Ikeda DM, Hylton NM, Kuhl CK, et al. BI-RADS: magnetic resonance imaging. 1st ed. In: D’Orsi CJ, Mendelson EB, Ikeda DM, et al. Breast Imaging Reporting and Data System: ACR BI-RADS—breast imaging alas. Reston, Va: American College of Radiology, 2003 [Google Scholar]
- 20.Williams TC, DeMartini WB, Partridge SC, Peacock S, Lehman CD. Breast MR imaging: computer-aided evaluation program for discriminating benign from malignant lesions. Radiology 2007;244(1):94–103 [DOI] [PubMed] [Google Scholar]
- 21.Wang LC, DeMartini WB, Partridge SC, Peacock S, Lehman CD. MRI-detected suspicious breast lesions: predictive values of kinetic features measured by computer-aided evaluation. AJR Am J Roentgenol 2009;193(3):826–831 [DOI] [PubMed] [Google Scholar]
- 22.Partridge SC, DeMartini WB, Kurland BF, Eby PR, White SW, Lehman CD. Quantitative diffusion-weighted imaging as an adjunct to conventional breast MRI for improved positive predictive value. AJR AM J Roentgenol 2009; 193(6):1716–1722 [DOI] [PubMed] [Google Scholar]
- 23.Bogner W, Gruber S, Pinker K, et al. Diffusion-weighted MR for differentiation of breast lesions at 3.0 T: how does selection of diffusion protocols affect diagnosis? Radiology 2009;253(2):341–351 [DOI] [PubMed] [Google Scholar]
- 24.Patani N, Khaled Y, Al Reefy S, Mokbel K. Ductal carcinoma in-situ: an update for clinical practice. Surg Oncol 2011;20(1):e23–e31 [DOI] [PubMed] [Google Scholar]
- 25.Brennan ME, Turner RM, Ciatto S, et al. Ductal carcinoma in situ at core-needle biopsy: meta-analysis of underestimation and predictors of invasive breast cancer. Radiology 2011;260(1):119–128 [DOI] [PubMed] [Google Scholar]
- 26.Baxter NN, Virnig BA, Durham SB, Tuttle TM. Trends in the treatment of ductal carcinoma in situ of the breast. J Natl Cancer Inst 2004;96(6):443–448 [DOI] [PubMed] [Google Scholar]
- 27.Patani N, Cutuli B, Mokbel K. Current management of DCIS: a review. Breast Cancer Res Treat 2008;111(1):1–10 [DOI] [PubMed] [Google Scholar]
- 28.Hughes LL, Wang M, Page DL, et al. Local excision alone without irradiation for ductal carcinoma in situ of the breast: a trial of the Eastern Cooperative Oncology Group. J Clin Oncol 2009;27(32):5319–5324 [DOI] [PMC free article] [PubMed] [Google Scholar]
- 29.Matsuoka A, Minato M, Harada M, et al. Comparison of 3.0-and 1.5-tesla diffusion-weighted imaging in the visibility of breast cancer. Radiat Med 2008;26(1):15–20 [DOI] [PubMed] [Google Scholar]
- 30.Dudink J, Larkman DJ, Kapellou O, et al. High b-value diffusion tensor imaging of the neonatal brain at 3T. AJNR Am J Neuroradiol 2008;29(10):1966–1972 [DOI] [PMC free article] [PubMed] [Google Scholar]
- 31.Yuen S, Yamada K, Goto M, Nishida K, Takahata A, Nishimura T. Microperfusion-induced elevation of ADC is suppressed after contrast in breast carcinoma. J Magn Reson Imaging 2006;24(2):319–324 [DOI] [PubMed] [Google Scholar]
- 32.Rubesova E, Grell AS, De Maertelaer V, Metens T, Chao SL, Lemort M. Quantitative diffusion imaging in breast cancer: a clinical prospective study. J Magn Reson Imaging 2006;24(2):319–324 [DOI] [PubMed] [Google Scholar]
- 33.Chen G, Jespersen SN, Pedersen M, Pang Q, Horsman MR, Stodkilde-Jorgensen H. Intravenous administration of Gd-DTPA prior to DWI does not affect the apparent diffusion constant. Magn Reson Imaging 2005;23(5):685–689 [DOI] [PubMed] [Google Scholar]


