Abstract
A method for discriminating between α-chiral primary amine enantiomers is reported. The method utilizes circular dichroism spectroscopy and a sensing ensemble composed of 2-formyl-3-hydroxyl pyridine (4) and Fe(II)(TfO)2. Aldehyde 4 reacts rapidly with chiral amines to form chiral imines, which complex Fe(II) to form a series of diastereomeric octahedral complexes that are CD active in both the UV and visible spectrum. NMR studies showed that, for enantiomerically pure imine complexes, the Δ-fac isomer is preferred. A statistical analysis of the distribution of stereoisomers accurately models the calibration curves for enantiomeric excess. CD signals appearing in the UV region were bisignate, and the null of the CD signals were coincident with maxima in the UV spectrum, consistent with exciton coupling. TTDFT and semi-empirical calculations confirmed that the CD signals in the UV region arise from coupling of the π-π* transitions in the imine chromophores, and can be used to accurately describe the sign and magnitudes of the curves. The CD signals in the visible region arise from metal-to-ligand charge transfer bands, and these signals can be used to determine the ee values of chiral amines with an average absolute error of ±5%. Overall, the strategy presented herein represents a facile in situ assembly that uses commercially available simple reagents to create large optical signals indicative of ee values.
Introduction
A well-suited technique for studying chirality is CD spectroscopy.1 Because CD spectroscopy uses a circularly polarized light source, enantiomers with absorptions in the UV-vis can be differentiated without the need for a chiral reagent.2–4 For analytes that do not absorb in the UV-vis, it is necessary to introduce chromophores either by irreversible covalent,5–7 reversible covalent,8–10 or supramolecular chemistry.11–13
One method to introduce a chromophore to a chiral analyte is by binding the analyte to a metal resulting in the induction, or modulation, of CD in the d-d transitions and/or charge transfer bands.14–19 Such metal-based assays are attractive because the d-d transitions, and/or charge transfer bands appear in the visible spectrum where interference from chromophores in the analyte and/or impurities is improbable. However, such signals are often very small; additionally, it is difficult to theoretically describe metal-based systems,14,15,17,18,20 and thus, correlations between the configuration of the analytes with the magnitude and sign of the CD signals must usually be done by empirical means.20
A non-empirical method, first described by Nakanishi et al., called exciton coupled circular dichroism (ECCD),1,20 has shown great utility in sensing chirality.5–7 ECCD arises from the coupling of the excited state of at least two proximal, asymmetrically oriented chromophores. The sign of the first Cotton effect of the ECCD couplet is directly related to the sign of the dihedral angle between the transition dipoles of the chromophores, and therefore ECCD provides insight into the configuration of the system being studied.1
In general, because CD spectroscopy is an optical technique it allows for rapid analysis. Methods to rapidly distinguish enantiomers can find applications in parallel synthesis routines for the determination of ee.21 Determination of ee, presently, is most commonly done using chiral HPLC. Chiral HPLC is well suited to serial asymmetric reaction discovery methods where the design and execution of reactions are the most time-intensive aspects of the discovery process. However, for parallel asymmetric reaction discovery,22 where hundreds to thousands of reaction conditions are tested, the analysis of ee by chiral HPLC can be a bottleneck in the discovery process.
In order to create rapid methods to determine ee values, our group and others have implemented supramolecular and/or reversible covalent receptors in conjunction with optical instrumentation such as UV-vis, fluorescence, and CD spectrometry.23–33 Measurements taken with optical instrumentation are typically fast, allowing for high-throughput. Further, the supramolecular receptors are inexpensive and can interact with a wide range of analytes. The high speeds, low cost, and wide analyte scope of supramolecular optical methods make them an attractive option for the rapid screening of ee.
Our most recently reported protocol for the determination of the ee of chiral amines uses CD spectroscopy and a sensing ensemble composed of pyridine carboxyaldehyde 1 and organometallic receptor 2 (Scheme 1).23 Aldehyde 1 was used to convert the primary chiral amines into bidentate imines. Complexation of the chiral imines with receptor 2 resulted in modulation of a CD active charge transfer band. Differential modulation of the charge transfer band was observed for imine enantiomers differing in their absolute configuration, and thus, by developing calibration curves, the system could be used to determine ee. However, the system had several limitations. First, the imine formation was slow – it took two hours to go to completion. Second, the CD signal appeared in the UV and was of low intensity, resulting in a low signal-to-noise ratio, which led to moderately high errors in ee of ±12%. Lastly, the calibration curves were concentration dependent, and thus required the use of an artificial neural network to relate the CD data to ee values.
Scheme 1.
The chiral Cu(I) receptor and imine binding scheme for our previously reported protocol.23 A CD active charge transfer band is present in the receptor and is modulated upon binding of the imine.
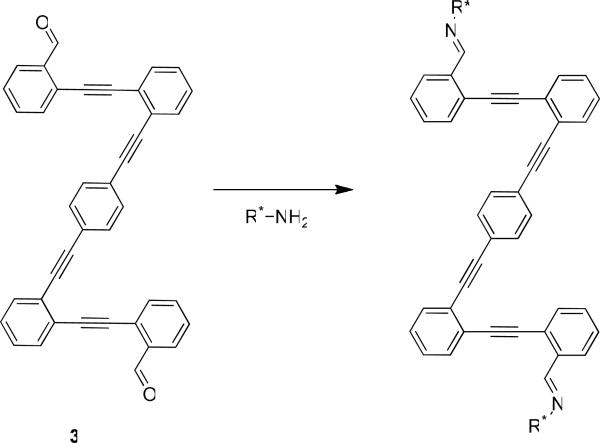
Although our previous system suffered from these limitations, it is one of the few that is capable of differentiating between enantiomers of monodentate chiral primary amines. Most systems capable of differentiating amine enantiomers report results for bidentate analytes such as diamines, amino acids, and/or amino alcohols, but, typically, do not report results for monodentate amines.9,34–40 One recent report by Wolf et al. describes the utility of dialdehyde receptor 3 (Scheme 2).9 The system was designed for diamines, but fortunately, it was also applicable in the determination of chirality in monodentate amines. It was shown, for monodentate amines, that the system could be used to determine ee with an absolute error of approximately 5%. The novelty of the design of 3 advances the field, but one goal of our group is to create protocols that require little to no synthesis in creating the receptor.
Scheme 2.
The dialdehyde receptor developed by Wolf et al.
In the present paper, we explore, via a combination of computational and experimental methods, a CD method for sensing chirality in monodentate amines. The method utilizes an in-situ amine derivatization and self-assembly process involving commercially available materials; thus, there is no need for synthesis of a receptor. This decreases the preparation time for the assay, and thus, increases the assays' utility to the chemistry community at large. Additionally, the protocol overcomes all of the aforementioned limitations of our previously reported method for ee determination of monodentate chiral amines.
Design Criteria
To eliminate the synthesis of a host, we envisioned an assay composed of a metal, Fe(II), used as a scaffold and colorimetric indicator and an aldehyde, 4, used as a chromophoric derivatizing agent for converting the monodentate amines in situ to bidentate imines 5 (Scheme 3). Fe(II) was chosen because it has six binding sites, and thus, could potentially bring three equivalents of bidentate imines 5 into proximity to create 6. We predicted that the proximity of the imines in 6 would allow for coupling of the π-π* transitions giving an ECCD couplet in the UV, which could be used to determine absolute configuration. In addition, Fe(II) is known to form CD active metal-to-ligand charge transfer bands in the visible range of the spectrum, which could conceivably be used in conjunction with calibration curves to calculate the ee of unknown samples.
Scheme 3.
Aldehyde 4 reacts rapidly with amines to form imine 5, followed by complexation to Fe(II) to form 6.
Increasing the Rate of Imine Formation
In our previous assay, aldehyde 1 was allowed to react with a chiral primary amine to form a bidentate imine (Scheme 1). The reaction was quantitative, but required molecular sieves, and took 2 hours to go to completion.16 In the interest of speeding up this reaction we switched to aldehyde 3 (Scheme 3). Based on research done by Chin et al. and Wolf et al.,8,10 we hypothesized that the presence of the hydroxyl group ortho to the aldehyde would increase the rate of imine formation via hydrogen bonding and/or general acid catalysis. Indeed, the addition of the hydroxyl group greatly enhanced the reactivity of the aldehyde towards amines, because the reaction of 4 is finished in less than 10 seconds to yield imines 5. Further, no molecular sieves are required to drive the reaction with 4 to completion.
Choice of Analytes and Derivatization Method
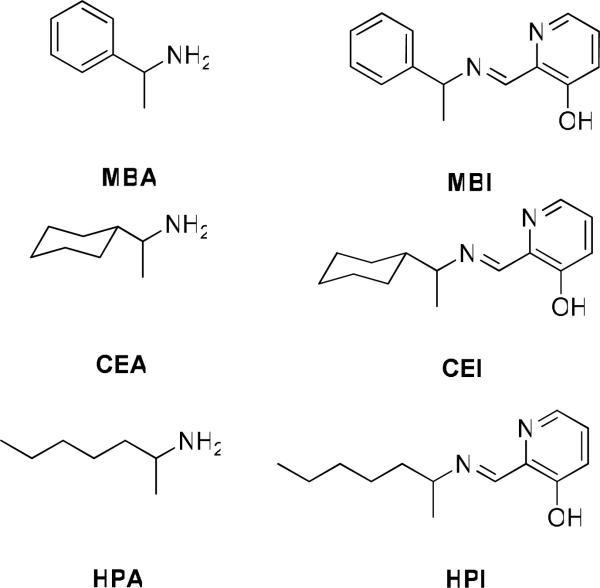
The chiral amines 2-amino-1-phenyl-ethane (MBA), 1-(2-aminoethyl)-cyclohexane (CEA), and 2-amino-heptane (HPA) (Figure 1) were chosen for study to span a range of chemical space representing aromatic, cyclic, and aliphatic moieties, respectively. The amines were converted to imines 5, followed by in situ addition of Fe(II), resulting in the formation of complex 6 (Scheme 3).
Figure 1.
The three amines, MBA, CEA, and HPA, studied (left). The three imines, MBI, CEI, and HPI, formed after the imines react with aldehyde 3 (right).
Determining Saturation via UV-vis Titrations
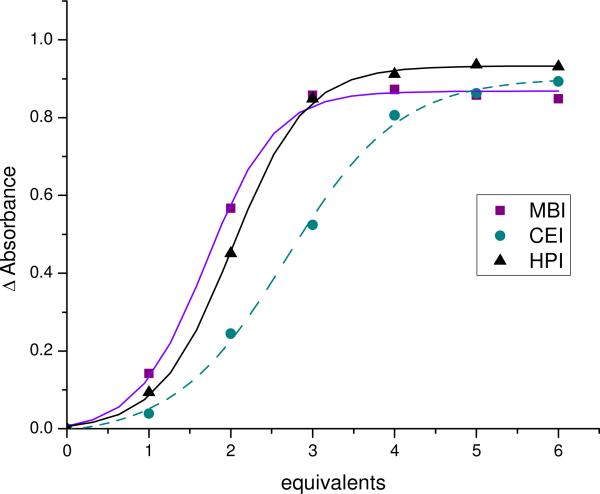
Titrations were performed to determine the proper ratios of 5 (MBI, CEI, and HPI) to Fe(II) required to reach signal saturation (Figure 2). Saturation is important because it allows for the development of concentration independent calibration curves. As long as the assay is performed above saturation, ee calibration curves developed at a single concentration can be used to analyze unknowns at any concentration (vide infra). Saturation also yields the maximum signal-to-noise ratio and minimizes 2:1 and 1:1 imine to ligand species, which thereby simplifies the stereochemical analysis of the CD data. The titrations revealed saturation at three equivalents for MBI and HPI, but nearly five equivalents were required for CEI because it has a lower affinity for the metal. CEI likely has a lower affinity for the metal due to increased strain in the 3:1 complex due to the larger steric size of the cyclohexyl group of CEI as compared to the steric size of the phenyl and hexyl group of MBI and HPI, respectively. As expected, the binding curves have sigmoidal shapes, which reflect the high order stoichiometry of the system (3:1). The imines, MBI, HPI, and CEI, show approximately the same overall change in absorption at 575 nm, 577 nm, and 570 nm, respectively.
Figure 2.
The change in absorbance of as a function of equivalents of imine titrated into an acetonitrile solution of 1mM Fe(II) at 575 nm, 577 nm, and 570 nm for MBI, CEI, and HPI, respectively. Equivalents is defined as the concentration of imine divided by the concentration of Fe(II).
Stereoisomerism
As discussed, working above saturation minimizes 2:1 and 1:1 species. Thus, the dominant complex present is the 3:1 complex of imines with Fe(II). The complexes can, potentially, exist as two helical isomers (Δ and Λ) and two configurational isomers (fac and mer).41 Thus, for an enantiomerically pure sample, there are four possible stereoisomers. For amines that are not enantiomerically pure, there are 8 possible stereoisomers for the fac isomer and 16 possible isomers for the mer isomer, giving a total of 24 possible stereoisomers. Figure 3 shows all stereoisomers broken up into sets based on the distribution of R and S chiral amines. The large number of stereoisomers present when mixtures of R and S amines are added to a solution of Fe(II) could result in a level of complexity that hampers the ability to accurately determine the ee of the chiral amines. However, as long as all the complexes are in equilibria, rapidly exchanging, and the same distribution of complexes can be reproducibly obtained, the CD spectra will be consistent and indicative of amine ee values.
Figure 3.
The 24 possible stereoisomers that can form upon mixing of enantiomers of the chiral imines with Fe(II). In this figure, the isomers are organized by the mixture of stereogenic centers on each complex, (R-R-R), (S-S-S), (R-R-S) and (S-S-R), the configurational isomerism (fac and mer, given on the left), and the helical isomerism (Δ and Λ, given on the top). The red dotted lines trace out the `face' and `meridian' defined by the three imine nitrogens for the fac and mer isomers, respectively.
Constructing Calibration Curves
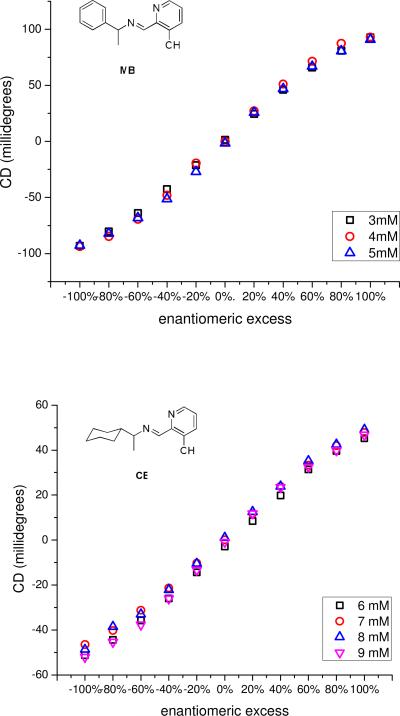
Calibration curves for enantiomeric excess were made by plotting the ellipticity at a single wavelength, depending on the imine, as a function of ee at constant concentration of Fe(II) and 5 (Figure 4). To demonstrate that the calibration curves were independent of the concentration of 5 above saturation, curves were developed for MBI and CEI at multiple concentrations. As can be seen from Figure 4, there is little difference between ellipticities at different concentrations.
Figure 4.
(top) A plot of the ellipticity at 519 nm as a function of ee with 1mM Fe(II), 2mM 4, and 3mM, 4mM, and 5mM of MBI (derived from MBA) in acetonitrile in a 0.1cm cell. (bottom) A plot of the ellipticity at 525 nm as a function of ee with 1mM Fe(II), 2mM 4, and 6mM, 7mM, 8mM, and 9mM of CEI (derived from CEA) in acetonitrile in a 0.1cm cell.
The shapes of the calibration curves are sigmoidal, which we postulated could arise from some form of cooperativity between chiral imines with the same stereogenic center for binding to Fe(II). However, this postulate was ruled out. If there were such cooperativity, the shapes of the calibration curves above saturation would vary with concentration because there would be excess imines, which would thermodynamically sort to achieve the most stable isomers. As previously discussed, the shapes of the calibration curves do not vary with concentrations. Thus, if there is no thermodynamic preference, the mixtures of chiral imines are most likely distributed statistically around Fe(II).
In order to test whether the imines were statistically distributed around Fe(II), theoretical calibration curves were developed using a probabilistic model. The first step in developing the model was to calculate the statistical distribution of isomer sets at a variety of ee values (Table 1) (see Supporting Information for how the calculations were performed). A 100% ee is defined as 1 and a −100% ee is defined as −1. Thus, for example, at 80% ee the distribution of complexes belonging to set (R-R-R) is 0.73, which means 73% of the total concentration of complex has the configuration (R-R-R); whereas the distribution of complexes belonging to (S-S-S) is only 0.00074. In order to account for the equal and opposite nature of CD signals arising from enantiomeric pairs, a positive sign was assigned to isomers that are predominantly R and a negative sign was assigned to isomers that are predominantly S. Thus, at 80% ee the (R-R-R) set has a positive value of 0.73 and the (S-S-S) set has a negative value of −0.00074. The signs were assigned based on the signs of the CD spectra of enantiomerically pure solutions of the complexes. Finally, because CD signals arising from enantiomeric pairs cancel, the assigned probabilities were summed to give the overall shape of the calibration curves.
Table 1.
A table of the calculated probabilities spanning 100% ee to −100% ee for different mixtures of chiral imine stereogenic centers surrounding Fe(II).
| %ee | (R-R-R) | (R-R-S) | (S-S-R) | (S-S-S) | sum |
|---|---|---|---|---|---|
| 100 | 1 | 0 | 0 | 0 | 1 |
| 80 | 0.73 | 0.25 | −0.025 | −0.00074 | 0.95 |
| 60 | 0.51 | 0.39 | −0.094 | −0.0071 | 0.80 |
| 40 | 0.34 | 0.45 | −0.19 | −0.025 | 0.58 |
| 20 | 0.21 | 0.44 | −0.29 | −0.061 | 0.30 |
| 0 | 0.12 | 0.38 | −0.38 | −0.12 | 0 |
| −20 | 0.061 | 0.29 | −0.44 | −0.21 | −0.30 |
| −40 | 0.025 | 0.19 | −0.45 | −0.34 | −0.58 |
| −60 | 0.0071 | 0.094 | −0.39 | −0.51 | −0.80 |
| −80 | 0.00074 | 0.025 | −0.25 | −0.73 | −0.95 |
| −100 | 0 | 0 | 0 | −1 | −1 |
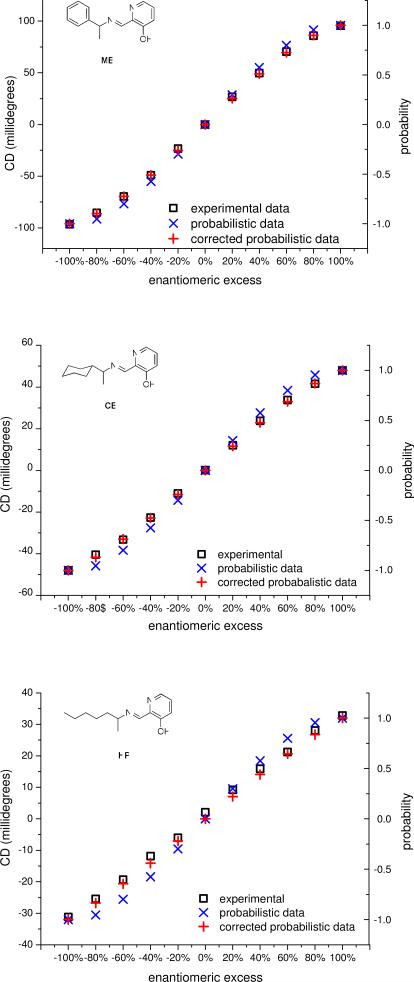
A normalized plot of the experimental calibration curve with an overlay of the calculated calibration curve (summarized in Table 1) shows that the probabilistic model does predict the shape of the curve (Figure 5). However, the sigmoidal shape of the calculated curve is more pronounced than that of the experimental curve. We postulated that the disagreement between the calculated and experimental curves arose from an assumption in the probabilistic model that the CD signal of isomers from sets (R-R-R) and (S-S-S) are equal in intensity to the signals of isomers from sets (R-R-S) and (S-S-R), respectively.
Figure 5.
The overlay of the uncorrected calculated data, corrected calculated data, and experimental data for MBI (top), CEI (middle), and HPI (bottom).
To correct for this assumption and refine the probabilistic model, the differences in the signal magnitudes were calculated from the experimental CD data. The signal magnitudes of the sets of Fe(II) complexes for the pure isomers (R-R-R) and (S-S-S) were measured directly via CD data by taking the spectra at 100% ee and −100% ee, respectively. Using the calculated probabilities, the signal magnitudes for sets (R-R-S) and (S-S-R) were calculated at each point on the calibration curve by subtracting the contributions from the pure (R-R-R) and (S-S-S) isomer sets using their distribution as given in Table 1. For instance, at 80% ee, the mean and standard deviation of the signals calculated for the isomer sets (R-R-S) or (S-S-R) at concentrations above saturation are 66.9±6.6 millideg, 30.0±2.9 millideg, and 15.8±7.1 millideg for MBI, CEI, and HPI, respectively. By dividing the pure isomer ellipticity by the mixed isomer ellipticities, the fractional decrease in signal in going from a pure isomer set to mixed isomer sets was found to be 0.75, 0.62, and 0.45 for MBI, CEI, and HPI, respectively. The values can be incorporated into the probabilistic calibration curve model by multiplying the probabilities for sets (R-R-S) and sets (S-S-R) by the respective fractional decreases. Plotting this calculated signal greatly improved the agreement with experimentally determined calibration curves, as can be seen in Figure 5. In fact, the calculated and experimental curves virtually overlay.
The agreement between the probabilistic calculations and experimental data provides strong evidence that the calibration curves indeed arise from a statistical distribution of amine stereogenic centers around Fe(II). Based on these results, it is expected that the induction of CD in a sensor with multiple binding sites will, generally, yield non-linear calibration curves for ee.
Crystal Structure
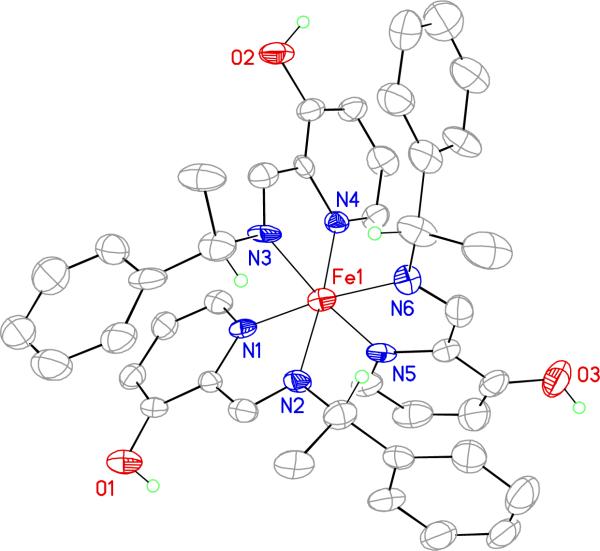
A crystal structure of the S-MBI-Δ-fac Fe(II) complex was obtained by slow diffusion of diethyl ether into an acetonitrile solution of the inverconverting complexes created with S-MBI. As can be seen in Figure 6, there is π-π slip-stacking between the benzyl group attached to the stereogenic center of the imine and the phenolic moiety of the parent aldehyde derivatizing agent. The crystal structure reported here is similar to that obtained for an analogous complex by Howson et al.41
Figure 6.
A crystal structure of the S-MBI-Δ-fac Fe(II) showing a partial atom labeling scheme. Displacement ellipsoids are scaled to the 50% probability level. Most hydrogen atoms were removed for clarity.
NMR Experiments to Determine the Diastereomeric Bias
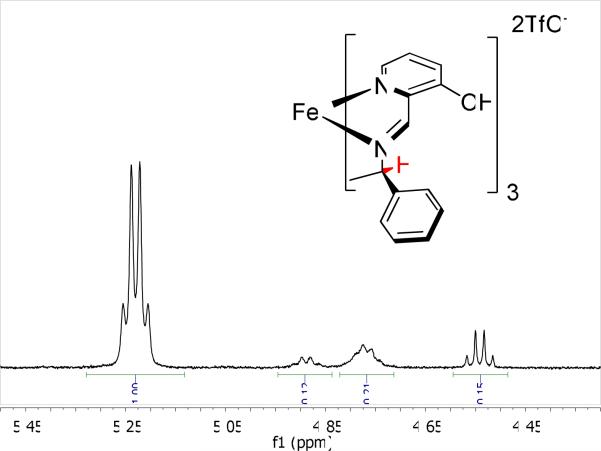
In order to better understand the fac/mer diastereomeric bias of the Fe(II) complexes, 1H NMR experiments were performed on the MBI-Fe(II) complex. Figure 7 shows the peaks corresponding to the benzylic proton of this complex at −100% ee (only the S isomer of MBI). There are two well-resolved quartets at 5.25 (with the larger integral) and 4.55 ppm, which can be assigned to the C3–symmetric fac species. The two broad, poorly defined multiplets between 4.70 ppm and 5.00 ppm can be assigned to the lower symmetry mer species.
Figure 7.
1H NMR spectrum CD3CN of the MBI-Fe(II) complex at −100% ee in the region of benzylic proton (in red) resonance.
The peak with the largest integration (quartet at 5.25 ppm) in the spectrum can be assigned to the fac-ΔFe-S-MBI isomer, which is the one isolated by crystallization and the most stable isomer found by DFT (vide infra). The fac-ΔFe-S-MBI isomer is also in agreement with results obtained by Howson et al.42 Consequently, the quartet at 4.55 ppm must belong to the second C3-symmetric species, the fac-ΛFe-S-MBI isomer. Based on the DFT results, the two multiplets at 4.7–4.9 ppm may be assigned to the non-symmetric mer-ΛFe-S-MBI isomer, which would have a relatively deshielded benzylic proton at 4.82 ppm and two, almost degenerate, benzylic protons around 4.70 ppm. In agreement with the assignment of the peak at 4.82 to a single deshielded benzylic proton and the peak at 4.70 to two quasi-degenerate benzylic protons, the two multiplets integrate to a 2:1 ratio, respectively. The mer-ΔFe-S-MBI isomer is either coincedent with the mer-ΛFe-S-MBI or is not observed due its lower stability, and thus low concentration. The DFT calculations show (discussed below and shown in Figure 8) that, in comparison to the fac-ΔFe-S-MBI isomer, the benzylic protons of the mer-ΛFe isomer are deshielded due to their proximity to either a pyridine (the two degenerate hydrogens) or a phenyl (Figure 8). The latter is more deshielded in accord with relative NICS values.43 Based on the assignment, we estimate a 62% diastereomeric excess for the fac-ΔFe-S-MBI. 1H NMR experiments were also done on enantiomerically impure imine samples (see Supporting Information). However, the complexity of the spectra made it difficult to extract any useful information about the diastereoselectivity. The fact that at least three possible isomers are involved when an enantiomerically pure amine is used ((S-S-S) set in Figure 3) provides evidence that several, if not all, of the 24 possible isomers of Figure 3 would be present within a mixture of enantiomerically impure imines.
Figure 8.
DFT-optimized structures for (S-S-S)-MBI-Fe(II) complex at BPV86/TZVP+ LanL2DZ(Fe) level, with relative internal energies and Boltzmann populations at 300K. All hydrogen atoms except benzylic ones are omitted for clarity; one H is shown in yellow (see text).
DFT geometry optimizations
With the aim of rationalizing the observed NMR spectra and affording suitable input structures for CD calculations, geometry optimizations of the MBI-Fe(II) complex were run with the DFT method. First, all four possible isomers of (S-S-S)-MBI-Fe(II) complex were generated (see Figure 3, upper right panel) starting from the X-ray geometry of S-MBI-Δ-fac Fe(II) species (Figure 6). Next, an extensive conformational search was run with a molecular mechanics method (MMFF force field). All structures obtained were optimized with DFT using BPV86 functional (see Computational Section for details) with a TZVP basis set for all atoms except Fe. The LanL2DZ basis set and effective core potential (ECP) were used for Fe. The methods were based on recent literature reports on related Fe(II) complexes.44–46 The results of geometry optimizations are shown in Table S1 (Supporting Information). The relevant geometries are shown in Figure 8. A highly populated single conformation was detected for each diastereomer. The calculations confirmed the fac-ΔFe-S-MBI isomer to be the most stable one with a population of ca. 72% at 300K. Moreover, the mer-ΛFe-S-MBI isomer was found as the second most stable isomer (Figure 8). These findings nicely coincide with the NMR data discussed above. Conversely, the minor fac-ΛFe-S-MBI isomer was found to have a negligible population, which is at odds with NMR results. Employing different functionals (LC-BPV86, B3LYP and M06-2X, see Computational Section), and a solvent model in the calculation did not resolve the disagreement between the computational and experimental results. The DFT-optimized structure for the fac-ΔFe-S-MBI isomer (Figure 8, left) is very similar to the X-ray geometry (Figure 6), the root-mean-square deviation between non-hydrogen atoms being 0.25Å.
CD spectroscopy and exciton analysis
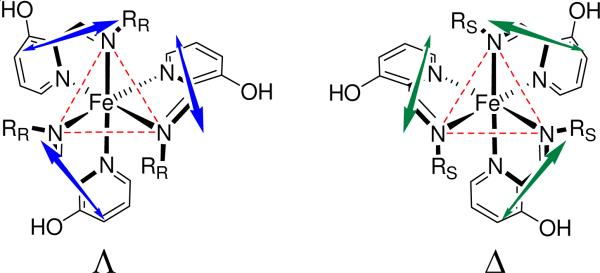
The proximity and dissymmetric orientation of the three ligands surrounding Fe(II) is expected to generate ECCD signals in the region of the ligand transitions. In the UV region of the spectrum in Figure 10, bisignate CD signals are apparent with cross-over points corresponding to the λmax of the UV-vis spectrum around 315 nm, which is typical of exciton coupling. Quantum-mechanical calculations were run with both TDDFT and semi-empirical (ZINDO) methods on a model for imine 4 (with R= CH3, namely, 2-((methylimino)methyl)pyridin-3-ol or MBI). In all cases a single strong electric-dipole allowed π-π* transition was predicted around 300 nm, localized on the 2-iminopyridine chromophore, and directed approximately along the bond between imine and 2-pyridine carbon atoms. The arrangement of the transition dipoles for Δ and Λ complexes is shown in Figure 9. For octahedral D3-symmetric tris-bidentate metal complexes with transition dipoles oriented parallel to the edges spanned by the ligands, exciton theory predicts the Δ configuration is associated with a negative exciton couplet, and vice-versa.47–49 A CD couplet is defined negative if the first or long-wavelength Cotton effect is negative. The similarity with the present Fe(II) complexes suggests the same correlation holds. It can be concluded that the major species observed for MBI-Fe(II) complex, namely, the S-MBI-Δ-fac diastereomer, is responsible for a negative ECCD couplet around 315 nm, which is in agreement with the crystal structure and DFT geometry optimizations, as well as with studies done by Howson et al.42
Figure 10.
UV-vis and CD spectra of the MLCT bands for the three different imines studied, MBI (0.9mM), CEI (1.8mM), and HPI (2.3mM), at 100% and −100% ee in acetonitrile with 0.3mM Fe(II) in a 0.1cm quartz cell from 200–400nm.
Figure 9.
The helical arrangement of the transition dipoles that couple giving rise to the positive and negative ECCD couplets for the Δ-R and Λ-S fac isomers, respectively.
Such a conclusion may be extended to other imines too. Thus, imines with an R or S stereogenic center induce a Λ or Δ helicity around Fe(II), respectively, which leads to a predictable ECCD couplet (Figure 10). It can be seen in Figure 10 that the signs of the ECCD in the UV region correlate with the identity of the stereogenic center of the imine. Complexes containing imines with the R stereogenic center have a negative ECCD couplet and those with an S stereogenic center have a positive ECCD couplet.
Imines derived from amines with similar functionality should follow the same pattern. As previously mentioned, the three amines span the aromatic, cyclic, and acyclic range of chemical space, and thus, it is reasonable to assume the system would behave the same with most simple α-chiral amines.
The CD signals corresponding to charge transfer bands in the visible portion of the spectrum are also bisignate (Figure 11) and one may wonder if they arise from an ECCD mechanism too. Interestingly enough, D3-symmetric tris-bidentate Fe(II) complexes with typical α-diimine ligands such as 1,10-phenantroline (phen) and 2,2'-bipyridine (bipy) also show a bisignate CD feature in the 450–600 nm region of the same sign of the present imine complexes. In fact, Λ-[Fe(phen)3]2+ and Λ-[Fe(bipy)3]2+ both show a first negative Cotton effect around 550 nm and a second positive one around 470 nm; they are followed by a third, negative Cotton effect just below 400 nm.48 Interpretation of these CD signals is, however, controversial. In particular, the CD band at the highest wavelength, which is missing in the spectra of corresponding Ru(II) and Os(II) complexes, has been interpreted as due to a 3d-3d transition mixed with charge-transfer ones.48,50 The second and third CD bands are due to two d-π* (MLCT) transitions, although recent TDDFT calculations have reversed the assignment between the first and third band.45,46 These latter reports, however, clearly demonstrate that TDDFT methods have inherent difficulty in treating transitions involving strong participation from 3d electrons. In all cases, following these calculations, one can rule out that the origin of the visible CD bands of [Fe(phen)3]2+ and [Fe(bipy)3]2+ is due to exciton coupling of d-π* transitions, because they lack the proper symmetry and/or dipole strength requirements for ECCD.48,50
Figure 11.
UV-vis and CD spectra of the MLCT bands for the three different imines studied, MBI (3mM), CEI (6mM), and HPI (7mM), at 100% and −100% ee in acetonitrile with 1mM Fe(II) in a 0.1cm quartz cell from 400–700nm.
CD Calculations
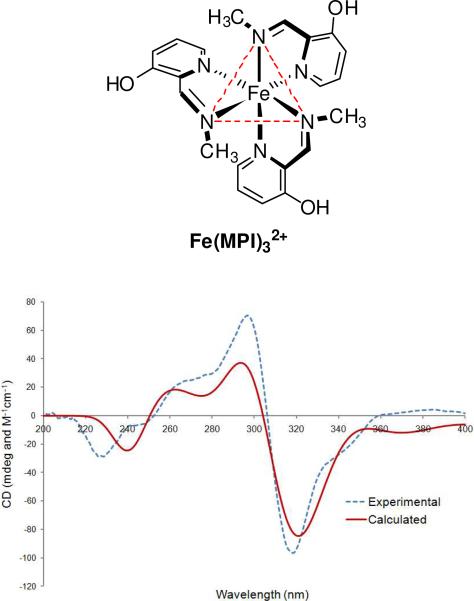
Calculations of CD spectra of Fe(II) complexes were run with the TDDFT method,51 at the same level used for geometry optimizations, as suggested by the literature.44–46 The input geometries for CD calculations were obtained from the low-energy structures of the various diastereomers for (S-S-S)-MPI-Fe(II) complexes, upon replacing the R-group with methyl (thus building the tris MPI-Fe(II) complex) and re-optimizing. This truncation simplified the calculation, which would be otherwise excessively demanding, and it is justified by the similarity between all of the CD spectra for the various imine ligands (Figures 10 and 11), which demonstrates that the R-groups provide weak spectroscopic contributions. The calculated CD spectrum for the Δ-fac diastereomer of the MBI-Fe(II) complex is shown in Figure 11. In the UV region, it nicely reproduces the main experimental features, in particular, the negative ECCD couplet around 315 nm, further confirming the absolute configuration of the complex as established by the exciton analysis above. Importantly, when other diastereomers were considered in the calculations (see Supporting Information for details), the average calculated spectrum still showed a negative couplet in the ligand UV region. Population analysis and inspection of relevant Kohn-Sham orbitals support the ECCD nature of the spectrum in this region. In fact, all transitions computed between 280–330 nm are mainly combinations of ligand-centered π-π* excitations. Moreover, the two transitions with largest opposite rotational strength (negative at 300 nm, and positive at 325 nm) have different symmetry (E and A, respectively, of the C3 point group), as required for ECCD.
In the visible region, the calculations also led to a bisignate CD feature though with opposite sign with respect to the experiment as far as the Δ-fac diastereomer is concerned (not shown). The discrepancy was not alleviated after considering the contributions from other diastereomers. Similar failures in CD TDDFT predictions in the MLCT region have been observed for [Fe(phen)3]2+ and [Fe(bipy)3]2+ when compared with Ru(II) and Os(II) complexes,45,46 and have been extensively discussed by the authors. For our purposes, it is interesting to note that population and orbital analysis revealed the two calculated CD bands between 500–700 nm both arise due to the combination of d-to-π* transitions involving the two lowest-energy and degenerate dπ orbitals. Moreover, both transitions have the same E symmetry, therefore they cannot represent two ECCD components.
Enantiomeric Excess Determination
As discussed, calibration curves were constructed by varying the ee at concentrations above saturation for all three imines. The curves were fit using the spreadsheet software Microsoft® Excel®. Because the shapes of the curves were sigmoidal, a third degree polynomial regression was used for fitting.
Unknowns for all three imines at a variety of ee values and concentrations were prepared. The primary optical data was input into the third degree polynomial and used to solve for ee. The results, summarized in Table 2, further demonstrate the concentration independence of the calibration curves. If the calibration curves were concentration dependent, it would be expected that the error would be lowest for the calculation of ee at or near the concentration the calibration curve was developed at. However, this is not observed. For example, the calibration curve for HPI was developed at 6mM, and the absolute error is lower for test samples not done at 6mM (Table 2).
Table 2.
A list of the actual ee's as calculated from enantiomerically pure solutions and those determined using the assay (Experimental ee).
| Analyte | Concentration (mM) | Actual ee | Experimental ee | Absolute error |
|---|---|---|---|---|
| MBI | 3.2 | −51.0 | −48.9 | 2.1 |
| 3.2 | 32.0 | 30.3 | 1.7 | |
| 3.5 | −58.0 | −52.6 | 5.4 | |
| 3.5 | 38.0 | 35.0 | 3.0 | |
| 4.1 | −56.0 | −48.7 | 7.3 | |
| 4.1 | 75.6 | 68.7 | 6.9 | |
| 4.3 | −51.0 | −46.2 | 4.8 | |
| 4.3 | 22.0 | 20.2 | 1.8 | |
| 5 | −30.0 | −25.4 | 4.6 | |
| 5 | 52.0 | 47.3 | 4.7 | |
| Analyte | Concentration (mM) | Actual ee | Experimental ee | Absolute error |
| CEI | 7.2 | −75.0 | −62.0 | 13.0 |
| 7.2 | 45.0 | 38.5 | 6.5 | |
| 7.5 | −66.2 | −58.7 | 7.5 | |
| 7.5 | −68.6 | −61.2 | 7.4 | |
| 8.3 | −28.2 | −28.5 | 0.3 | |
| 8.3 | 84.8 | 79.6 | 5.2 | |
| 8.6 | 10.4 | 9.0 | 1.4 | |
| 8.6 | 100 | 100.4 | 0.4 | |
| 9 | 30.0 | 30.4 | 0.4 | |
| 9 | −52.0 | −60.3 | 8.3 | |
| Analyte | Concentration (mM) | Actual ee | Experimental ee | Absolute error |
| HPI | 4.2 | −57.2 | −63.5 | 6.3 |
| 4.2 | 71.4 | 60.9 | 10.5 | |
| 4.6 | −11.6 | −14.9 | 3.3 | |
| 4.6 | 35.0 | 28.8 | 6.2 | |
| 5.3 | −77.2 | −78.0 | 0.8 | |
| 5.3 | 47.8 | 42.3 | 5.5 | |
| 5.6 | −57.0 | −62.3 | 5.3 | |
| 5.6 | 29.0 | 21.8 | 7.2 | |
| 6.0 | −10.0 | −18.5 | 8.5 | |
| 6.0 | −80.0 | −85.6 | 5.6 | |
The average absolute error for the assay was calculated and determined to be ±5%. As discussed in previously published work,31,33 we consider an absolute error even as large as ±15% to be useful in a rapid screening protocol. The accuracy of the system reported here is well within this limit.
Summary
There were several shortcomings with our previously reported assay for the determination of absolute configuration and ee of chiral amines (Scheme 1). Namely, the imine formation was slow, there was a need for host synthesis, the error was moderately high, and it required the use of an artificial neural network to calculate ee at different concentrations. In order to overcome the slow imine formation, aldehyde 4 was used instead of 1, which reduced the time for imine formation from several hours to 10 seconds. The need for host synthesis was replaced by using self-assembly to bring together several chromophores with Fe(II). The moderately high error associated with our previous system was overcome by increasing the signal-to-noise by using a strongly absorbing charge transfer band present in 6 to develop calibration curves and analyze unknowns. Lastly, an artificial neural network was not necessary because the assay is concentration independent above saturation, as determined by UV-vis titrations.
Calibration curves developed for the system had a sigmoidal shape, and it was shown that the shape arises from a probabilistic distribution of stereogenic centers around Fe(II). The major species for the tris-imiine Fe(II) complex were characterized by NMR and DFT geometry optimizations. A UV-CD active band could be used to determine the absolute configuration of amines by correlating with the sign of the ECCD couplet. The correlation was proved by exciton-chirality analysis and TDDFT CD calculations. A charge transfer band in the visible region could be used to develop calibration curves for the determination of ee of unknown samples with an average accuracy of ±5%. Currently, the protocol is being transitioned to aid in the discovery of asymmetric catalysts in collaboration with synthetic methodology chemists.
Supplementary Material
Figure 12.
TDDFT calculated UV-CD spectrum of Δ-fac-MBI-Fe(II) complex (shown in the diagram), BPV86/TZVP+Lan2DZ(Fe)//BPV86/TZVP+Lan2DZ(Fe) level, compared with experimental CD spectrum for (S-S-S)-MBI-Fe(II) complex. Calculated spectrum is a sum of Gaussians with 0.22 eV exponential-half width, and is blue-shifted by 25 nm.
Acknowledgements
NIH GM77437, Welch F-1151, Thanks to Damien Jouvenot for informal conversations with Justin Dragna that led to the initial idea for this project. Thanks to James Canary for putting Eric Anslyn in contact with Dr. Di Bari. Special thanks to Bruce and Corinne Gibb for their wisdom and encouragement throughout Justin Dragna's career.
Footnotes
Supporting Information Available: Experimental details for the preparation of calibration curves, calculations for probability, calculations for CD curves in the visible region, NMR data, and crystallography data – This information is available free of charge via the internet at http://pubs.acs.org/.
References
- (1).Nakanishi K, Berova N. In: Circular Dichroism: Principles and Applications. Nakanishi K, Berova N, Woody RW, editors. VCH Publishers; New York: 1994. p. 361. [Google Scholar]
- (2).Boeckman RK, Ferreira MDR, Mitchell LH, Shao PC. J. Am. Chem. Soc. 2002;124:190. doi: 10.1021/ja017194i. [DOI] [PubMed] [Google Scholar]
- (3).Benohoud M, Leman L, Cardoso SH, Retailleau P, Dauban P, Thierry J, Dodd RH. J. Org. Chem. 2009;74:5331. doi: 10.1021/jo900800x. [DOI] [PubMed] [Google Scholar]
- (4).Batista JM, Batista ANL, Rinaldo D, Vilegas W, Ambrosio DL, Cicarelli RMB, Bolzani VS, Kato MJ, Nafie LA, Lopez SN, Furlan M. J. Nat. Prod. 2011;74:1154. doi: 10.1021/np200085h. [DOI] [PubMed] [Google Scholar]
- (5).Matile S, Berova N, Nakanishi K, Novkova S, Philipova I, Blagoev B. J. Am. Chem. Soc. 1995;117:7021. [Google Scholar]
- (6).Harada N, Nakanishi K. J. Am. Chem. Soc. 1969;91:3989. doi: 10.1021/ja01049a047. [DOI] [PubMed] [Google Scholar]
- (7).Cai G, Bozhkova N, Odingo J, Berova N, Nakanishi K. J. Am. Chem. Soc. 1993;115:7192. [Google Scholar]
- (8).Kim H, So SM, Yen CP-H, Vinhato E, Lough AJ, Hong J-I, Kim H-J, Chin J. Angew. Chem. Int. Ed. Engl. 2008;47:8657. doi: 10.1002/anie.200803116. [DOI] [PubMed] [Google Scholar]
- (9).Iwaniuk DP, Wolf C. J. Am. Chem. Soc. 2011;133:2414. doi: 10.1021/ja111583e. [DOI] [PubMed] [Google Scholar]
- (10).Ghosn MW, Wolf C. J. Am. Chem. Soc. 2009;131:16360. doi: 10.1021/ja907741v. [DOI] [PubMed] [Google Scholar]
- (11).Yashima E, Nimura T, Matsushima T, Okamoto Y. J. Am. Chem. Soc. 1996;118:9800. [Google Scholar]
- (12).Yashima E, Matsushima T, Okamoto Y. J. Am. Chem. Soc. 1997;119:6345. [Google Scholar]
- (13).Li X, Borhan B. J. Am. Chem. Soc. 2008;130:16126. doi: 10.1021/ja805058t. [DOI] [PubMed] [Google Scholar]
- (14).Dillon J, Nakanishi K. J. Am. Chem. Soc. 1975;97:5409. doi: 10.1021/ja00852a015. [DOI] [PubMed] [Google Scholar]
- (15).Dillon J, Nakanishi K. J. Am. Chem. Soc. 1975;97:5417. doi: 10.1021/ja00852a016. [DOI] [PubMed] [Google Scholar]
- (16).Nieto S, Dragna JM, Anslyn EV. Chem.-Eur. J. 2010;16:227. doi: 10.1002/chem.200902650. [DOI] [PMC free article] [PubMed] [Google Scholar]
- (17).Dillon J, Nakanishi K. J. Am. Chem. Soc. 1974;96:4059. [Google Scholar]
- (18).Dillon J, Nakanishi K. J. Am. Chem. Soc. 1974;96:4055. [Google Scholar]
- (19).Di Bari L, Lelli M, Pintacuda G, Salvadori P. Chirality. 2002;14:265. doi: 10.1002/chir.10030. [DOI] [PubMed] [Google Scholar]
- (20).Berova N. Chirality. 1997;9:395. doi: 10.1002/(SICI)1520-636X(1997)9:7<699::AID-CHIR11>3.0.CO;2-I. [DOI] [PubMed] [Google Scholar]
- (21).Traverse JF, Snapper ML. Drug Discovery Today. 2002;7:1002. doi: 10.1016/s1359-6446(02)02436-4. [DOI] [PubMed] [Google Scholar]
- (22).de Vries JG, Lefort L. Chem.-Eur. J. 2006;12:4722. doi: 10.1002/chem.200500819. [DOI] [PubMed] [Google Scholar]
- (23).Nieto S, Dragna JM, Anslyn EV. Chem.-Eur. J. 2010;16:227. doi: 10.1002/chem.200902650. [DOI] [PMC free article] [PubMed] [Google Scholar]
- (24).Shabbir SH, Regan CJ, Anslyn EV. Proc. Natl. Acad. Sci. USA. 2009;106:10487. doi: 10.1073/pnas.0809530106. [DOI] [PMC free article] [PubMed] [Google Scholar]
- (25).Zhu L, Zhong ZL, Anslyn EV. J. Am. Chem. Soc. 2005;127:4260. doi: 10.1021/ja0435945. [DOI] [PubMed] [Google Scholar]
- (26).Nieto S, Lynch VM, Anslyn EV, Kim H, Chin J. J. Am. Chem. Soc. 2008;130:9232. doi: 10.1021/ja803443j. [DOI] [PMC free article] [PubMed] [Google Scholar]
- (27).Shabbir SH, Joyce LA, da Cruz GM, Lynch VM, Sorey S, Anslyn EV. J. Am. Chem. Soc. 2009;131:13125. doi: 10.1021/ja904545d. [DOI] [PMC free article] [PubMed] [Google Scholar]
- (28).Leung D, Anslyn EV. Org. Lett. 2011;13:2298. doi: 10.1021/ol2004885. [DOI] [PMC free article] [PubMed] [Google Scholar]
- (29).Nieto S, Lynch VM, Anslyn EV, Kim H, Chin J. Org. Lett. 2008;10:5167. doi: 10.1021/ol802085j. [DOI] [PMC free article] [PubMed] [Google Scholar]
- (30).Joyce LA, Maynor MS, Dragna JM, da Cruz GM, Lynch VM, Canary JW, Anslyn EV. J. Am. Chem. Soc. 2011;133:13746. doi: 10.1021/ja205775g. [DOI] [PMC free article] [PubMed] [Google Scholar]
- (31).Leung D, Anslyn EV. J. Am. Chem. Soc. 2008;130:12328. doi: 10.1021/ja8038079. [DOI] [PMC free article] [PubMed] [Google Scholar]
- (32).Zhu L, Shabbir SH, Anslyn EV. Chem.-Eur. J. 2007;13:99. doi: 10.1002/chem.200600402. [DOI] [PubMed] [Google Scholar]
- (33).Leung D, Folmer-Andersen JF, Lynch VM, Anslyn EV. J. Am. Chem. Soc. 2008;130:12318. doi: 10.1021/ja803806c. [DOI] [PMC free article] [PubMed] [Google Scholar]
- (34).Ghosn MW, Wolf C. Tetrahedron. 2010;66:3989. [Google Scholar]
- (35).Li X, Tanasova M, Vasileiou C, Borhan B. J. Am. Chem. Soc. 2008;130:1885. doi: 10.1021/ja0752639. [DOI] [PubMed] [Google Scholar]
- (36).Kim H, So SM, Yen CPH, Vinhato E, Lough AJ, Hong JI, Kim HJ, Chin J. Angew. Chem. Int. Ed. Engl. 2008;47:8657. doi: 10.1002/anie.200803116. [DOI] [PubMed] [Google Scholar]
- (37).Huang XF, Fujioka N, Pescitelli G, Koehn FE, Williamson RT, Nakanishi K, Berova N. J. Am. Chem. Soc. 2002;124:10320. doi: 10.1021/ja020520p. [DOI] [PubMed] [Google Scholar]
- (38).Kurtan T, Nesnas N, Li YQ, Huang XF, Nakanishi K, Berova N. J. Am. Chem. Soc. 2001;123:5962. doi: 10.1021/ja010249w. [DOI] [PubMed] [Google Scholar]
- (39).Kurtan T, Nesnas N, Koehn FE, Li YQ, Nakanishi K, Berova N. J. Am. Chem. Soc. 2001;123:5974. doi: 10.1021/ja010250v. [DOI] [PubMed] [Google Scholar]
- (40).Huang XF, Rickman BH, Borhan B, Berova N, Nakanishi K. J. Am. Chem. Soc. 1998;120:6185. doi: 10.1002/(SICI)1521-3765(20000117)6:2<216::AID-CHEM216>3.0.CO;2-1. [DOI] [PubMed] [Google Scholar]
- (41).Howson SE, Allan LEN, Chmel NP, Clarkson GJ, van Gorkum R, Scott P. Chem. Commun. 2009:1727. doi: 10.1039/b821573a. [DOI] [PubMed] [Google Scholar]
- (42).Chen Z, Wannere CS, Corminboeuf C, Puchta R, Schleyer P. v. R. Chem. Rev. 2005;105:3842. doi: 10.1021/cr030088+. [DOI] [PubMed] [Google Scholar]
- (43).Rudolph M, Autschbach J. J. Phys. Chem. A. 2011;115:2635. doi: 10.1021/jp111484z. [DOI] [PubMed] [Google Scholar]
- (44).Le Guennic B, Hieringer W, Görling A, Autschbach J. J. Phys. Chem. A. 2005;109:4836. doi: 10.1021/jp0444363. [DOI] [PubMed] [Google Scholar]
- (45).Fan J, Autschbach J, Ziegler T. Inorg. Chem. 2010;49:1355. doi: 10.1021/ic9011586. [DOI] [PubMed] [Google Scholar]
- (46).Mason SF. Molecular optical activity and the chiral discrimination. Cambridge University Press; Cambridge: 1982. [Google Scholar]
- (47).Mason SF. Inorg. Chim. Acta. 1968;2:89. [Google Scholar]
- (48).Bosnich B. Acc. Chem. Res. 1969;2:266. [Google Scholar]
- (49).Daul C, Schlaepfer CW. J. Chem. Soc., Dalton Trans. 1988:393. [Google Scholar]
- (50).Autschbach J, Nitsch-Velasquez L, Rudolph . In: Topics in Current Chemistry. M., Naaman R, Beratan DN, Waldeck D, editors. Vol. 298. Springer; Berlin / Heidelberg: 2011. p. 1. [DOI] [PubMed] [Google Scholar]
Associated Data
This section collects any data citations, data availability statements, or supplementary materials included in this article.


