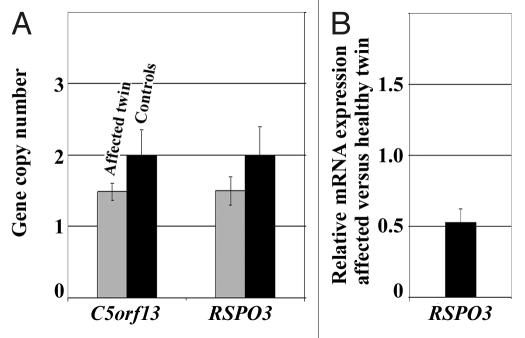
Figure 4. (A) C5orf13 and RSPO3 copy numbers in fibroblast cells of the two-cancer twin, compared with healthy controls, as determined by qPCR (using the RFC3 gene copy number as reference). Standard deviations represent three independent DNA samples (biological replicates) of the affected twin and a mixture of control DNAs. (B) RSPO3 mRNA expression ratio between the affected twin and her healthy sister, as determined by GeneAtlas microarrays. Standard deviations represent RNA samples from four different cell cultures of the affected and the healthy twin, respectively.

An official website of the United States government
Here's how you know
Official websites use .gov
A
.gov website belongs to an official
government organization in the United States.
Secure .gov websites use HTTPS
A lock (
) or https:// means you've safely
connected to the .gov website. Share sensitive
information only on official, secure websites.
