Summary
The TCA cycle is the central hub of oxidative metabolism, running in the classic forward direction to provide carbon for biosynthesis and reducing agents for generation of ATP. Our metabolic tracer studies in melanoma cells showed that in hypoxic conditions the TCA cycle is largely disconnected from glycolysis. By studying the TCA branch point metabolites, acetyl CoA and citrate, as well as the metabolic endpoints glutamine and fatty acids, we developed a comprehensive picture of the rewiring of the TCA cycle that occurs in hypoxia. Hypoxic tumor cells maintain proliferation by running the TCA cycle in reverse. The source of carbon for acetyl CoA, citrate, and fatty acids switches from glucose in normoxia to glutamine in hypoxia. This hypoxic flux from glutamine into fatty acids is mediated by reductive carboxylation. This reductive carboxylation is catalyzed by two isocitrate dehydrogenases, IDH1 and IDH2. Their combined action is necessary and sufficient to effect the reverse TCA flux and maintain cellular viability.
Introduction
Many metabolic routes are rewired in tumors to accommodate the need for biosynthetic precursors. The Warburg effect, the most cited change in tumor metabolism, involves increased consumption of glucose along with a corresponding increase in the production of lactate (Warburg, 1923; Warburg, 1956). This takes place even in the presence of oxygen, hence much of the energy produced by the tumor cell is derived from glycolysis. Other branches of central carbon metabolism are also altered in tumor cells, including up-regulation of serine and fatty acid biosynthesis (Flavin et al., 2010; Kridel et al., 2004; Locasale et al., 2011; Possemato et al., 2011). Most of these changes have been observed in studies done in normoxia, so far less is known about transitions in metabolic carbon flux resulting from hypoxia. In a recently published study we found that hypoxia induces an adaptive metabolic transition in melanoma cells (Scott et al., 2011). This adaptation is particularly relevant to fatty acid biosynthesis because the pyruvate dehydrogenase complex, which generates the fatty acid precursor acetyl CoA, is down-regulated by hypoxia inducible factor-1a (Kim et al., 2006). These findings suggested the possibility that metabolic adaptation to hypoxia involves a switch from glucose to the alternative nutrient glutamine as a source of carbon for synthesis of fatty acids.
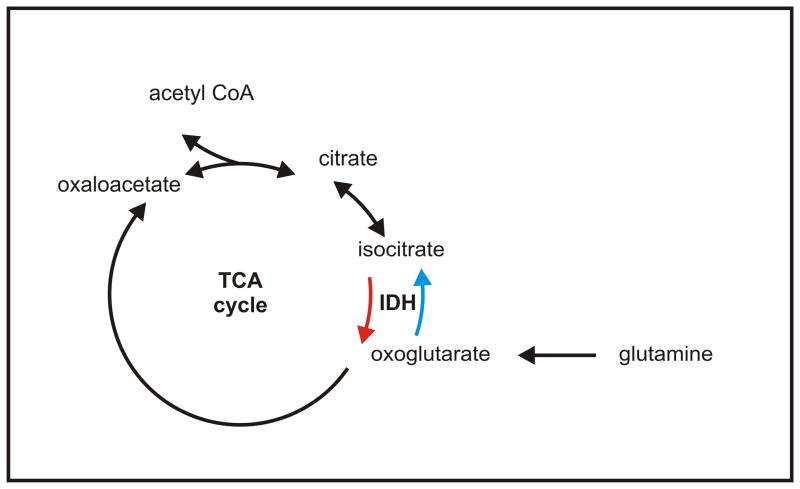
Glutamine has been recognized to play a role similar to glucose as it is used to generate ATP and provide precursors for biosynthetic reactions. In this way, glutamine can be routed through the tricarboxylic acid (TCA) cycle to maintain oxidative phosphorylation, a process called glutaminolysis (DeBerardinis et al., 2007; McKeehan, 1982; Wise et al., 2008). But tumor cells could also route glutamine through another metabolic pathway, where carbon travels through the TCA cycle in reverse (Dalziel and Londesborough, 1968). In this path, glutamine enters the TCA cycle as oxoglutarate and undergoes reductive carboxylation by isocitrate dehydrogenases (IDHs) to produce isocitrate. Isocitrate is converted to citrate by the reverse reaction of aconitases, making the carbon available for ATP citrate lyase, which produces acetyl CoA (Fig. 1). This reverse (reductive) flux is more important than initially anticipated (Koppenol et al., 2011; Scott et al., 2011), especially because carbons from glutamine can be found in fatty acids (Gaglio et al., 2011). Reductive carboxylation has been detected in liver and heart (Comte et al., 2002; Comte et al., 1997; Des Rosiers et al., 1994), and glutamine is a major carbon source for fatty acid synthesis in brown adipocytes (Yoo et al., 2008). Despite the evidence for reverse flux of carbon from glutamine through the TCA cycle, its significance to melanoma remains unclear. In this report, we explore the possibility that reverse (reductive) flux through IDHs is necessary for fatty acid biosynthesis by melanoma cells in hypoxia.
Figure 1. Forward (oxidative) and reverse (reductive) flux through the TCA cycle.
A model of the TCA cycle running in the forward (red) and reverse (blue) directions.
Three genes encode the IDHs (Bell and Baron, 1968). IDH1 is localized in the cytoplasm, and IDH2 and IDH3 are localized in mitochondria (Bell and Baron, 1968). IDH3 differs from the other two IDHs because it functions as a heterotetramer comprised of two alpha subunits, one beta subunit, and one gamma subunit. IDH3 is regulated allosterically by ATP, NADH and NADPH (Bell and Baron, 1968; Bell et al., 1962; Bzymek and Colman, 2007; Reynolds et al., 1978), and prefers NAD as a cofactor. In contrast to IDH3, IDH1 and IDH2 function as homodimers, use NADPH as a cofactor, and lack allosteric effectors. IDH1 and IDH2 catalyze the first step in the reductive carboxylation pathway of originating from glutamine. They produce isocitrate from oxoglutarate by reductive carboxylation (Dalziel and Londesborough, 1968). Here we show that because of this reaction, glutamine becomes an important source of carbon for fatty acids in melanoma cells cultured in hypoxic conditions. Consequently, reductive carboxylation by IDHs could be significant to the pathology of melanoma.
Results
The source of carbon for acetyl CoA differs between normoxia and hypoxia
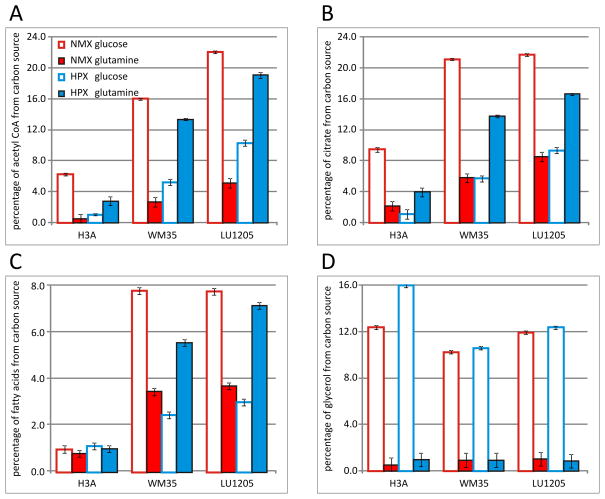
One objective of this study was to compare glucose and glutamine utilization in normoxic conditions (21 % oxygen) versus hypoxic conditions (1 % oxygen). We compared the incorporation of carbon from glucose and glutamine into lipogenic metabolites in melanocytes (H3A) versus melanoma cells (WM35 and LU1205). These experiments were performed with isotopically labeled (13C) precursors at pre-steady state conditions to gauge the rate of carbon incorporation into citrate, acetyl CoA, fatty acids and glycerol (Fig. 2). In normoxia, glucose is the main source of carbon for acetyl CoA in all three cell types. However, in hypoxia, flux from glucose to acetyl CoA is dramatically reduced and glutamine becomes the major contributor of carbon (Fig. 2A). Flux to citrate has the same trend (Fig. 2B). While flux from glutamine to acetyl CoA is observed in both melanocytes and melanoma cells, melanocytes use substantially less glucose or glutamine than melanoma cells.
Figure 2. Glutamine compensates for lower glycolytic flux into the acetyl CoA pool in hypoxia.
Flux into polar metabolites and lipids was determined as percentage of metabolite derived from input carbon source, glucose or glutamine, by NMR spectroscopy in H3A melanocytes, WM35 and LU1205 melanoma cells for acetyl CoA (A), citrate (B), fatty acids (C), and glycerol (D) under normoxia (red, NMX = 21% O2) and hypoxia (blue, HPX = 1% O2). Input substrates were 50% [U-13C]-labeled glucose (blank bars) or glutamine (filled bars). The flux into a particular metabolite is represented as metabolite labeling divided by input substrate labeling. The glycerol head group of glycerophospholipids was detected in the lipid fraction of chloroform-extracted metabolites and serves as an in-sample control for stable isotope incorporation into lipids. The signal was averaged over all 1H, 13C detectable carbons of the observed metabolite. Specifically, those were carbon 2 of acetyl CoA, carbons 2 and 4 of citrate, carbons 1–3 of glycerol, and carbons 2–7, ω-2, ω-1, and ω of fatty acids.
Next we measured the incorporation of 13C from glutamine or glucose into saturated fatty acids of the lipid fraction of cells. The H3A melanocytes exhibit no significant fatty acid biosynthesis in normoxia or hypoxia (Fig. 2C). In melanoma cells carbon from both precursors is observed in fatty acids, but in hypoxia the contribution of glucose carbon to fatty acids is decreased by about half, whereas the contribution from glutamine increases two-fold (Fig. 2C). As a control, we measured the incorporation of isotope into the polar glycerol headgroup of lipids where the carbons are derived from glycolysis (Fig. 2D). Thus, while glutamine becomes the primary source of carbon for fatty acids, it is not metabolized for the synthesis of glycerol headgroups.
Citrate is generated from glutamine by reductive carboxylation in hypoxia
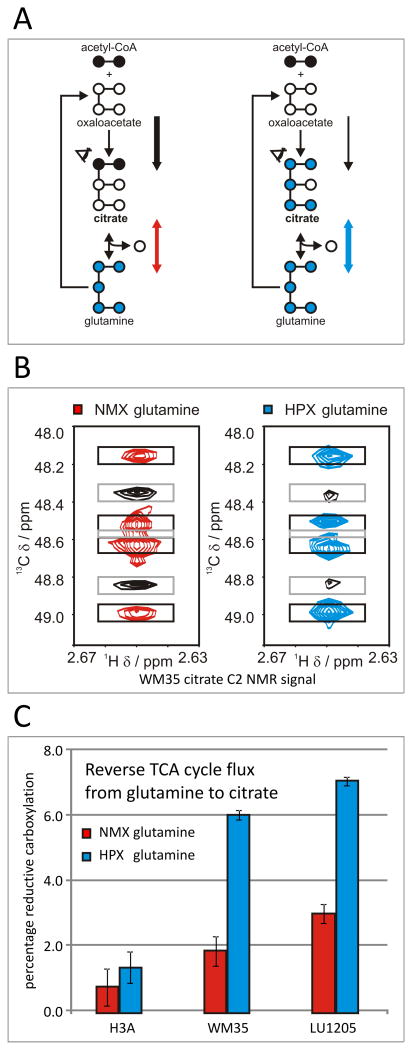
There are two major routes by which carbon from glutamine could enter the acetyl CoA pool; one, by glutaminolysis wherein glutamine enters and traverses the TCA cycle in the forward direction, or two, by reverse flux through IDHs to citrate. These two possibilities can be distinguished using [U-13C]-glutamine because the two routes generate different isotopic labeling of citrate (Fig. 3A). In the case where [U-13C]-glutamine travels via the TCA cycle via glutaminolysis, its carbon backbone is broken into separate pieces. This is evident because the NMR coupling pattern of C2 of citrate is dominated by singlet and doublet signals of carbon fragments. However, in the case of direct flux to citrate, the carbon backbone of glutamine remains intact, and the NMR coupling of C2 is a doublet of doublets. In brief, forward, oxidative flux from acetyl CoA or oxaloacetate results in singlets or doublets, but reverse, reductive flux from oxoglutarate generates doublets of doublets (Fig. 3B). WM35 and LU1205 melanoma cells showed a predominant doublet of doublets in hypoxia, indicating that the majority of carbon from [U-13C]-glutamine is routed in the direction of reductive carboxylation from oxoglutarate. While some citrate was synthesized via the reductive IDH route in normoxia, the contribution of this route to citrate synthesis (relative to total synthesis) nearly tripled in hypoxia in the melanoma cell lines (Fig. 3C).
Figure 3. Carbon connectivity reveals reverse (reductive) flux from glutamine into citrate.
A) Citrate can be used as a reporter metabolite to quantify and compare forward (oxidative) flux in comparison to reverse (reductive) flux. When flux to citrate is predominantly in the forward direction (black arrow, left diagram), carbon C2 of citrate (eye symbol) originates principally from acetyl-CoA units, when they condense with oxaloacetate. In this case, C1 and C2 have a common origin (black shading from acetyl CoA), but differ from the rest of the molecule. In contrast, when citrate is primarily derived from reverse (reductive) flux from glutamine, C1 to C5 are all have the same origin (blue shading from glutamine). When carbon is isotopically labeled, the NMR spectra of C2 can distinguish and quantify these two possibilities.
B) NMR spectra of carbon C2 of citrate in WM35 cells under normoxia (left diagram), and hypoxia (right diagram). In both spectra, the doublet signal arising from linkage (common origin) of C1 to C2 only is shown in black, and the doublet of doublets signal arising from linkage of labeled carbons (common origin) is shown under normoxia (red), and hypoxia (blue). In hypoxia the colored signal is higher relative to the black signal and indicates a shift from forward to reverse flux of glutamine through the TCA cycle.
C) The fraction of citrate originating from glutamine by reverse (reductive) flux is calculated from the ratio of doublet of doublets to singlet and doublets. Results are shown for H3A melanocytes, WM35 and LU1205 melanoma in normoxia (NMX, red) vs. hypoxia (HPX, blue).
The metabolic flux from glutamine into fatty acids is routed through IDH1 and IDH2
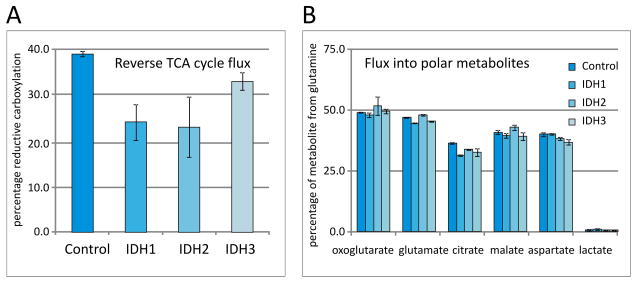
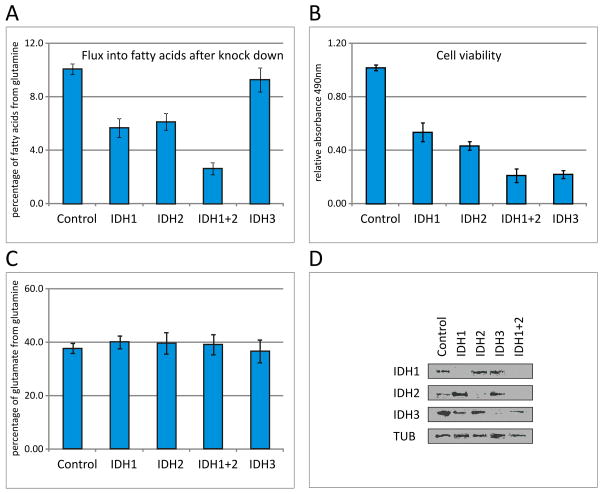
We sought to determine which of the three human IDHs is responsible for the reductive flux from glutamine into citrate and ultimately into acetyl CoA. This was accomplished by siRNA knockdown of each IDH and a subsequent assessment of flux from glutamine into fatty acid. These experiments were done in WM35 and LU1205 melanoma cells under hypoxic conditions. Knockdown of either IDH1 or IDH2 in LU1205 cells reduced reductive carboxylation and showed contribution of both enzymes in the reductive direction (Fig. 4A), but general metabolic flux into polar metabolites including organic acids and TCA cycle intermediates oxoglutarate, citrate, and malate was not significantly changed (Fig. 4B). As a next step, we tested the combined role of IDH1 and IDH2 as well as the impact of this route on the metabolic endpoint fatty acids. In WM35 cells, knockdown of either IDH1 or IDH2 individually reduced flux from glutamine into fatty acids by about 50% (Fig. 5A), but the combined knockdown reduced flux by more than 80%. Perhaps not surprisingly, knockdown of IDH1 and 2 also reduced cell viability, and the combined knockdown reduced viability by nearly 80% (Fig. 5B). The incorporation of stable isotope label into glutamate from glutamine showed that central carbon metabolism was still functioning despite knockdown of IDH isozymes (Fig. 5C). Specific knockdown of each IDH was confirmed by Western blot (Fig. 5D).
Figure 4. Knockdown of IDH1 and IDH2 reduces reverse, reductive flux in hypoxia.
The effect of siRNA knockdown of IDH1 and IDH2 on reverse TCA cycle flux was measured in LU1205 cells in hypoxia. (A) Reverse TCA cycle flux was determined as reductive carboxylation into citrate and is provided as relative measure to total input into citrate via reductive or oxidative TCA cycle. Relative inputs to citrate were calculated by using the oxaloacetate and acetyl CoA mass distributions for forward input and glutamate mass distribution plus unlabeled CO2 for the reverse input. Data of are averages from duplicate determinations by GCMS. (B) Percentage of metabolites derived from glutamine in LU1205 melanoma cells subject to knockdown of IDH isoforms. Data represent the 13C labeling of metabolites averaged over all carbon atoms within metabolites, divided by 50% [U-13C] input glutamine labeling.
Figure 5. IDH1 and IDH2 are the carriers of reverse, reductive flux in hypoxia.
The effect of siRNA knockdown of IDH1, IDH2, and their combination, in WM35 cells under hypoxia was monitored by NMR spectroscopy. (A) Flux into fatty acids from glutamine was measured as percentage of fatty acids derived from input glutamine at carbons 2–7, ω-2, ω-1, and ω saturated fatty acids. Measured percentage of stable isotope labeling is divided by 50% [U-13C] labeling of input carbon source to arrive at the displayed flux value. (B) Cell viability was measured by absorbance in a 3-(4,5-dimethylthiazon-2-yl)-5-(3-carboxymethoxyphenyl)-2-(4-sulfophenyl)-2H-tetrazolium salt (MTS) assay in 96-well dishes in triplicates and is reported relative to the WM35 cell cultures transfected with scrambled siRNA. (C) Flux into glutamate is measured as percentage of metabolite from glutamine considering 50% [U-13C] labeling of input carbon source. (D) The efficiency of knockdown of each IDH was quantified by Western blot with level of tubulin as loading control.
Reductive carboxylation from glutamine is a general feature of melanoma metabolism
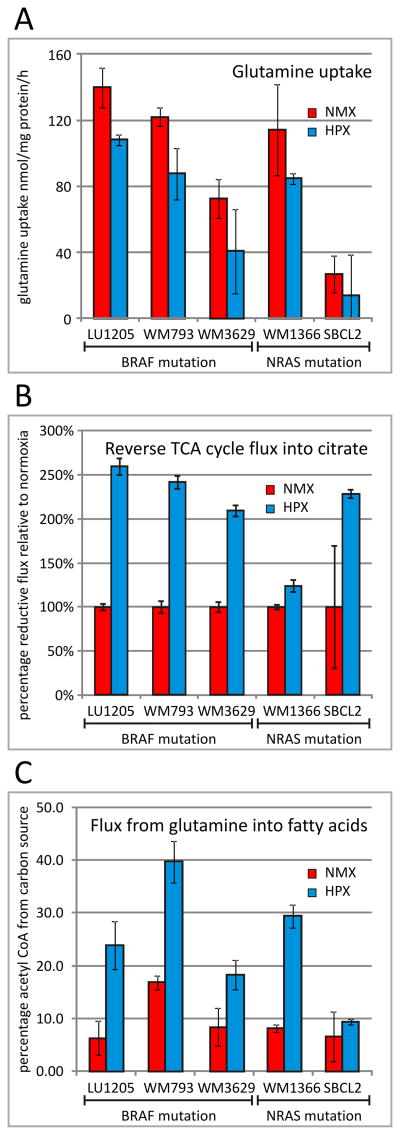
To determine if reductive carboxylation of glutamine and subsequent routing of carbon into fatty acids is a common feature of the metabolism of melanoma cells, we studied four additional melanoma cell lines (Fig. 6). Three parameters were determined, uptake of glutamine, the extent of reductive flux, and the relative incorporation of carbon from glutamine into acetyl-CoA in fatty acids. Each of the melanoma lines utilized glutamine, although the level of uptake differed by as much as sixfold. Uptake was slightly less under hypoxia compared to normoxia (Fig. 6A). Hence glutamine usage alone is not a strong indicator of reverse, reductive TCA flux. The relative amount of citrate synthesized by reductive carboxylation was higher in all cell lines under hypoxia (Fig. 6B). In most cases, the proportion of citrate produced by reductive carboxylation increased at least 2-fold with hypoxia. The labeling of acetyl CoA units in fatty acids from glutamine was elevated in hypoxia for all cell types (Fig. 6C). We must point out that the low glutamine uptake caused weak labeling of metabolites of the SBCL2 cell line. However, the general trend that reductive carboxylation is enhanced in SBCL2 is consistent with other cell lines. Together these findings indicate that in hypoxia the compensatory reductive flux from glutamine toward fatty acids is a general feature in melanoma cells.
Figure 6. Profiling of melanoma cell lines shows flux from glutamine into fatty acids through reductive carboxylation.
(A) Glutamine uptake. (B) Relative fraction of citrate synthesized via reverse (reductive) TCA cycle route from [U-13C]-glutamine compared for cells in normoxia and hypoxia with data normalized to normoxia values. (C) Flux from [U-13C]-glutamine into acetyl CoA units present in fatty acids in normoxia (NMX) and hypoxia (HPX). Stable isotope incorporation from 50% [U-13C]-glutamine was determined by GCMS.
Discussion
The results of this study support the following conclusions on glutamine metabolism of melanoma cells in hypoxia: i) acetyl CoA required for fatty acid biosynthesis is derived from glutamine by reverse flux through the TCA cycle, ii) IDH1 and IDH2 each contribute to this reverse flux, and iii) reverse flux through IDH1 and IDH2 is necessary for melanoma cell viability. Our first finding is that the majority of fatty acids synthesized in melanoma cells under hypoxic conditions are derived from glutamine. Carbon from glutamine is routed through reverse flux of the TCA cycle to produce citrate, and ultimately acetyl CoA (Fig. 7). This metabolic pathway is distinct from glutaminolysis, where glutamine is used for production of energy rather than for biosynthesis. Our measurements show that despite different levels of glutamine uptake among melanoma cell lines, they all use reverse TCA flux through IDHs when exposed to hypoxic conditions. Increased utilization of glutamine as a carbon source for fatty acid biosynthesis was observed in melanoma lines harboring mutations in B-Raf and N-Ras. As a general property then, when the supply of oxygen is limiting, the ability of melanoma cells to run one section of the TCA cycle in reverse ensures that cellular fatty acid synthesis is maintained. This is in contrast to melanocytes, where the 13C incorporation into fatty acids was on the order of natural abundance enrichment in normoxia and hypoxia indicating lack of de novo fatty acid synthesis. While the switch of carbon source for acetyl CoA and citrate is similar in melanocytes and melanoma cell lines, this reductive flux only translated into fatty acids in melanoma cells because melanocytes do not synthesize fatty acids. The general validity of this hypoxic switch in combination with the importance of flux into fatty acids, which is elevated in cancer cells (Kridel et al., 2004), may create a therapeutic opportunity. Our second and third conclusions address the contribution of IDH1 and IDH2 to reverse flux. We show that knockdown of either IDH1 or IDH2 lowers reverse TCA cycle flux. While we cannot exclude the possibility that knockdown of one IDH isoform in some way causes a decrease in reductive flux through the other isoform, the simplest and most direct interpretation of our results is that the enzyme which is knocked down participates in reverse flux. Hence, we conclude that both IDH1 and IDH2 are capable of mediating reverse flux. Importantly, the effects on reverse flux are mirrored in the effects on cell viability. The effects of IDH knockdown on viability do not impact our measurements of flux because this parameter is always normalized to total protein content, the incorporation of stable isotopes into other TCA metabolites is not affected, and measurements of flux were made at time points prior to extensive cell death.
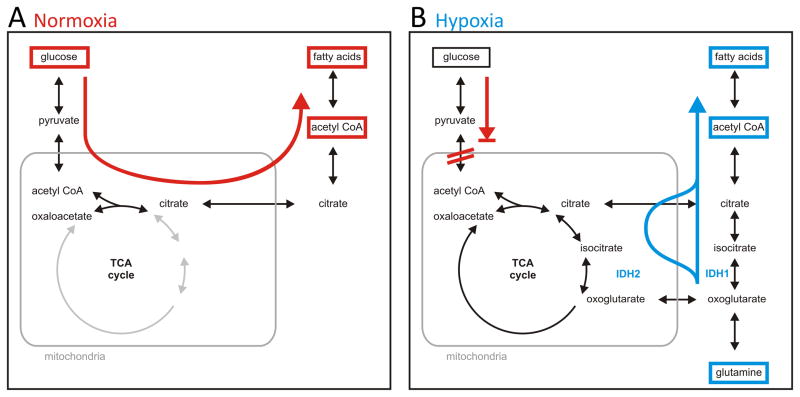
Figure 7. Carbon connectivity reveals reverse (reductive) TCA flux in hypoxia: fatty acid synthesis is routed though IDH1 and IDH2.
In normoxia (A), flux from glucose (red) feeds the TCA cycle in the forward direction and the acetyl CoA pool for fatty acid synthesis. In hypoxia (B), hypoxia inducible factor 1a blocks flux into the TCA cycle. Flux from glutamine (blue) compensates for limited supply of acetyl CoA and feeds fatty acid biosynthesis. IDH1 and IDH2 are decoupled from forward TCA cycle activity; they supply a short-cut by running the TCA cycle in reverse. The reverse direction of IDH from oxoglutarate to isocitrate is called reductive carboxylation. Fluxes and stable isotope incorporation are monitored by NMR based carbon connectivity.
While the present study was underway, three studies were published in high-profile journals that arrive at related conclusions on reductive carboxylation. One study focused on osteosarcoma cells that have an impaired TCA cycle. The authors showed that these cells can partially compensate for the mitochondrial defect by routing glutamine through the reductive flux by IDH1 and IDH2 (Mullen et al., 2012). In melanoma, we observed no impairment of the TCA cycle (Scott et al., 2011), although hypoxia reduced input of carbon from glucose into the TCA cycle. A second report pointed to a critical role for reductive flux through IDH1 as key to production of acetyl CoA from glutamine (Metallo et al., 2012). In that study knockdown of IDH1, but not IDH2, reduced reverse reductive flux and proliferation in a number of different tumor cells lines, although none of these were melanoma, and the knockdowns were performed only in normoxia. Consequently, our finding in melanoma cells under hypoxia differs because we observe a clear contribution of both IDH1 and IDH2. Curiously, a third report on human glioblastoma cells suggested IDH2, but not IDH1, mediates reductive carboxylation of glutamine in hypoxia (Wise et al., 2011). The report did not address a potential role of IDH1, which is an important omission, since in glioma the majority of tumors contain heterozygous mutations in IDH1, but only a few percent contain mutations in IDH2 (Yan et al., 2009). In addition, this third report primarily focused on the generation of 2-hydroxyglutarate, whereas we focused on the generation of fatty acids. Since 2-hydroxyglutarate is a product of mutated IDHs (Ward et al., 2010) and its role in metabolism still needs to be defined, our focus on core TCA metabolites, such as acetyl-CoA and citrate, or fatty acids, the metabolic end-product of reductive carboxylation, allows us to provide a physiological role for this pathway. The idea that reductive carboxylation mediates reverse TCA flux when the supply of carbon from acetyl CoA is limited is entirely consistent with our data from melanocytes and melanoma cell lines. Therefore we conclude that in the studied cell lines, IDH1 and IDH2 each play complementary roles in reductive carboxylation.
In summary, this study shows that in a panel of melanoma cell lines containing either B-Raf or N-Ras mutations, glutamine becomes a major source of carbon for lipogenesis in hypoxia. This metabolic adaptation is distinct from glutaminolysis, and is controlled by IDH1 and IDH2. Both enzymes function in the reverse direction to catalyze reductive carboxylation of oxoglutarate to produce isocitrate. Aconitase converts isocitrate is to citrate, which is broken down into acetyl CoA units for lipogenesis by ATP-citrate lyase. Together with our previous findings (Scott et al., 2011), our results indicate that IDH1 and IDH2 may be viable drug targets in melanoma.
Tissue cell culture
Human H3A melanocyte, WM35, LU1205, WM793, WM1366, WM3629, SBCL2 melanoma cell lines were maintained in supplemented melanocyte media (Invitrogen, M254-500) or supplemented minimal essential media (MEM). Supplemented media contained MEM (CellGro, 15010CV), 10% v/v fetal bovine serum (Hyclone, SH3039603, Lot AUD34653), 1% v/v antibiotic/antimycotic solution (Omega Scientific, PS-20), 1% v/v MEM non-essential amino acids (Hyclone, SH30238.01), 1% v/v MEM vitamins (CellGro, 25020CI), 1 mM l-glutamine (CellGro, 25005CI). The H3A cell lines were additionally supplemented with 1% v/v human melanocyte growth supplement (Invitrogen, HMGS S0025). Cells were labeled with [U-13C] glucose (Sigma-Aldrich, 389374) or [U-13C] glutamine (Sigma-Aldrich, 605166) by seeding 4 × 10⁶ cells into 150 mm dishes. At time 0 h, the complete medium was replaced with MEM supplemented with 2 g/l glucose total, of which 50 % was [U-13C] glucose or [U-13C] glutamine. After a 24 h stable isotope labeling period, approximately 2 × 10⁷ cells were harvested by incubation with 2.5 g/l trypsin for 5 min (Invitrogen, 25200-056). For experiments in normoxia, cells were maintained in 21 % O2, 74 % N2, 5 % CO2; for hypoxia in 1 % O2, 94 % N2 and 5 % CO2.
Small interfering RNA knockdown experiments
WM35 melanoma cells (1 × 10⁶) were transfected in serum reduced OptiMEM medium (Invitrogen, 31985070) with RNAiMAX Lipofectamine (Invitrogen, 13778-150) using 10 nM siRNA (IDH1, Dharmacon, J-008294-11; IDH2, Dharmacon, J-004013-09; IDH3A, Ambion, 4392420 s7122). 48 h after transfection the medium was changed and cells were incubated in supplemented MEM with 1 mM [U-13C] glutamine in hypoxia. Efficiency of knockdown was assayed at the protein level 72 h after transfection by Western blotting. The cellular proteins were extracted with CelLytic MT Cell Lysis buffer (Sigma-Aldrich, C3228), and 50 μg of total proteins were separated in 10% Tris-HCl Criterion SDS-PAGE gel (BioRad, 345-0010). The protein level of IDH isoforms was determined by monoclonal antibodies produced in rabbit (IDH1-41-55, Sigma-Aldrich, SAB1100101; IDH2-31-45; Sigma-Aldrich, SAB1100103; IDH3A, Abcam, ab58641) and with anti-rabbit IgG-horse radish peroxidase conjugate secondary antibody produced in goat (BioRad, 170-6515). The protein level of tubulin was used as loading control (Sigma-Aldrich, T6199).
Metabolite extraction
Cellular metabolites were extracted using cold methanol in phosphate buffer and chloroform. Cell pellets were suspended in 20 mM potassium phosphate buffer, pH 6.0. The cells were extracted by adding equal volumes of cold (253 K) absolute methanol (Sigma-Aldrich, 32213) and chloroform (Sigma-Aldrich, 319988). After rapid mixing, the tube was sonicated in an ice bath for 5 min. After centrifugation (18,000 g, 10 min), polar and aqueous fractions were collected. Samples were adjusted for amount of total cellular protein (Quick Start Bradford Biorad, 5000205), although the determination of relative stable isotope enrichment or carbon connectivity does not require this step. The cell extracts were dried by vacuum evaporation, and then dissolved in 200 μl of 99.9% D2O with 0.75% 3-(trimethylsilyl)propionic-2,2,3,3-d4 acid (Sigma-Aldrich, 293040) or chloroform-d with 1.0% v/v TMS (Sigma-Aldrich, 151831) for chemical shift referencing. The extract was cleared by centrifugation (18,000g, 10 min), and transferred into a 3 mm microtube (Norrell, S3HT7) for determination of carbon-resolved stable isotope incorporation.
Glutamine determination
Glutamine concentration was determined in culture medium removed from cells after 18 h labeling in [U-13C] glutamine medium, and uptake was measured by comparison with glutamine content of unused medium (Scott et al., 2011).
Gas chromatography mass spectrometry
GCMS protocols, including cell extraction and metabolite derivatization methods, and methods for calculation of relative reductive flux into citrate and labeling of acetyl units in fatty acids (myristate and palmitate), were as previously described (Scott et al., 2011). Reductive carboxylation was measured as relative intensity of the M+5 peak in citrate corrected for natural abundance.
Nuclear magnetic resonance spectroscopy
NMR experiments were performed on a 600 MHz Bruker Avance spectrometer with a 5 mm TCI cryoprobe (Bruker-BioSpin, Karlsruhe, Germany) at 298.15 K. Positional 13C enrichments were calculated from the ratio of stable isotope incorporation to natural abundance background. 2D 1H, 13C J-HSQC spectra were recorded with an experimental time of 24 h, 5120 indirect 13C data points at 80 ppm 13C sweep width, 40 ppm carrier position, 4096 direct 1H increments, 2s recycling delay, and 8 scans. All processing and analysis components were scripted in AWK for the NMR software NMRView. Spectra were processed with the NMRPipe and NMRDraw suites. Before fourier transformation, the data were multiplied with a squared sine-bell window function, phase corrected, and zero-filled to 8 k data points. Relative labeling incorporation from stable isotope precursor was corrected for natural abundance 13C and averaged over all 1H, 13C detectable carbons of the observed metabolite. Specifically, those were carbon 2 of acetyl CoA, carbons 2 and 4 of citrate, carbons 1–3 of glycerol, and carbons 2–7, ω-2, ω-1, and ω of saturated fatty acids.
Significance.
By profiling different melanoma cell lines, we found that reverse TCA flux by reductive carboxylation is a general feature of melanoma metabolism. Consequently, reductive carboxylation by isocitrate dehydrogenases could be significant to the pathology of melanoma.
Acknowledgments
We thank Yongmei Feng for assistance with tissue culture. This work was supported by the National Institutes of Health Grants CA-154887 to F.V.F. and CA-128814 to J.W.S.
The abbreviations used are
- IDH
isocitrate dehydrogenase
- TCA
tricarboxylic acid
- NMX
normoxia
- HPX
hypoxia
- WM
Wistar Melanoma
- H3A
Hermes 3A
- NMR
nuclear magnetic resonance
- GCMS
gas chromatography mass spectrometry
References
- Bell JL, Baron DN. Subcellular distribution of the isoenzymes of NADP isocitrate dehydrogenase in rat liver and heart. Enzymol Biol Clin (Basel) 1968;9:393–9. doi: 10.1159/000458268. [DOI] [PubMed] [Google Scholar]
- Bell JL, Shaldon S, Baron DN. Serum isocitrate dehydrogenase in liver disease and some other conditions. Clin Sci. 1962;23:57–66. [PubMed] [Google Scholar]
- Bzymek KP, Colman RF. Role of alpha-Asp181, beta-Asp192, and gamma-Asp190 in the distinctive subunits of human NAD-specific isocitrate dehydrogenase. Biochemistry. 2007;46:5391–7. doi: 10.1021/bi700061t. [DOI] [PubMed] [Google Scholar]
- Comte B, Vincent G, Bouchard B, Benderdour M, Des Rosiers C. Reverse flux through cardiac NADP(+)-isocitrate dehydrogenase under normoxia and ischemia. Am J Physiol Heart Circ Physiol. 2002;283:H1505–14. doi: 10.1152/ajpheart.00287.2002. [DOI] [PubMed] [Google Scholar]
- Comte B, Vincent G, Bouchard B, Jette M, Cordeau S, Rosiers CD. A 13C mass isotopomer study of anaplerotic pyruvate carboxylation in perfused rat hearts. J Biol Chem. 1997;272:26125–31. doi: 10.1074/jbc.272.42.26125. [DOI] [PubMed] [Google Scholar]
- Dalziel K, Londesborough JC. The mechanisms of reductive carboxylation reactions. Carbon dioxide or bicarbonate as substrate of nicotinamide-adenine dinucleotide phosphate-linked isocitrate dehydrogenase and malic enzyme. Biochem J. 1968;110:223–30. doi: 10.1042/bj1100223. [DOI] [PMC free article] [PubMed] [Google Scholar]
- Deberardinis RJ, Mancuso A, Daikhin E, Nissim I, Yudkoff M, Wehrli S, Thompson CB. Beyond aerobic glycolysis: transformed cells can engage in glutamine metabolism that exceeds the requirement for protein and nucleotide synthesis. Proc Natl Acad Sci U S A. 2007;104:19345–50. doi: 10.1073/pnas.0709747104. [DOI] [PMC free article] [PubMed] [Google Scholar]
- Des Rosiers C, Fernandez CA, David F, Brunengraber H. Reversibility of the mitochondrial isocitrate dehydrogenase reaction in the perfused rat liver. Evidence from isotopomer analysis of citric acid cycle intermediates. J Biol Chem. 1994;269:27179–82. [PubMed] [Google Scholar]
- Flavin R, Peluso S, Nguyen PL, Loda M. Fatty acid synthase as a potential therapeutic target in cancer. Future Oncol. 2010;6:551–62. doi: 10.2217/fon.10.11. [DOI] [PMC free article] [PubMed] [Google Scholar]
- Gaglio D, Metallo CM, Gameiro PA, Hiller K, Danna LS, Balestrieri C, Alberghina L, Stephanopoulos G, Chiaradonna F. Oncogenic K-Ras decouples glucose and glutamine metabolism to support cancer cell growth. Mol Syst Biol. 2011;7:523. doi: 10.1038/msb.2011.56. [DOI] [PMC free article] [PubMed] [Google Scholar]
- Kim JW, Tchernyshyov I, Semenza GL, Dang CV. HIF-1-mediated expression of pyruvate dehydrogenase kinase: a metabolic switch required for cellular adaptation to hypoxia. Cell Metab. 2006;3:177–85. doi: 10.1016/j.cmet.2006.02.002. [DOI] [PubMed] [Google Scholar]
- Koppenol WH, Bounds PL, Dang CV. Otto Warburg’s contributions to current concepts of cancer metabolism. Nat Rev Cancer. 2011;11:325–37. doi: 10.1038/nrc3038. [DOI] [PubMed] [Google Scholar]
- Kridel SJ, Axelrod F, Rozenkrantz N, Smith JW. Orlistat is a novel inhibitor of fatty acid synthase with antitumor activity. Cancer Res. 2004;64:2070–5. doi: 10.1158/0008-5472.can-03-3645. [DOI] [PubMed] [Google Scholar]
- Locasale JW, Grassian AR, Melman T, Lyssiotis CA, Mattaini KR, Bass AJ, Heffron G, Metallo CM, Muranen T, Sharfi H, et al. Phosphoglycerate dehydrogenase diverts glycolytic flux and contributes to oncogenesis. Nat Genet. 2011;43:869–74. doi: 10.1038/ng.890. [DOI] [PMC free article] [PubMed] [Google Scholar]
- Mckeehan WL. Glycolysis, glutaminolysis and cell proliferation. Cell Biol Int Rep. 1982;6:635–50. doi: 10.1016/0309-1651(82)90125-4. [DOI] [PubMed] [Google Scholar]
- Metallo CM, Gameiro PA, Bell EL, Mattaini KR, Yang J, Hiller K, Jewell CM, Johnson ZR, Irvine DJ, Guarente L, et al. Reductive glutamine metabolism by IDH1 mediates lipogenesis under hypoxia. Nature. 2012;481(7381):385–8. doi: 10.1038/nature10602. [DOI] [PMC free article] [PubMed] [Google Scholar]
- Mullen AR, Wheaton WW, Jin ES, Chen PH, Sullivan LB, Cheng T, Yang Y, Linehan WM, Chandel NS, Deberardinis RJ. Reductive carboxylation supports growth in tumour cells with defective mitochondria. Nature. 2012;481(7381):380–4. doi: 10.1038/nature10642. [DOI] [PMC free article] [PubMed] [Google Scholar]
- Possemato R, Marks KM, Shaul YD, Pacold ME, Kim D, Birsoy K, Sethumadhavan S, Woo HK, Jang HG, Jha AK, et al. Functional genomics reveal that the serine synthesis pathway is essential in breast cancer. Nature. 2011;476:346–50. doi: 10.1038/nature10350. [DOI] [PMC free article] [PubMed] [Google Scholar]
- Reynolds CH, Kuchel PW, Dalziel K. Equilibrium binding of coenzymes and substrates to nicotinamide-adenine dinucleotide phosphate-linked isocitrate dehydrogenase from bovine heart mitochondria. Biochem J. 1978;171:733–42. doi: 10.1042/bj1710733. [DOI] [PMC free article] [PubMed] [Google Scholar]
- Scott DA, Richardson AD, Filipp FV, Knutzen CA, Chiang GG, Ronai ZA, Osterman AL, Smith JW. Comparative metabolic flux profiling of melanoma cell lines: beyond the Warburg effect. J Biol Chem. 2011 doi: 10.1074/jbc.M111.282046. [DOI] [PMC free article] [PubMed] [Google Scholar]
- Warburg O. Versuche am überlebenden Karzinomgewebe. Biochem Z. 1923;142:317–33. [Google Scholar]
- Warburg O. On the origin of cancer cells. Science. 1956;123:309–14. doi: 10.1126/science.123.3191.309. [DOI] [PubMed] [Google Scholar]
- Ward PS, Patel J, Wise DR, Abdel-Wahab O, Bennett BD, Coller HA, Cross JR, Fantin VR, Hedvat CV, Perl AE, et al. The common feature of leukemia-associated IDH1 and IDH2 mutations is a neomorphic enzyme activity converting alpha-ketoglutarate to 2-hydroxyglutarate. Cancer Cell. 2010;17:225–34. doi: 10.1016/j.ccr.2010.01.020. [DOI] [PMC free article] [PubMed] [Google Scholar]
- Wise DR, Deberardinis RJ, Mancuso A, Sayed N, Zhang XY, Pfeiffer HK, Nissim I, Daikhin E, Yudkoff M, Mcmahon SB, et al. Myc regulates a transcriptional program that stimulates mitochondrial glutaminolysis and leads to glutamine addiction. Proc Natl Acad Sci U S A. 2008;105:18782–7. doi: 10.1073/pnas.0810199105. [DOI] [PMC free article] [PubMed] [Google Scholar]
- Wise DR, Ward PS, Shay JE, Cross JR, Gruber JJ, Sachdeva UM, Platt JM, Dematteo RG, Simon MC, Thompson CB. Hypoxia promotes isocitrate dehydrogenase-dependent carboxylation of alpha-ketoglutarate to citrate to support cell growth and viability. Proc Natl Acad Sci U S A. 2011 doi: 10.1073/pnas.1117773108. [DOI] [PMC free article] [PubMed] [Google Scholar]
- Yan H, Parsons DW, Jin G, Mclendon R, Rasheed BA, Yuan W, Kos I, Batinic-Haberle I, Jones S, Riggins GJ, et al. IDH1 and IDH2 mutations in gliomas. N Engl J Med. 2009;360:765–73. doi: 10.1056/NEJMoa0808710. [DOI] [PMC free article] [PubMed] [Google Scholar]
- Yoo H, Antoniewicz MR, Stephanopoulos G, Kelleher JK. Quantifying reductive carboxylation flux of glutamine to lipid in a brown adipocyte cell line. J Biol Chem. 2008;283:20621–7. doi: 10.1074/jbc.M706494200. [DOI] [PMC free article] [PubMed] [Google Scholar]


