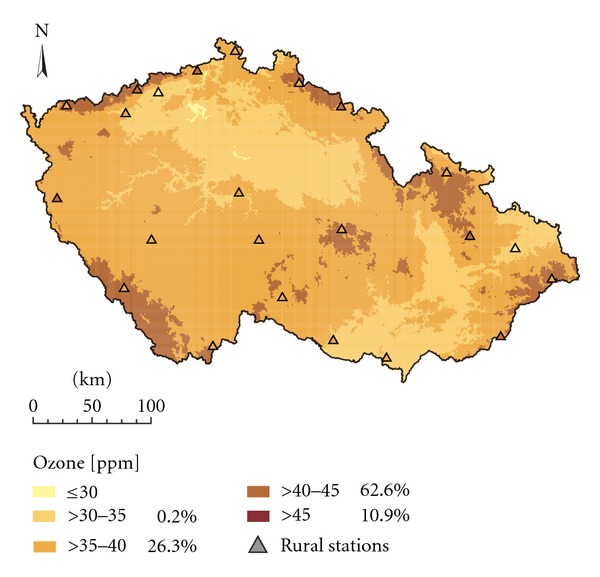
Figure 3.

Spatial interpolation of mean O3 concentrations in the 2008 vegetation season (ppb), interpolation technique ALR + res_OK, grid resolution 1 × 1 km.

Spatial interpolation of mean O3 concentrations in the 2008 vegetation season (ppb), interpolation technique ALR + res_OK, grid resolution 1 × 1 km.