Abstract
Purpose
To investigate the utility of multimodal quantitative magnetic resonance imaging (qMRI) and atlas-based methods to identify characteristics of lesion-driven injury and neurodegeneration in relapsing remitting multiple sclerosis (RRMS)
Materials and Methods
This work is health insurance portability and accountability act compliant. High resolution T1-weighted, dual echo and fluid-attenuated inversion recovery and diffusion tensor MRI images were prospectively acquired on 68 RRMS patients (range 25–58 years) and 68 age-matched controls. The data were analyzed using standardized human brain atlas-based tissue segmentation procedures to obtain regional volumes and their corresponding T2 relaxation times and DTI maps.
Results
Group-averaged brain atlas-based qMRI maps of T2, fractional anisotropy and diffusivities are visually presented and compared between controls and RRMS. The analysis shows a widespread injury in RRMS. Atrophy of the CC was substantial in RRMS. The qMRI attributes of the neocortex in combination with the CC such as T2 and diffusivities were elevated and correlated with disability.
Conclusion
Using a standardized multimodal qMRI acquistion and analyses that accounted for lesion distribution we demonstrate that cerebral pathology is widespread in RRMS. Our analysis of CC and neocortex qMRI metrics in relation to disability points to a neurodegenerative injury component that is independent from lesions.
Keywords: Multiple sclerosis, Wallerian degeneration, neurodegeneration, aging, quantitative MRI, Diffusion Tensor Imaging, T2 relaxation, Atlas-based, Lesion mapping, Human Brain Mapping, FreeSurfer, volumetry, Macrostructure, microstructure
Introduction
Histopathological studies in multiple sclerosis (MS) provide evidence for both lesion-centered inflammatory and neuronal-axonal injury in normal-appearing brain tissue (NABT) that appears independent of focal lesions (1, 2). In the past 30 years (3, 4), in vivo quantitative magnetic resonance imaging (qMRI) has provided important biomarkers of MS disease (5) and therapeutic effects, but no single MRI modality can provide specific information about the pathological hallmarks of MS (6).
Quantitative MRI metrics applied to NABT include macrostructural volumetry or atrophy measures (5, 7, 8) and microstructural measures (5). Microstructural metrics include (see extensive review in 5) magnetization transfer ratio, spectroscopy, perfusion, relaxation time, myelin water density (10), diffusion anisotropy, mean diffusivity (MD), axial diffusivity (AD) and radial diffusivity, RD, (5, 7). In general, demyelination without axonal loss of compact normal-appearing white matter (NAWM) has been marked by increase in relaxation time (10, 11) and increase in radial diffusivity (12). Elevation of mean diffusivity and relaxation time in normal-appearing gray matter (NAGM) may index the presence of edema (5, 9). Increase in iron content in gray matter results in reduced relaxation times (10, 13). In animal models, axonal dysfunction without demyelination has been characterized by axial diffusivity (14, 15). The co-presence of iron, reactive gliosis and edema may create counter effects on relaxation measurements in both white and gray matter (10, 11, 13).
The interpretation of qMRI findings in the normal living tissue in terms of the biophysical contributors remains a challenge (16). The application of qMRI to a complex pathology such as MS where lesion-driven inflammation, gliosis, demyelination and neurodegeneration coexist is yet more challenging (17–20).
Most qMRI methods reported to date were applied in isolation and used different analysis approaches (5) such as whole brain histogram, region-of-interest, voxel or tract-based statistics, tensor-based morphometry, volume-based, and focused on selected tissue types such as gray or white matter (5). As a consequence, it is not clear which MRI approach or metric best correlates with disease activity or physical disability. The use of multi-modal qMRI approaches in combination with standardized brain and lesion mapping methods has been recommended (5, 6, 21).
In this work multi-modal MRI images were obtained on relapsing remitting multiple sclerosis (RRMS) patients and age-matched healthy volunteers. Data were extracted and analyzed using a brain atlas to automatically define subcortical or deep gray matter (DGM), cortex, deep WM (e.g. corpus callosum, periventricular WM), and lobar WM volumes. The primary goals of this work were to (a) present atlas-based qMRI pictorial of the RRMS brain with respect to healthy controls using several qMRI metrics and to (b) investigate the correlations between qMRI metrics, whole brain lesions and expanded disability status score (EDSS) to examine the possibility of separating direct lesion-related injury from age-independent neurodegenerative neuronal or axonal loss (17–20). We used EDSS as our primary clinical outcome measure as it has been related to other cognitive and quality of life measures (22).
In this study we focused on the cerebral neocortex gray matter and corpus callosum (CC) white matter as these domains are functionally and structurally related. The methodology adopted fused T2 relaxation time, lesions and diffusion tensor imaging (DTI) derived maps with FreeSurfer atlas-based volumetry (7).
Materials and Methods
Study Population
The MRI protocol of this prospective study was approved by our Institutional Review Board. Written informed consent was obtained from each subject. Sixty eight (15 men and 53 women) RRMS patients age = 41.6 ± 8.5 years (mean ± standard deviation; see Table 1). Median EDSS of the RRMS patients was 1.5 (range = 0–4.5). The median disease duration of the RRMS was 8.4 years (range = 0.2–36.8 years). The median whole brain lesion load (LL) of the RRMS cohort was 6.2 mL (range = 0.2–44 mL). At the time of their imaging session, 47% of RRMS patients were using glatiramer acetate, ~ 22% an interferon beta preparation (73.7% a subcutaneous product), and ~ 25% were not on any disease modifying therapy. In addition, 68 healthy adult controls (29 men and 39 women; age 40.0 ± 8.6 years) were recruited from the local community and university staff. All control subjects were screened for history of trauma, surgery, chronic illness, alcohol and/or drug abuse, neurological illness, and current pregnancy. None of the controls in this study reported any neurological conditions and their fluid-attenuated inversion recovery (FLAIR) images were judged to be normal.
Table 1.
Main demographic, clinical and MRI-derived brain lesion load (or volume) and intracranial volume average values of the RRMS patients and healthy controls.
| RRMS Patients | Healthy Controls | % Difference (RRMS-HC)/HC (×100) | P value | |
|---|---|---|---|---|
| Number | 68 | 68 | 0 | |
| F:M (F/M Ratio) | 53:15 (3.54) | 39:29 (1.34) | 0.0006 | |
| Age (years) | 41.6 ± 8.5 [25.4–56.6] | 40.0 ± 8.6 [25.5–56.9] | 4.0 | 0.26 |
| Disease Duration (years) | 10.2 ± 8.9 [0.2–36.8] Median = 8.4 |
N. A | N. A | N. A |
| EDSS | 1.5 ± 1.3 [0.0–4.5] Median =1.5 |
N. A | N. A | N. A |
| T2 Lesion Load (mL) | 10.7 ± 10.9 [0.2–44.8] Median = 6.2 |
N. A | N. A | N. A |
| ICV (mL) | 1466.5 ± 133.3 [1175.3 – 1921.4] Median = 1438 |
1489.9 ± 146.3 [1220.9 – 1747.4] Median = 1518.0 |
−1.5 | 0.33 |
MRI Data Acquisition
All MRI studies were performed on a 3.0 T Philips Intera scanner with a dual quasar gradient system with maximum gradient amplitude of 80 mT/m and an eight channel SENSE-compatible head coil (Philips Medical Systems, Best, Netherlands).
Conventional MRI
The MRI protocol included a whole brain high resolution axial 3D T1-weighted volume (voxel size = 0.9375 mm × 0.9375 mm × 0.9375 mm) for automatic brain atlas-based volumetry (23). In addition, dual fast spin-echo (FSE) images were acquired with echo (TE) and repetition times of (TR) of TE1/TE2/TR = 8.2/90/6800 ms to compute the T2 relaxation time (T2). A FLAIR sequence with (TE/TI/TR = 80/2500/8000 ms) was used for lesion localization. The slice thickness for both FSE and FLAIR data was 3.0 mm with 44 contiguous axial slices covering the same inferior-to-superior prescription of the 3D T1-weighted sequence and a square field-of-view (FOV) of 240 mm × 240 mm.
Diffusion Tensor Imaging Data Acquisition
DTI data were acquired using a single-shot spin-echo diffusion sensitized echo-planar imaging sequence with balanced Icosa21 tensor encoding scheme with twenty-one uniformly-distributed orientations over the unit hemisphere (24) with b-factor = 1000 sec mm−2, TR/TE = 7100/65 msec. The in-plane data acquisition voxel size was ~ 2.1 mm which was interpolated after k-space image construction to ~ 0.94 mm. The slice thickness, FOV and spatial coverage matched the FSE and FLAIR images.
Conventional MRI and DTI Data Processing
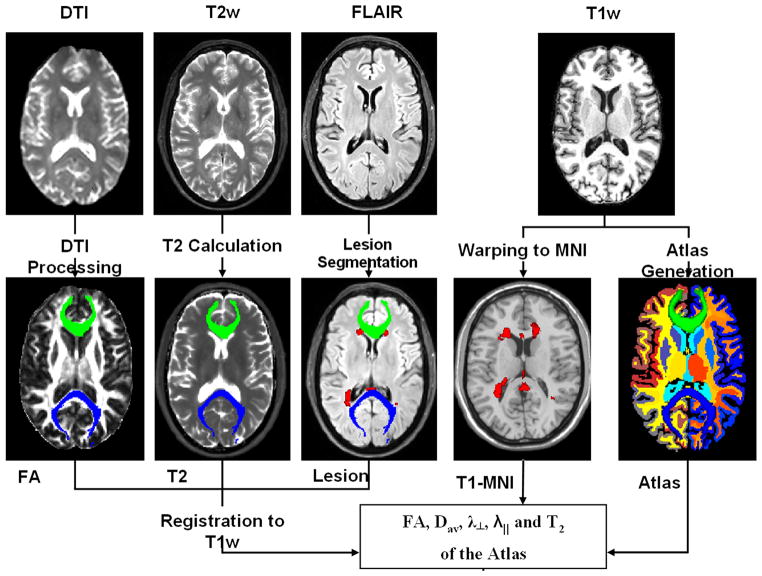
All MRI data sets were masked to remove non-brain tissues and estimate the intracranial volume (ICV) for each subject (8, 25). Figure 1 illustrates all analysis steps applied on one MS patient; a detailed account of these procedures is described elsewhere (26). In brief, all MRI data were inspected, prepared, and processed to obtain quantitative maps. The quantitative MRI volumes along with lesion maps were saved in standardized binary image volume formats (26). The volumes were subsequently aligned and mapped to each subejct T1-weighted native space where a brain volume-based atlas was obtained as described below.
Figure 1.
A schematic illustration of the MRI data acquisition and processing pipeline using brain data from one RRMS patient. The DSE data are used to obtain T2 relaxation time and in combination with FLAIR are used to localize and quantify lesions (shown in red). The DTI data are used to obtain several maps such as FA which in combination with the tensor orientation can be used to obtain the fiber tracks traversing the corpus callosum (anterior CC green, posterior blue). The T1-weighted data are used to obtain an anatomically labeled atlas on each subject. All derived qMRI maps are coregistered with the T1-weighted data for subsequent volume-based regional analyses.
FreeSurfer Anatomical Labels and Regional Volumetry Masks
The 3D T1-weighted volumes were prepared for subsequent processing, segmentation and anatomical labeling using FreeSurfer (23) software (http://surfer.nmr.mgh.harvard.edu/fswiki/FreeSurferWiki). FreeSurfer provided volume masks on ~ 180 regions that included cerebrum, cerebellum, brain stem, and cerebrospinal fluid (CSF). The FreeSurfer anatomical labels and their cortical classification are described by Desikan et al. (27). In brief, the frontal cortex is composed of 11 subdivisions that include the caudal middle, lateral, medial orbitofrontal, paracentral, parsopercularis, parsorbitalis, parstriangularis, precentral, rostral middle frontal, superior frontal and frontal pole gray matter. The temporal cortex is composed of 9 subdivisions that include the banks of the superior temporal sulcus (bankssts), entorhinal, fusiform inferior, middle, superior, transverse temporal cortices, temporal pole and parahippocampal cortical gray matter. The parietal cortex is composed of 5 subdivsions that include the postcentral, supramrginal, precuneus, inferior and superior parietal gray matter. The occipital cortex is composed of 4 subdivsions that include cuneus, pericalcarine, lingual, and lateral occipital gray matter. The cingulate cortex is composed of 4 subdivsions that include the caudal anterior, rostral anterior, isthmus and posterior cingulate gray matter. The neocortex includes the frontal, temporal, parietal and occipital cortices and does not include the cingulate or insular gray matter.
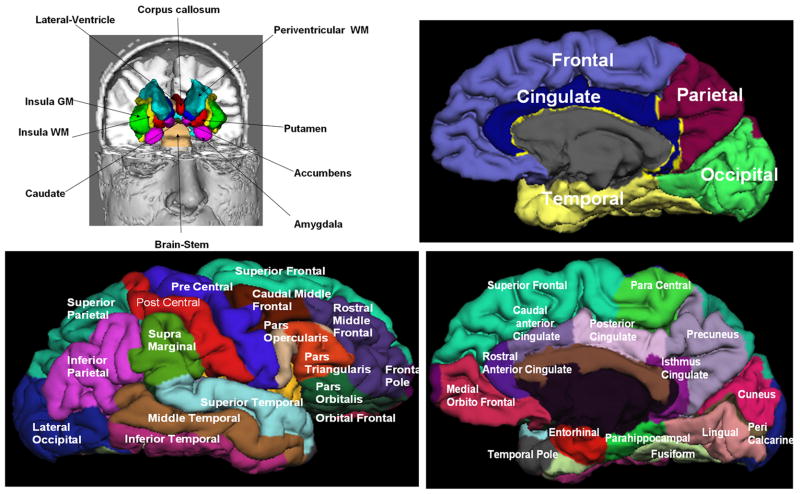
Figure 2 illustrates the majority of deep brain subcortical, cortical gray matter and deep and lobar white matter structures generated by FreeSurfer using the brain T1-weighted data from one healthy control.
Figure 2.
Illustration of the FreeSurfer generated deep and cortical brain regions on one healthy control.
To simplify the analyses and reduce the number of comparisons we pooled some structures based on their laterality and proximity. The corpus callosum (CC) midsagittal subdivisions or anterior (aCC), middle anterior (maCC), middle (mCC), isthmus iCC and splenium (sCC) were volume-averaged. The qMRI metrics of the neocortical subdivisions were volume-averaged to obtain a single metric that characterize the frontal, temporal, parietal, and occipital cortices (see Fig. 2).
Transverse Magnetization Relaxation Time (T2) Estimation
The T2 relaxation time values were estimated from the early (TE1) and late echo (TE2) volumes, according to standard spin-echo procedures assuming a single compartment model (10, 11, 28).
Lesion Load Segmentation and Lesion Probability Map Estimation
Whole brain lesion load was quantified in the RRMS group using the coregistered multi-spectral dual FSE and the FLAIR volumes (29). The lesion volumes were saved as binary masks to enable fusion with other multimodal volumes acquired from the same subject. Lesion probability maps (LPM) were obtained as described previously (30–34). The lesion probability masks were visualized in MRIcroN (http://www.nitrc.org/projects/mricron/) and were fused as described below with all qMRI metric data and their correlations with age, expanded disability status scale (EDSS) score, disease duration (DD) in the RRMS group.
DTI Data Processing
Diffusion-weighted images were intra-registered to the baseline “b0” images (without diffusion weighting) to correct for the eddy-current-induced image distortions (24). The results of DTI pipeline included b0, FA, mean or average diffusivity (Dav), radial and axial diffusivity maps.
Multimodal MRI Data Fusion
All conventional MRI-derived volumes (T2, lesion masks) and DTI-derived data volumes (FA, mean, axial and radial diffusivities) were coregistered to the T1-weighted volume. Lesion masks were used to null out the atlas-based volume results (12, 35). The last step assured that all cerebral parenchyma tissue used is normal-appearing and lesion free. The qMRI data corresponding to lesions are not analyzed here and only normal-appearing cerebral parenchymal tissue are included.
Validation and Data Quality Assurance
Conventional and DT-MRI data quality and scanner stability were monitored over the 5 year span of data collection. We collected serial data on RRMS patients and healthy controls to assure reproducibility and monitor age-related changes in qMRI metrics (data not shown). All data outputs were inspected at all processing steps to assure the accuracy of volume estimation, alignment of multi-modal MRI and fusion with lesion maps. Lesions were manually checked by a trained rater. DTI reproducibility and quality control measures utilized same subject serial data and water phantom data (24).
Statistical Analysis
Correlations between age, volume-to-ICV percentage, and whole brain lesion load (LL), disease duration (DD), T2 values and DTI-derived metrics were computed using the Pearson correlation coefficient. Age-adjusted correlations between EDSS score and all other qMRI variables were computed using the Spearman coefficient. For EDSS covariance with age and lesion load multivariate analysis of covariance or generalized linear models was used (36). Slopes and rates of change of MRI metrics with age were compared using the r to z-Fisher transform (37). Comparisons between group means and medians were performed using ANOVA (t-test; F=t2) and the Mann-Whitney U-test. Statistical significance accounted for multiple comparisons (i.e. 0.05/Number of comparisons). All group qMRI comparison differences and statistical significance were computed volume-wise in native data space and were presented in standard space for visual inspection and fusion with the lesion probability maps. All statistical analyses used MATLAB R12.1 Statistical Toolbox v 3.0 (The Mathworks Inc, Natick, MA).
Results
Population Demographics and Clinical Information
Table 1 compares the demographics and MRI whole brain volumetry on the 68 RRMS patients and 68 healthy controls. There were no significant age differences between controls and RRMS patients (p = 0.26). The two cohorts did not significantly differ (p = 0.33) in the total intracranial volume (ICV). The ICV was used to normalize the regional volume measurements on each subject to minimize skull size variability (25). The percentage volume (VOLp) is defined as VOL/ICV *100 (%).
Visualization of Lesions and Atrophy in RRMS
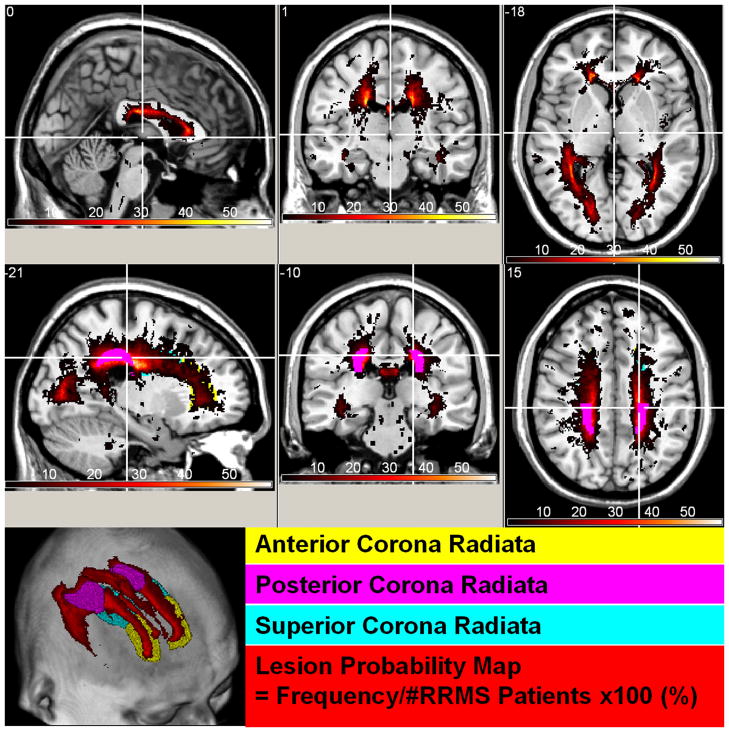
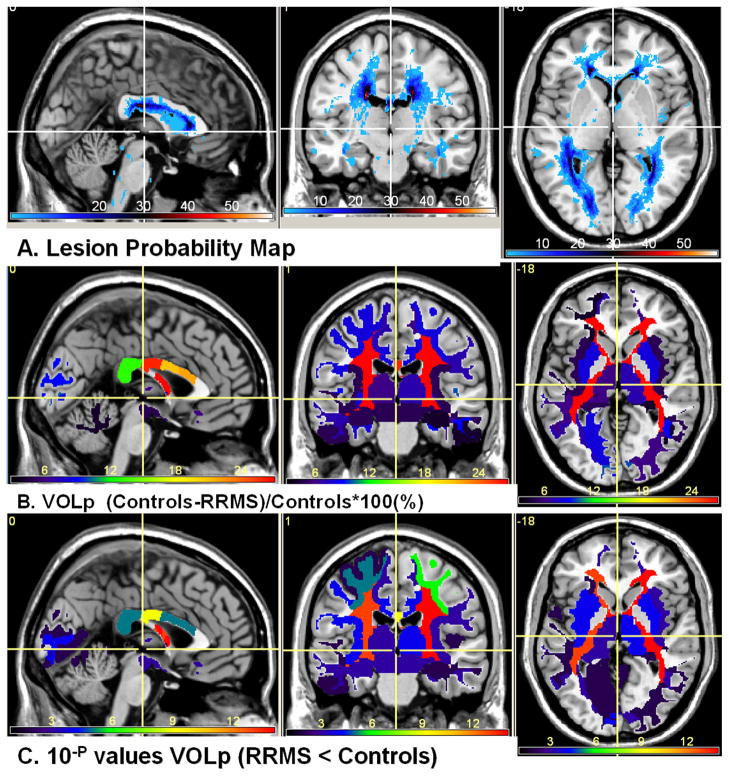
Figure 3 shows the lesion probability map on the 68 RRMS at two selected levels that show the deep cerebral and supratentorial structures. Figure 3 highlights the regions with the highest lesion frequency such as the posterior corona radiata and optic radiations. Lesions were least frequent in the thalamus proper and amygdalae. Figure 4 shows the lesion map along with the volume atrophy map which is the difference in normalized volume between RRMS and controls divided by the healthy control average values. The statistical inference is shown in Fig 4C as a -log(p) map (e.g. a significant p value = 10−4 is mapped as 4). The percentage VOLp difference between RRMS and controls was largest in the periventricular white matter and the isthmus of the corpus callosum.
Figure 3.
Spatial distribution of lesions or lesion probability map viewed in standard Montreal Neurological Institute (MNI) image space. Note the areas of high lesion frequency (posterior corona radiate) and regions with low lesions (e.g. thalamus proper).
Figure 4.
(A) Lesion probability map on the 68 RRMS patients (B) The percentage ICV-normalized normal-appearing volume difference (significant atrophy RRMS < Controls). Note that largest normal-appearing tissue atrophy (volume loss) is in deep periventricular white matter. Note that lesions in our RRMS cohort were least frequent in the thalamus yet the volume difference is significant. The color map (minimum dark blue) in the upper views corresponds to the percentage (maximum about 28% (bright red) in periventricular white matter and corpus callosum isthmus and (C) the corresponding the group difference p values (analysis-of-variance).
Brain Atlas of qMRI Maps of Healthy Controls
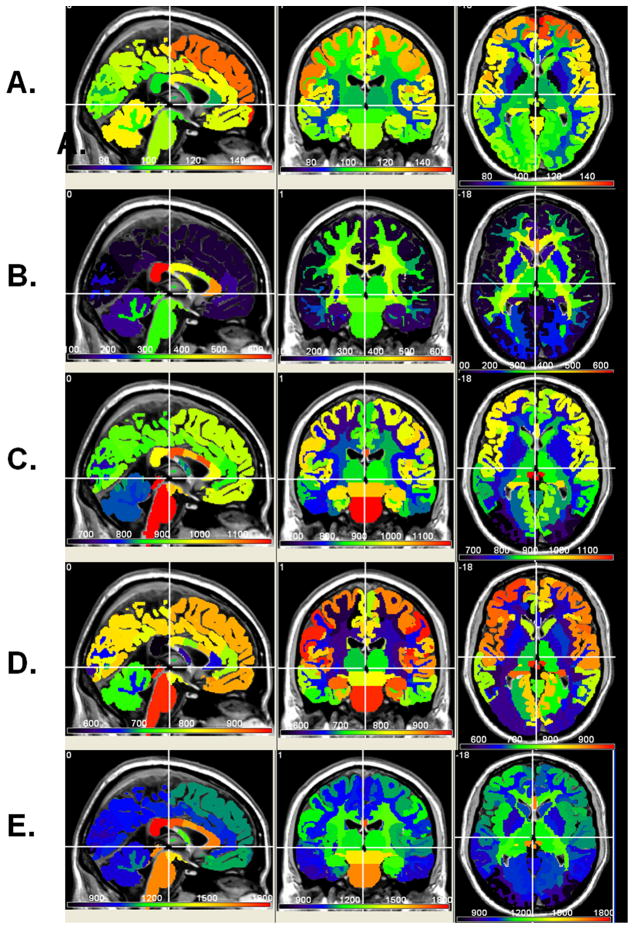
Figure 5 shows the atlas-based group average normative values of T2, FA, mean, radial and axial diffusivities, respectively at one level that shows the deep and cortical structures. Note the spatial heterogeneity of these qMRI maps.
Figure 5.
Normative atlas-based average qMRI maps of (A) T2 relaxation Time, (B) FA (c) mean diffusivity, (D) radial and (E) axial diffusivities
Regional qMRI Statistical Differences between Controls and RRMS Patients
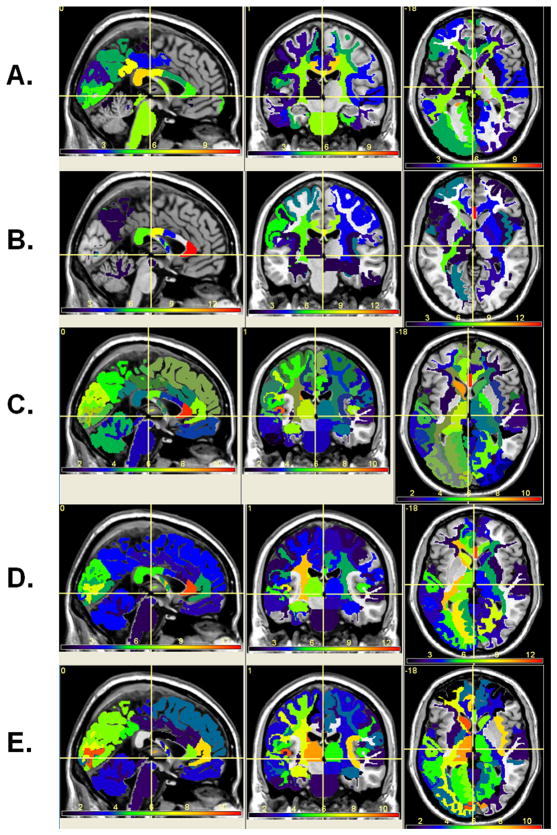
Figure 6 shows the statistical differences or p values of the five qMRI metrics between normal healthy tissue (Fig. 5) and normal-appearing tissue in RRMS. The number of regions shown is ~ 170 (see Fig. 2) and the number of independent qMRI metrics were 3 (T2 relaxation, axial and radial diffusivities). Regions with significance > 0.1 were not color-coded and statistical significance was considered at p < 0.0001 (i.e. 0.05/(number of structures*number of independent qMRI metrics = 0.05/(170*3) ~ 1 × 10⁻⁴). Note the spatial distribution of injury on the qMRI maps and the significant widespread differences on mean diffusivity and T2 maps (RRMS > Controls; significant p < 10−4). The lateral orbitofrontal cortex seems to be spared on all qMRI metrics (p > 0.24; Fig 4B and Fig. 6). The poster CC is significantly atrophic in RRMS along with increased T2 relaxation time and radial diffusivities. The anterior CC is not atrophic (p>0.1) yet the T2 relaxation and DTI metrics and in particular the axial diffusivities indicate that this region is abnormal.
Figure 6.
The statistical significance of difference between RRMS patients and normative atlas-based average qMRI maps of (A) T2 relaxation time, (B) FA (c) mean diffusivity, (D) radial and (E) axial diffusivities. Note that this is shown as −log(actual p) (e.g. 10−4 is mapped as 4).
Illustration of Regional qMRI Results using Neocortical GM and Corpus Callosum
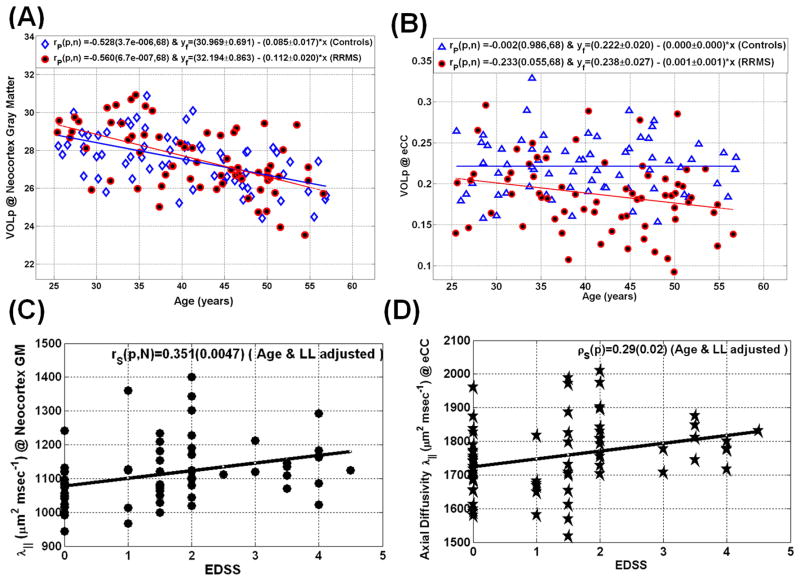
To illustrate the utility of the atlas-based results, we pooled all neocortical GM and CC subregions (see Fig. 2). Table 2 summarizes and compares the average VOLp, T2, FA, mean, axial and radial diffusivities between RRMS patients and controls on the neocortical GM and CC. Note that despite a non-significant difference in neocortical GM atrophy (p = 0.97; see Fig. 7A), the microstructural qMRI metrics are elevated in RRMS on T2 (p = 0.05) and the tensor diffusivities (p < 0.00001). The CC volume is reduced in RRMS (p = 0.000001; Fig. 7B). The average CC T2 relaxation time (p < 1×10⁻⁷) and radial diffusivity (p < 1×10⁻⁸) are elevated in RRMS.
Table 2.
Quantitative MRI metrics of neocortical GM and callosal WM in RRMS patients and corresponding values in age-matched healthy controls.
| qMRI | RRMS (N=68) | Controls (N=68) | % diff | F value | P value | |
|---|---|---|---|---|---|---|
| Neocortex (Gray Matter) | VOL | 403.5 ± 39.5 | 410.2 ± 42.2 | −1.6 | 0.92 | 0.34 |
| VOLp | 27.5 ± 1.7 | 27.6 ± 1.4 | −0.0 | 0.00 | 0.97 | |
| T2 | 126.0 ± 8.7 | 123.9 ± 5.8 | 1.8 | 2.94 | 0.09 | |
| FA | 125.7 ± 9.2 | 121.3 ± 12.4 | 3.6 | 5.53 | 0.02 | |
| MD | 970.8 ± 83.5 | 914.1 ± 48.6 | 6.2 | 23.46 | < 4×10⁻⁶ | |
| AD | 1112.0 ± 93.0 | 1042.1 ± 54.2 | 6.7 | 28.61 | < 4×10⁻⁷ | |
| RD | 900.2 ± 79.1 | 850.1 ± 46.9 | 5.9 | 20.23 | <0.00001 | |
| VOL | 2.7 ± 0.6 | 3.28 ± 0.5 | −16.8 | 30.94 | < 1×10⁻⁷ | |
| Corpus Callosum | VOLp | 0.19 ± 0.04 | 0.22 ± 0.03 | −15.6 | 25.34 | < 2×10⁻⁶ |
| T2 | 113.3 ± 11.3 | 105.7 ± 4.0 | 7.2 | 27.33 | < 6×10⁻⁷ | |
| FA | 463.6 ± 50.8 | 510.5 ± 31.5 | −9.3 | 43.06 | < 1×10⁻⁹ | |
| MD | 1127.4 ± 109.7 | 1040.0 ± 70.3 | 8.4 | 30.53 | < 2×10⁻⁷ | |
| AD | 1773.2 ± 130.6 | 1713.4 ± 92.9 | 3.5 | 9.48 | 0.003 | |
| RD | 804.5 ± 112.9 | 703.4 ± 68.2 | 14.4 | 39.95 | < 4×10⁻⁹ |
Figure 7.
Representative illustration of age-dependence of qMRI metrics in RRMS and controls using scatter plots and linear regression (A) volume percentage of the cerebral neocortex GM (B) volume percentage of the entire corpus callosum. The scatter plots of EDSS with axial diffusivity are shown in (C) for the cerebral neocortex and (D) Corpus callosum. Note the rapid decrease in cortical gray matter volume with age in both controls (r= −0.53; p<0.000004) and RRMS patients (r=−0.56; p<0.0000007).
Clinical Correlations of qMRI metrics of neocortical GM and lobar WM
Table 3 summarizes the correlations of qMRI metrics in the neocortical GM and CC WM with clinical (DD, EDSS) and whole brain LL on the RRMS patients. The Table also provides the qMRI vs. EDSS correlations upon adjusting for age and LL. Adjusting for age effects is crucial as gray matter volume decreases rapidly in both RRMS and controls (Fig. 7A). Note that the age and LL adjusted EDSS correlated strongly with neocortical GM diffusivities (Spearman r = 0.35; p = 0.005; Figure 7C), while the age and LL adjusted EDSS correlated strongly with the CC volume percentage (r = −0.39; p=0.0001) and axial diffusivity (r =0.29; p=0.02; Figure 7D).
Table 3.
Correlation coefficient (r) and statistical significance (p) of qMRI metrics of cortical GM and callosal WM with clinical data and lesion load in RRMS patients.
| qMRI | DD r (p) | Lesion Load r (p) | EDSS r (p) | EDSS adjusted for age & LL r (p) | |
|---|---|---|---|---|---|
| Neocortical Gray Matter | VOLp | −0.06 (0.63) | −0.20 (0.10) | −0.20 (0.10) | −0.14 (0.25) |
| T2 | 0.07 (0.57) | 0.40 (0.001) | 0.31 (0.01) | 0.21 (0.09) | |
| FA | 0.05 (0.69) | −0.11 (0.37) | −0.11 (0.37) | −0.08 (0.53) | |
| MD | 0.13 (0.29) | 0.45 (0.0002) | 0.42 (0.0006) | 0.36 (0.004) | |
| AD | 0.14 (0.26) | 0.45 (0.0002) | 0.41 (0.0007) | 0.35 (0.005) | |
| RD | 0.13 (0.31) | 0.45 (0.0002) | 0.41 (0.0009) | 0.34 (0.006) | |
| Corpus Callosum | VOLp | −0.29 (0.02) | −0.63 (<1×10⁻⁸) | −0.49 (0.00003) | −0.38 (0.002) |
| T2 | 0.28 (0.02) | 0.71 (<3×10⁻¹¹) | 0.35 (0.004) | 0.21 (0.10) | |
| FA | −0.09 (0.45) | −0.33 (0.008) | −0.13 (0.32) | −0.06 (0.64) | |
| MD | 0.21 (0.10) | 0.56 (< 2×10⁻⁶) | 0.32 (0.01) | 0.23 (0.07) | |
| AD | 0.21 (0.10) | 0.48 (0.00005) | 0.37 (0.003) | 0.28 (0.02) | |
| RD | 0.18 (0.16) | 0.51 (0.00002) | 0.26 (0.04) | 0.17 (0.19) |
Abbreviations used in Tables: F/M = females/males; HC = healthy controls, RRMS = relapsing-remitting multiple sclerosis patients DD = disease duration, EDSS = expanded disability status score CC = corpus callosum; GM = gray matter; WM= white matter, Neocortex = (frontal + temporal + occipital + parietal) GM, ICV = intracranial volume; LL = lesion load (or volume), VOL = volume (in mL); VOLp = volume-to-ICV percentage (VOL/ICV ×100% unitless), T2= transverse magnetization relaxation time (msec), FA = fractional anisotropy (×1000.0 unitless), MD, AD, RD = mean, axial and radial diffusivities, respectively (×106 mm2 sec−1).
Discussion
This is likely the first comprehensive report of volumetry and corresponding T2 relaxation time, fractional anisotropy, mean, axial and radial diffusivity measurements of the cerebral subcortical, lobar white and cortical gray matter subdivisions in relatively large cohort of controls and RRMS patients. Regional macrostructural or atrophy measures were determined to obtain volumetry in addition to microstructural attributes of normal-appearing tissue using FreeSurfer (7, 38). Volume or atrophy measures were fused with lesion maps, T2 relaxation, and DTI-derived maps in each subject’s native space.
The standardized normative brain atlas-based qMRI heterogeneity of the deep and cortical brain tissue relaxometry (28, 39, 40) and anisotropy (41) is consistent with numerous earlier normative qMRI reports using different methods such as region-of-interest, histogram, voxel-or volume-based. In this work, the mean diffusivity and relaxation time have been shown to be quite abnormal in RRMS whereas regional tissue volume and in particular neocortical GM volume was only slightly reduced. Consistent with a previous report in MS (42), we also found that FA was a less sensitive predictor of disability than was mean diffusivity. This particular finding is not surprising as FA is a ratio measure of two variables (axial and radial diffusivities) that could be affected equally by factors such as edema which would have increased both axial and radial diffusivities (43).
This report provides comprehensive multimodal qMRI evidence for widespread regional tissue atrophy and increased mean diffusivity in deep and cortical gray and lobar white matter (44, 45). In general, these system-level findings consolidate a plethora of in vivo reports in MS using several qMRI methods (5, 7–12). The findings of abnormal and widespread injury in MS are consistent with previous histopathological (1, 2, 46, 47) and in vivo hypoperfusion reports (48–50) of widespread brain tissue injury when investigating MS patients with different stages or with different phenotypes.
The spatial distribution of lesion maps on this RRMS cohort are similar to previous reports (30–33) in which lesions were shown to be more frequent in periventricular white matter as has also been reported postmortem (51).
We illustrated the application of our atlas-based approach by focusing on the qMRI metrics of the cerebral neocortex and the CC in relation to age, lesion load, disease duration and clinical disability. The CC was selected as it is the major interhemispheric commissure that is involved in cortico-cortical communication (52). The fibers in the anterior CC are less myelinated and may be more vulnerable than those in the more myelinated posterior CC fibers (52) and this may explain the region specific injury patterns seen (Fig. 4B and Fig. 6). Irreversible loss of tissue of this deep WM structure due to inflammatory lesions or axonopathy as marked by volume loss would lead to Wallerian degeneration and subsequently cortical gray matter loss (46). Our atlas-based qMRI data support the notion that deep brain structures are more severely atrophic than cortical regions. The elevated cortical T2 relaxation and diffusivities may indicate the presence of some pathological mechanisms (e.g. diaschisis, axonal-dendrite transection, cortical demyelination) that eventually lead to detectable neuronal loss (47). The T2 values and diffusivities may provide early biomarkers of such pathological mechanisms.
An important finding of this work is the elevated normal-appearing cortical mean diffusivity which correlated strongly with EDSS adjusted for age and whole brain lesion load (Table 3 and Fig. 7). Cortical volumetry did not show this relationship (47), likely because cortical gray matter also undergoes age-related changes (25). Decoupling age-related degeneration is important to separate the confounding effect of natural aging on the lesion-driven pathology. The CC white matter subregions showed significant correlation with EDSS adjusted for age and lesion load. Another important finding in this work is that the CC volume reduction, CC elevation in T2, increased mean and axial diffusivities was decoupled from lesion load and age-related degeneration. The observation that the age and lesion load adjusted axial callosal diffusivity was significantly correlated with EDSS indicates that this metric is sensitive to chronic axonal injury or degeneration as has been reported on the CC using spectroscopy (53), DTI (12, 53, 54), histopathology (46) and using animal models of tissue injury (15).
We used brain atlas and volume-based methods previously validated using postmortem data (55) and applied on both controls and MS patients (56, 57, 58, 59) using high resolution T1-weighted data fused with relaxation time (60) and DTI-derived data (61). However, this study has some limitations due to the possible presence of undetected lesions on MRI. The use of 3mm sections for lesion localization, segmentation and spatial mapping could have reduced sensitivity to intracortical lesions compared to thinner or isotropic voxel sizes (62). The analysis strategy described in this work in combination with high magnetic fields and higher spatial resolutions warrant future applications to serial data and extension to other MS phenotypes.
In conclusion, using a standardized brain atlas approach and multi-modal qMRI data and analyses that accounted for lesion distribution and natural aging we were able to demonstrate that pathology is widespread over the cerebrum in RRMS. Moreover, we were able to identify in vivo MRI signature of demyelination and axonal loss.
Acknowledgments
This work is funded by the National institutes of Health (NIH/NINDS R01-NS052505–04 and Dunn Research Fund to KMH, NIH/NIBIB EB002095 to PAN, and an unrestricted gift from the Band Against Multiple Sclerosis to JSW. The purchase of the 3.0 T MRI Clinical Scanner is partially funded by NIH grant S10 RR19186 to PAN. We wish to thank Vipul Kumar Patel for helping in data acquisition.
References
- 1.Trapp BD, Peterson J, Ransohoff RM, Rudick R, Mork S, Bo L. Axonal transection in the lesions of multiple sclerosis. New Engl J Med. 1998;338:278–285. doi: 10.1056/NEJM199801293380502. [DOI] [PubMed] [Google Scholar]
- 2.Seewann A, Vrenken H, van der Valk P, et al. Diffusely abnormal white matter in chronic multiple sclerosis: imaging and histopathologic analysis. Arch Neurol. 2009;66:601–609. doi: 10.1001/archneurol.2009.57. [DOI] [PubMed] [Google Scholar]
- 3.Young IR, Hall AS, Pallis CA, Legg NJ, Bydder GM, Steiner RE. Nuclear magnetic resonance imaging of the brain in multiple sclerosis. Lancet. 1981;2:1063–1066. doi: 10.1016/s0140-6736(81)91273-3. [DOI] [PubMed] [Google Scholar]
- 4.Goodin DS. Magnetic resonance imaging as a surrogate outcome measure of disability in multiple sclerosis: have we been overly harsh in our assessment? [Review] Ann Neurol. 2006;59:597–605. doi: 10.1002/ana.20832. [DOI] [PubMed] [Google Scholar]
- 5.Filippi M, Agosta F. Imaging biomarkers in multiple sclerosis. J Magn Reson Imaging. 2010;31:770–788. doi: 10.1002/jmri.22102. [Review] [DOI] [PubMed] [Google Scholar]
- 6.Barkhof F. The clinico-radiological paradox in multiple sclerosis revisited. [Review] Curr Opin Neurol. 2002;15:239–245. doi: 10.1097/00019052-200206000-00003. [DOI] [PubMed] [Google Scholar]
- 7.Ramasamy DP, Benedict RH, Cox JL, et al. Extent of cerebellum, subcortical and cortical atrophy in patients with MS: a case-control study. J Neurol Sci. 2009;282:47–54. doi: 10.1016/j.jns.2008.12.034. [DOI] [PubMed] [Google Scholar]
- 8.Hasan KM, Halphen C, Kamali A, Nelson FM, Wolinsky JS, Narayana PA. Caudate nuclei volume, diffusion tensor metrics, and T(2) relaxation in healthy adults and relapsing-remitting multiple sclerosis patients: implications for understanding gray matter degeneration. J Magn Reson Imaging. 2009;29:70–77. doi: 10.1002/jmri.21648. [DOI] [PMC free article] [PubMed] [Google Scholar]
- 9.Inglese M, Bester M. Diffusion imaging in multiple sclerosis: research and clinical implications. NMR Biomed. 2010;23:865–872. doi: 10.1002/nbm.1515. [DOI] [PMC free article] [PubMed] [Google Scholar]
- 10.Whittall KP, MacKay AL, Li DK, Vavasour IM, Jones CK, Paty DW. Normal-appearing white matter in multiple sclerosis has heterogeneous, diffusely prolonged T(2) Magn Reson Med. 2002;47:403–408. doi: 10.1002/mrm.10076. [DOI] [PubMed] [Google Scholar]
- 11.Neema M, Goldberg-Zimring D, Guss ZD, et al. 3 T MRI relaxometry detects T2 prolongation in the cerebral normal-appearing white matter in multiple sclerosis. Neuroimage. 2009;46:633–641. doi: 10.1016/j.neuroimage.2009.03.001. [DOI] [PMC free article] [PubMed] [Google Scholar]
- 12.Rocca MA, Pagani E, Absinta M, et al. Altered functional and structural connectivities in patients with MS: a 3-T study. Neurology. 2007;69:2136–2145. doi: 10.1212/01.wnl.0000295504.92020.ca. [DOI] [PubMed] [Google Scholar]
- 13.Brass SD, Chen NK, Mulkern RV, Bakshi R. Magnetic resonance imaging of iron deposition in neurological disorders. [Review] Top Magn Reson Imaging. 2006;17:31–40. doi: 10.1097/01.rmr.0000245459.82782.e4. [DOI] [PubMed] [Google Scholar]
- 14.Song SK, Yoshino J, Le TQ, et al. Demyelination increases radial diffusivity in corpus callosum of mouse brain. Neuroimage. 2005;26:132–140. doi: 10.1016/j.neuroimage.2005.01.028. [DOI] [PubMed] [Google Scholar]
- 15.Kinoshita Y, Ohnishi A, Kohshi K, Yokota A. Apparent diffusion coefficient on rat brain and nerves intoxicated with methylmercury. Environ Res. 1999;80:348–354. doi: 10.1006/enrs.1998.3935. [DOI] [PubMed] [Google Scholar]
- 16.Beaulieu C. The basis of anisotropic water diffusion in the nervous system - a technical review [Review] NMR Biomed. 2002;15:435–455. doi: 10.1002/nbm.782. [DOI] [PubMed] [Google Scholar]
- 17.Trapp BD, Nave KA. Multiple sclerosis: an immune or neurodegenerative disorder? [Review] Annu Rev Neurosci. 2008;31:247–269. doi: 10.1146/annurev.neuro.30.051606.094313. [DOI] [PubMed] [Google Scholar]
- 18.Lassmann H. Multiple sclerosis: is there neurodegeneration independent from inflammation? J Neurol Sci. 2007;259:3–6. doi: 10.1016/j.jns.2006.08.016. [DOI] [PubMed] [Google Scholar]
- 19.Chard D, Miller D. Is multiple sclerosis a generalized disease of the central nervous system? An MRI perspective. Curr Opin Neurol. 2009;22:214–218. doi: 10.1097/wco.0b013e32832b4c62. [DOI] [PubMed] [Google Scholar]
- 20.Charil A, Filippi M. Inflammatory demyelination and neurodegeneration in early multiple sclerosis. J Neu Sci. 2007;259:7–15. doi: 10.1016/j.jns.2006.08.017. [DOI] [PubMed] [Google Scholar]
- 21.Hasan KM, Kamali A, Rollins NK. The need for spatially standardized methods in clinical applications of diffusion tensor imaging of white matter. Radiology. 2009;253:571–572. doi: 10.1148/radiol.2532090920. [DOI] [PubMed] [Google Scholar]
- 22.Janardhan V, Bakshi R. Quality of life and its relationship to brain lesions and atrophy on magnetic resonance images in 60 patients with multiple sclerosis. Arch Neurol. 2000;57:1485–1491. doi: 10.1001/archneur.57.10.1485. [DOI] [PubMed] [Google Scholar]
- 23.Fischl B, Salat DH, Busa E, et al. Whole brain segmentation: automated labeling of neuroanatomical structures in the human brain. Neuron. 2002;33:341–355. doi: 10.1016/s0896-6273(02)00569-x. [DOI] [PubMed] [Google Scholar]
- 24.Hasan KM. A framework for quality control and parameter optimization in diffusion tensor imaging: theoretical analysis and validation. Magn Reson Imaging. 2007;25:1196–1202. doi: 10.1016/j.mri.2007.02.011. [DOI] [PMC free article] [PubMed] [Google Scholar]
- 25.Courchesne E, Chisum HJ, Townsend J, et al. Normal brain development and aging: quantitative analysis at in vivo MR imaging in healthy volunteers. Radiology. 2000;216:672–682. doi: 10.1148/radiology.216.3.r00au37672. [DOI] [PubMed] [Google Scholar]
- 26.Walimuni IS, Abid H, Hasan KM. A computational framework to quantify tissue microstructural integrity using conventional MRI macrostructural volumetry. Comput Biol Med. 2010 doi: 10.1016/j.compbiomed.2010.10.009. [DOI] [PubMed] [Google Scholar]
- 27.Desikan RS, Ségonne F, Fischl B, et al. An automated labeling system for subdividing the human cerebral cortex on MRI scans into gyral based regions of interest. Neuroimage. 2006;31:968–980. doi: 10.1016/j.neuroimage.2006.01.021. [DOI] [PubMed] [Google Scholar]
- 28.Aubert-Broche B, Grova C, Pike GB, Collins DL. Clustering of atlas-defined cortical regions based on relaxation times and proton density. Neuroimage. 2009;47:523–532. doi: 10.1016/j.neuroimage.2009.04.079. [DOI] [PubMed] [Google Scholar]
- 29.Sajja BR, Datta S, He R, et al. Unified approach for multiple sclerosis lesion segmentation on brain MRI. Ann Biomed Eng. 2006;34:142–151. doi: 10.1007/s10439-005-9009-0. [DOI] [PMC free article] [PubMed] [Google Scholar]
- 30.Narayanan S, Fu L, Pioro E, et al. Imaging of axonal damage in multiple sclerosis: spatial distribution of magnetic resonance imaging lesions. Ann Neurol. 1997;41:385–391. doi: 10.1002/ana.410410314. [DOI] [PubMed] [Google Scholar]
- 31.Zijdenbos AP, Forghani R, Evans AC. Automatic “pipeline” analysis of 3-D MRI data for clinical trials: application to multiple sclerosis. IEEE Trans Med Imaging. 2002;21:1280–1291. doi: 10.1109/TMI.2002.806283. [DOI] [PubMed] [Google Scholar]
- 32.Charil A, Dagher A, Lerch JP, Zijdenbos AP, Worsley KJ, Evans AC. Focal cortical atrophy in multiple sclerosis: relation to lesion load and disability. Neuroimage. 2007;34:509–517. doi: 10.1016/j.neuroimage.2006.10.006. [DOI] [PubMed] [Google Scholar]
- 33.Vellinga MM, Geurts JJ, Rostrup E, et al. Clinical correlations of brain lesion distribution in multiple sclerosis. J Magn Reson Imaging. 2009;29:768–773. doi: 10.1002/jmri.21679. [DOI] [PubMed] [Google Scholar]
- 34.Brett M, Leff AP, Rorden C, Ashburner J. Spatial normalization of brain images with focal lesions using cost function masking. Neuroimage. 2001;14:486–500. doi: 10.1006/nimg.2001.0845. [DOI] [PubMed] [Google Scholar]
- 35.Pagani E, Filippi M, Rocca MA, Horsfield MA. A method for obtaining tract-specific diffusion tensor MRI measurements in the presence of disease: application to patients with clinically isolated syndromes suggestive of multiple sclerosis. NeuroImage. 2005;26:258–265. doi: 10.1016/j.neuroimage.2005.01.008. [DOI] [PubMed] [Google Scholar]
- 36.Fu L, Wolfson C, Worsley KJ, et al. Statistics for investigation of multimodal MR imaging data and an application to multiple sclerosis patients. NMR Biomed. 1996;9:339–346. doi: 10.1002/(SICI)1099-1492(199612)9:8<339::AID-NBM422>3.0.CO;2-X. [DOI] [PubMed] [Google Scholar]
- 37.Zou KH, Tuncali K, Silverman SG. Correlation and simple linear regression. Radiology. 2003;227:617–622. doi: 10.1148/radiol.2273011499. [DOI] [PubMed] [Google Scholar]
- 38.Sailer M, Fischl B, Salat D, et al. Focal thinning of the cerebral cortex in multiple sclerosis. Brain. 2003;126:1734–1744. doi: 10.1093/brain/awg175. [DOI] [PubMed] [Google Scholar]
- 39.Hasan KM, Walimuni IS, Kramer LA, Frye RE. Human brain atlas-based volumetry and relaxometry: application to healthy development and natural aging. Magn Reson Med. 2010;64:1382–1389. doi: 10.1002/mrm.22515. [DOI] [PubMed] [Google Scholar]
- 40.Georgiades CS, Itoh R, Golay X, van Zijl PC, Melhem ER. MR imaging of the human brain at 1.5 T: regional variations in transverse relaxation rates in the cerebral cortex. AJNR Am J Neuroradiol. 2001;22:1732–1737. [PMC free article] [PubMed] [Google Scholar]
- 41.Pierpaoli C, Jezzard P, Basser PJ, Barnett A, Di Chiro G. Diffusion tensor MR imaging of the human brain. Radiology. 1996;201:637–648. doi: 10.1148/radiology.201.3.8939209. [DOI] [PubMed] [Google Scholar]
- 42.Castriota-Scanderbeg A, Fasano F, Hagberg G, Nocentini U, Filippi M, Caltagirone C. Coefficient (Dav) is more sensitive than fractional anisotropy in monitoring progression of irreversible tissue damage in focal nonactive multiple sclerosis lesions. AJNR Am J Neuroradiol. 2003;24:663–670. [PMC free article] [PubMed] [Google Scholar]
- 43.Mukherjee P, Miller JH, Shimony JS, et al. Diffusion-tensor MR imaging of gray and white matter development during normal human brain maturation. AJNR Am J Neuroradiol. 2002;23:1445–1456. [PMC free article] [PubMed] [Google Scholar]
- 44.Filippi M, Rocca MA. MRI evidence for multiple sclerosis as a diffuse disease of the central nervous system [Review] J Neurol. 2005;252:v16–24. doi: 10.1007/s00415-005-5004-5. [DOI] [PubMed] [Google Scholar]
- 45.Vrenken H, Pouwels PJ, Geurts JJ, et al. Altered diffusion tensor in multiple sclerosis normal-appearing brain tissue: cortical diffusion changes seem related to clinical deterioration. J Magn Reson Imaging. 2006;23:628–636. doi: 10.1002/jmri.20564. [DOI] [PubMed] [Google Scholar]
- 46.Evangelou N, Esiri MM, Smith S, Palace J, Matthews PM. Quantitative pathological evidence for axonal loss in normal appearing white matter in multiple sclerosis. Ann Neurol. 2000;47:391–395. [PubMed] [Google Scholar]
- 47.Wegner C, Esiri MM, Chance SA, Palace J, Matthews PM. Neocortical neuronal, synaptic, and glial loss in multiple sclerosis. Neurology. 2006;67:960–967. doi: 10.1212/01.wnl.0000237551.26858.39. [DOI] [PubMed] [Google Scholar]
- 48.Brooks DJ, Leenders KL, Head G, Marshall J, Legg NJ, Jones T. Studies on regional cerebral oxygen utilisation and cognitive function in multiple sclerosis. J Neurol Neurosurg Psychiatry. 1984;47:1182–1191. doi: 10.1136/jnnp.47.11.1182. [DOI] [PMC free article] [PubMed] [Google Scholar]
- 49.Blinkenberg M, Rune K, Jensen CV, et al. Cortical cerebral metabolism correlates with MRI lesion load and cognitive dysfunction in MS. Neurology. 2000;54:558–564. doi: 10.1212/wnl.54.3.558. [DOI] [PubMed] [Google Scholar]
- 50.Bakshi R, Miletich RS, Kinkel PR, Emmet ML, Kinkel WR. High-resolution fluorodeoxyglucose positron emission tomography shows both global and regional cerebral hypometabolism in multiple sclerosis. J Neuroimaging. 1998;8:228–234. doi: 10.1111/jon199884228. [DOI] [PubMed] [Google Scholar]
- 51.Brownell B, Hughes JT. The distribution of plaques in the cerebrum in multiple sclerosis. J Neurol Neurosurg Psychiatry. 1962;25:315–320. doi: 10.1136/jnnp.25.4.315. [DOI] [PMC free article] [PubMed] [Google Scholar]
- 52.Aboitiz F, Scheibel AB, Fisher RS, Zaidel E. Fiber composition of the human corpus callosum. Brain Res. 1992;598:143–153. doi: 10.1016/0006-8993(92)90178-c. [DOI] [PubMed] [Google Scholar]
- 53.Cader S, Johansen-Berg H, Wylezinska M, et al. Discordant white matter N-acetylasparate and diffusion MRI measures suggest that chronic metabolic dysfunction contributes to axonal pathology in multiple sclerosis. NeuroImage. 2007;36:19–27. doi: 10.1016/j.neuroimage.2007.02.036. [DOI] [PubMed] [Google Scholar]
- 54.Ciccarelli O, Werring DJ, Barker GJ, et al. A study of the mechanisms of normal-appearing white matter damage in multiple sclerosis using diffusion tensor imaging--evidence of Wallerian degeneration. J Neurol. 2003;250:287–292. doi: 10.1007/s00415-003-0992-5. [DOI] [PubMed] [Google Scholar]
- 55.Rosas HD, Liu AK, Hersch S, Glessner M, Ferrante RJ, Salat DH, van der Kouwe A, Jenkins BG, Dale AM, Fischl B. Regional and progressive thinning of the cortical ribbon in Huntington’s disease. Neurology. 2002;58:695–701. doi: 10.1212/wnl.58.5.695. [DOI] [PubMed] [Google Scholar]
- 56.Derakhshan M, Caramanos Z, Giacomini PS, Narayanan S, Maranzano J, Francis SJ, Arnold DL, Collins DL. Evaluation of automated techniques for the quantification of grey matter atrophy in patients with multiple sclerosis. Neuroimage. 2010;52:1261–1267. doi: 10.1016/j.neuroimage.2010.05.029. [DOI] [PubMed] [Google Scholar]
- 57.Pellicano C, Gallo A, Li X, Ikonomidou VN, Evangelou IE, Ohayon JM, Stern SK, Ehrmantraut M, Cantor F, McFarland HF, Bagnato F. Relationship of cortical atrophy to fatigue in patients with multiple sclerosis. Arch Neurol. 2010;67:447–453. doi: 10.1001/archneurol.2010.48. [DOI] [PubMed] [Google Scholar]
- 58.Hasan KM, Walimuni IS, Humaira A, Datta S, Wolinsky JS, Narayana PA. Human Brain Atlas-based Multimodal MRI Analysis of Volumetry, Diffusimetry, Relaxometry and Lesion Distribution in Multiple Sclerosis Patients and Healthy Adult Controls: Implications for understanding the Pathogenesis of Multiple Sclerosis and Consolidation of Quantitative MRI Results in MS. Journal of Neurological Sciences. 2011 doi: 10.1016/j.jns.2011.09.015. [DOI] [PMC free article] [PubMed] [Google Scholar]
- 59.Hasan KM, Walimuni IS, Humaira A, Frye RE, Ewing-Cobbs L, Wolinsky JS, Narayana PA. Multimodal Quantitative Magnetic Resonance Imaging of Thalamic Development and Aging across the Human Lifespan: Implications to Neurodegeneration in Multiple Sclerosis. Journal of Neuroscience. 2011 doi: 10.1523/JNEUROSCI.4184-11.2011. (in press) [DOI] [PMC free article] [PubMed] [Google Scholar]
- 60.Walimuni IS, Hasan KM. Atlas-based Investigation of Human Brain Tissue Microstructural Spatial Heterogeneity and Interplay between Transverse Relaxation Time and Radial Diffusivity. NeuroImage. 57:1402–1410. doi: 10.1016/j.neuroimage.2011.05.063. [DOI] [PMC free article] [PubMed] [Google Scholar]
- 61.Hasan KM, Walimuni IS, Kramer LA, Narayana PA. Human brain iron mapping using atlas-based T(2) relaxometry. Magn Reson Med. 2011 doi: 10.1002/mrm.23054. [DOI] [PMC free article] [PubMed]
- 62.Moraal B, Roosendaal SD, Pouwels PJ, et al. Multi-contrast, isotropic, single-slab 3D MR imaging in multiple sclerosis. Eur Radiol. 2008;18:2311–2320. doi: 10.1007/s00330-008-1009-7. [DOI] [PubMed] [Google Scholar]


