

Abstract
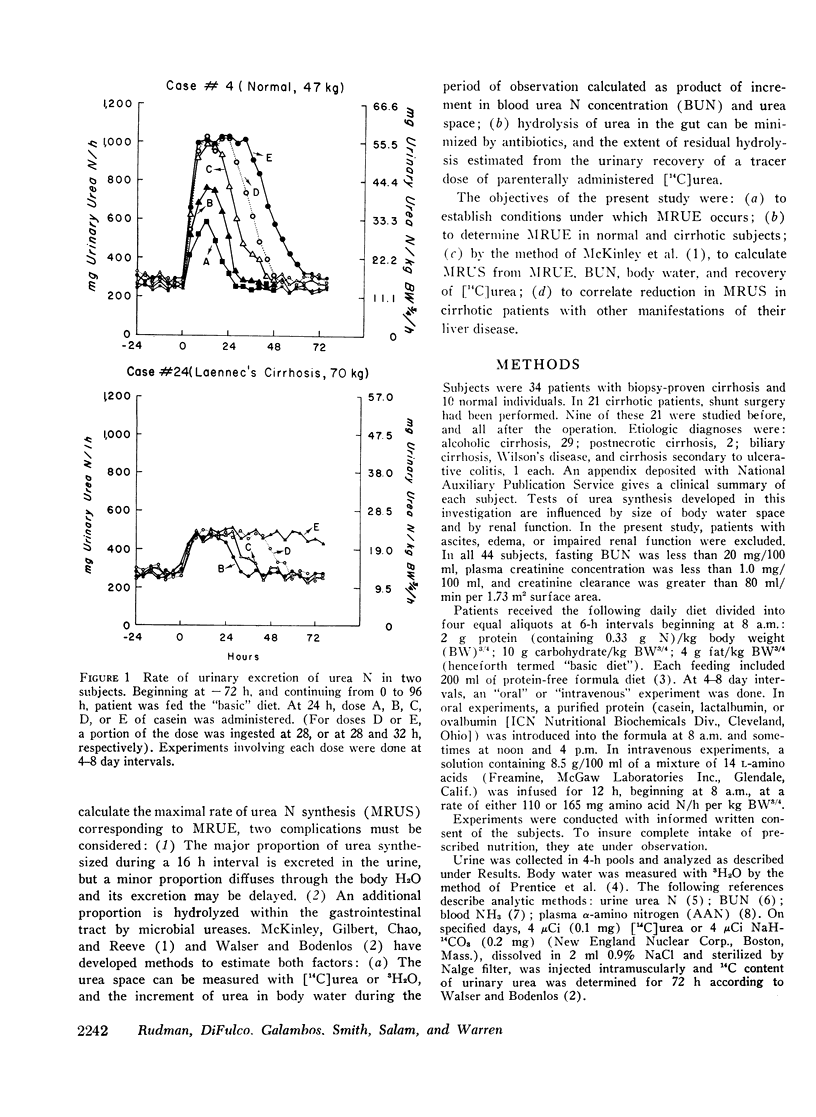
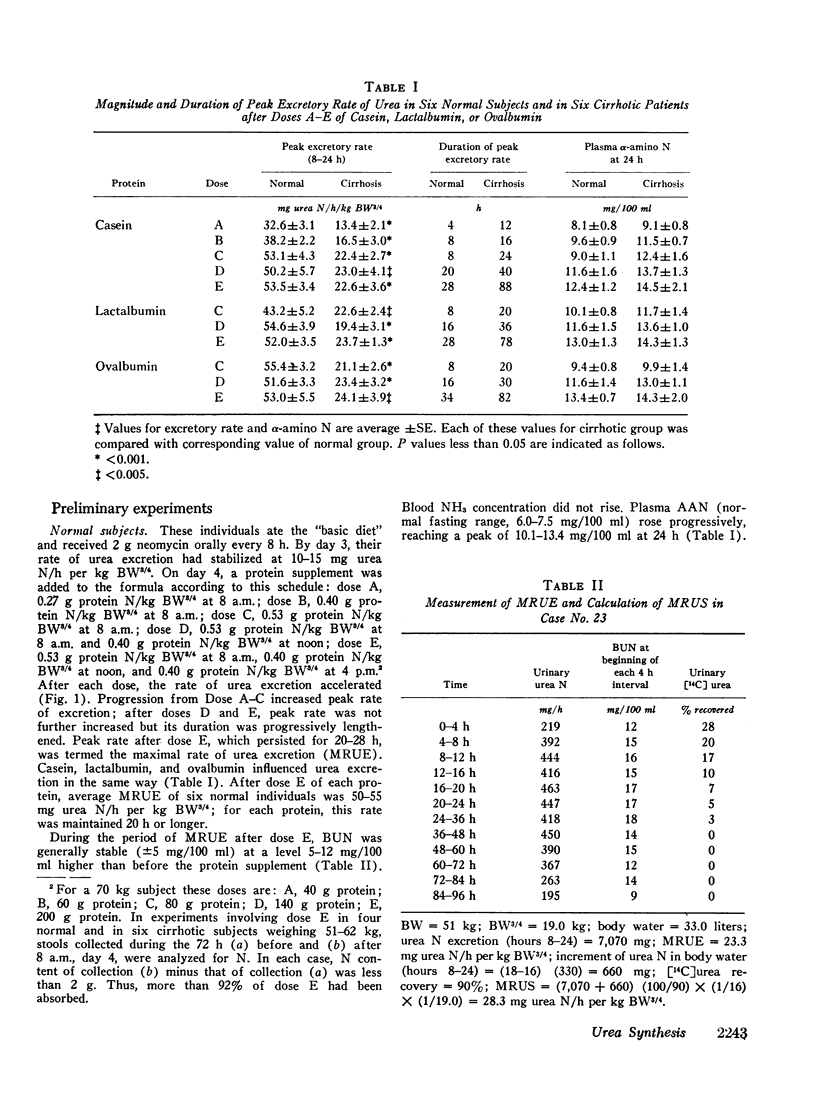
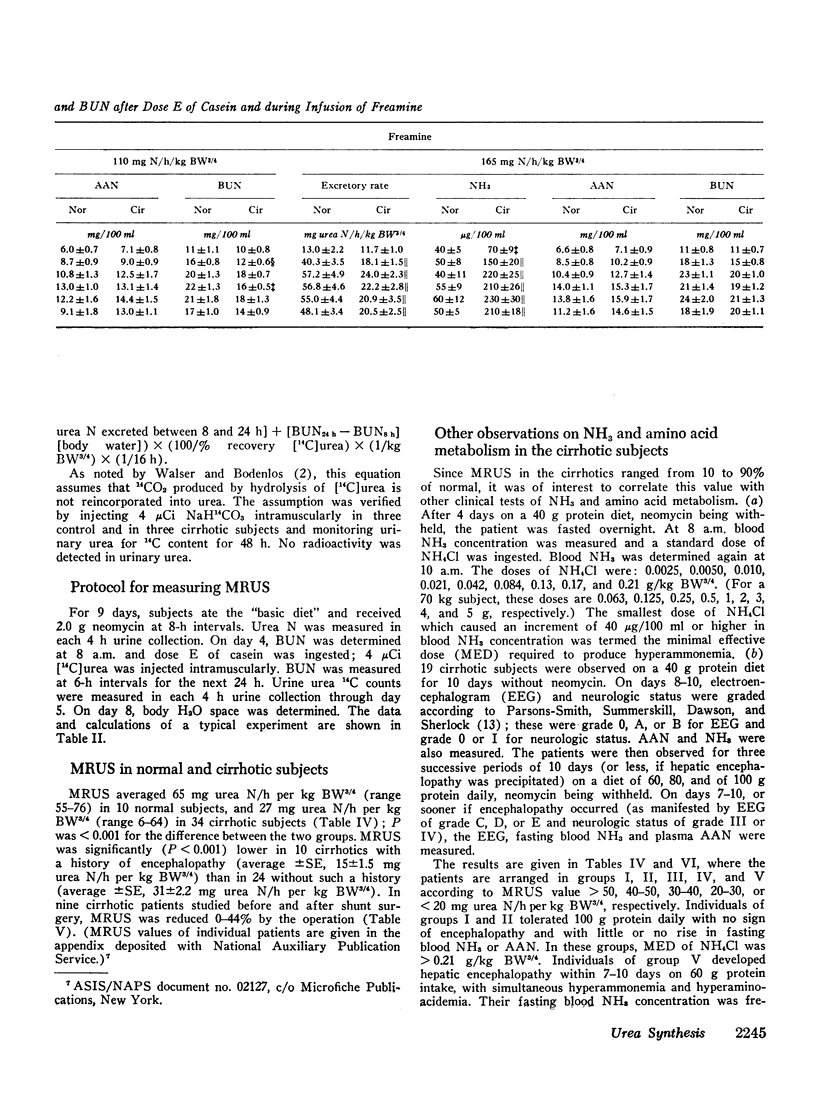
When normal individuals eat 0.33 g protein N/kg body weight (BW)¾ per day, they excrete 10-15 mg urea N/h per kg BW¾. If they now ingest (at 0 h) 0.27 (dose A), 0.40 (dose B), 0.53 (dose C), 0.94 (dose D), or 1.33 (dose E) g protein N/kg BW¾ (in the form of casein, ovalbumin, or lactalbumin), the rate of urea N excretion accelerates within 4 h. At dose C a maximal rate of urinary urea N excretion (MRUE) is reached, which averages 55 mg urea N/h per kg BW¾ and which persists for 16 h. Higher doses of protein do not further accelerate urea excretion, but prolong the duration of MRUE to 28 h (after dose E). Blood urea N (BUN) rises by 7-20 mg/100 ml during the first 8 h after dose C to E, and remains stable within ±5 mg/100 ml during the ensuing 8-28 h of MRUE. Each increment of protein above dose C causes a further increment in plasma α-amino N. During infusion of free amino acids at a rate of 110 or 165 mg amino acid N/h per kg BW¾ for 12 h, rate of urea excretion increases to the MRUE value produced by dose C-E of oral protein.
These findings indicate that MRUE corresponds to a period of maximal rate of urea synthesis (MRUS). MRUS is greater than MRUE because one fraction of newly formed urea is hydrolyzed in the gastrointestinal tract, and another fraction may accumulate temporarily in body water during the MRUE period. Oral neomycin reduces the proportion of urea hydrolyzed in the gut to less than 20%; its extent is measured by recovery in the urine of a tracer dose of [14C]urea injected intramuscularly during determination of MRUE. Accumulation of urea in body water is estimated from increment in BUN during the period of MRUE measurement (8-24 h after dose E of casein) and from body water measured with 3H2O. Then MRUS is calculated as: ([mg urea N excreted between 8 and 24 h after dose E] + [BUN at 24 h − BUN at 8 h] × [body water]) × (100/% recovery [14C]urea) × (1/kg BW¾) × (1/16 h).
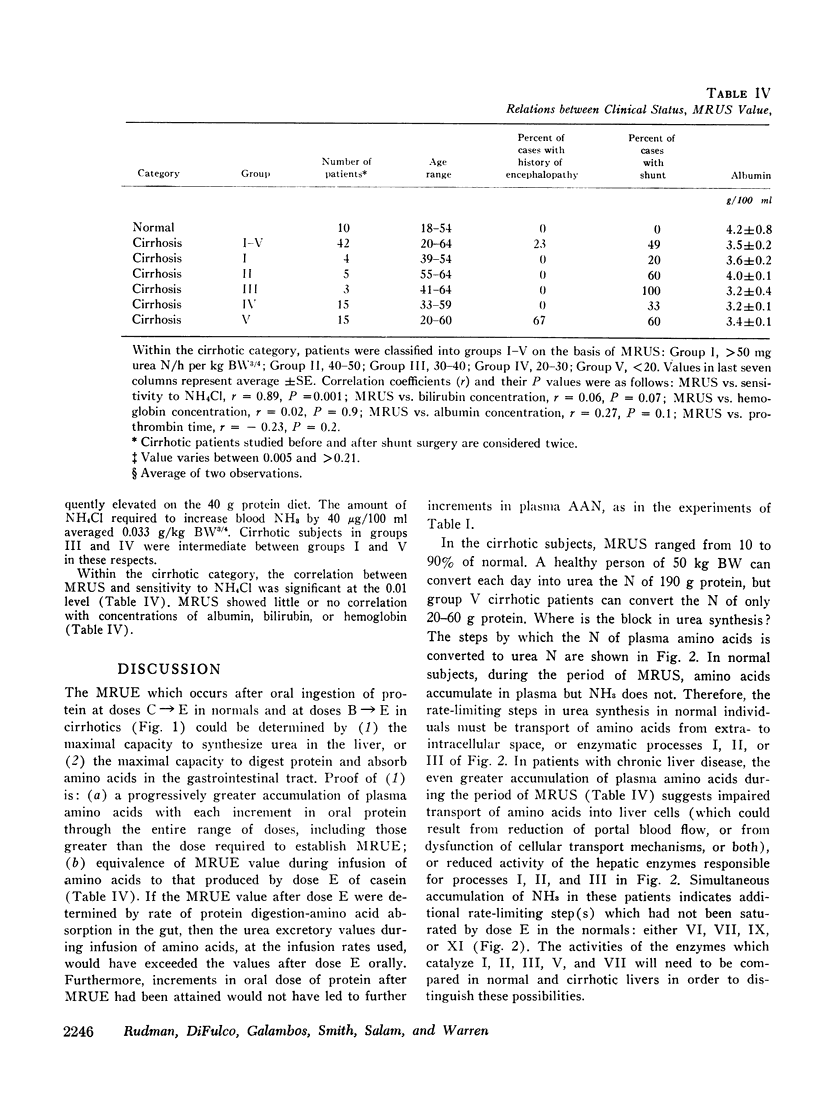
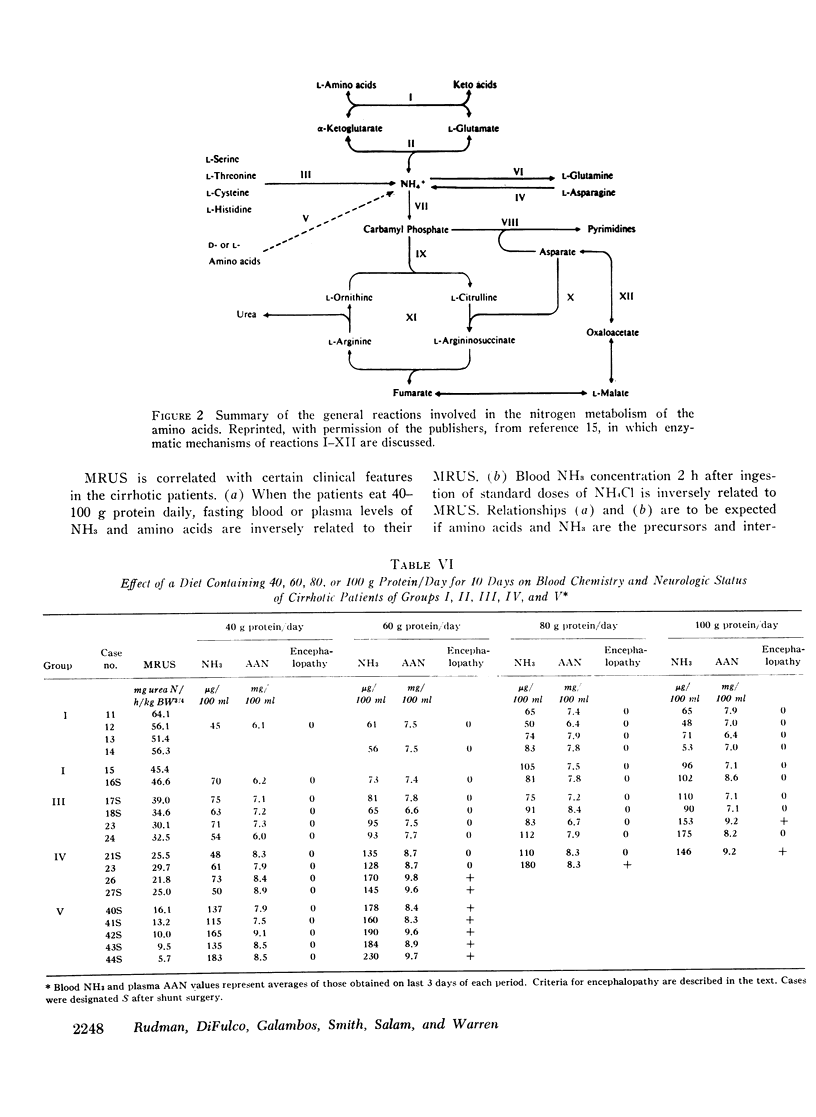
MRUS in 10 normal subjects averaged 65 mg urea N/h per kg BW¾ (range 55-76), and in 34 cirrhotics 27 mg urea N/h per kg BW¾ (range 6-64). Among 19 cirrhotic patients fed 40, 60, 80, or 100 g protein daily for successive 10 day periods, the occurrences of hyperammonemia, hyperaminoacidemia, and encephalopathy at each level of protein intake were inversely related to MRUS value.
Full text
PDF

Selected References
These references are in PubMed. This may not be the complete list of references from this article.
- FOY J. M., SCHNIEDEN H. Estimation of total body water (virtual tritium space) in the rat, cat, rabbit, guinea-pig and man, and of the biological half-life of tritium in man. J Physiol. 1960 Nov;154:169–176. doi: 10.1113/jphysiol.1960.sp006571. [DOI] [PMC free article] [PubMed] [Google Scholar]
- MARSH W. H., FINGERHUT B., KIRSCH E. Determination of urea nitrogen with the diacetyl method and an automatic dialyzing apparatus. Am J Clin Pathol. 1957 Dec;28(6):681–688. doi: 10.1093/ajcp/28.6_ts.681. [DOI] [PubMed] [Google Scholar]
- McKinley J. E., Gilbert D. B., Chao P. Y., Reeve E. B. Urea metabolism and distribution in rabbits treated with neomycin. Am J Physiol. 1970 Feb;218(2):491–497. doi: 10.1152/ajplegacy.1970.218.2.491. [DOI] [PubMed] [Google Scholar]
- PARSONS-SMITH B. G., SUMMERSKILL W. H., DAWSON A. M., SHERLOCK S. The electroencephalograph in liver disease. Lancet. 1957 Nov 2;273(7001):867–871. doi: 10.1016/s0140-6736(57)90005-3. [DOI] [PubMed] [Google Scholar]
- PRENTICE T. C., SIRI W., BERLIN N. I., HYDE G. M., PARSONS R. J., JOINER E. E., LAWRENCE J. H. Studies of total body water with tritium. J Clin Invest. 1952 Apr;31(4):412–418. doi: 10.1172/JCI102624. [DOI] [PMC free article] [PubMed] [Google Scholar]
- Rudman D., Akgun S., Galambos J. T., McKinney A. S., Cullen A. B., Gerron G. G., Howard C. H. Observations on the nitrogen metabolism of patients with portal cirrhosis. Am J Clin Nutr. 1970 Sep;23(9):1203–1211. doi: 10.1093/ajcn/23.9.1203. [DOI] [PubMed] [Google Scholar]
- SKEGGS L. T., Jr An automatic method for colorimetric analysis. Am J Clin Pathol. 1957 Sep;28(3):311–322. doi: 10.1093/ajcp/28.3_ts.311. [DOI] [PubMed] [Google Scholar]
- Salam A. A., Warren W. D., LePage J. R., Viamonte M. R., Hutson D., Zeppa R. Hemodynamic contrasts between selective and total portal-systemic decompression. Ann Surg. 1971 May;173(5):827–844. doi: 10.1097/00000658-197105000-00022. [DOI] [PMC free article] [PubMed] [Google Scholar]
- WALSER M., BODENLOS L. J. Urea metabolism in man. J Clin Invest. 1959 Sep;38:1617–1626. doi: 10.1172/JCI103940. [DOI] [PMC free article] [PubMed] [Google Scholar]
- WILLIAMS R. E., SMITH A. H., YOUNG G. A., PARSONS F. M., REED G. W. EXPERIMENTAL COMPARISON OF THE RATES AND VOLUMES OF DISTRIBUTION OF UREA, CREATININE, N-ACETYL-4-AMINOPHENAZONE, AND TRITIATED WATER. Br J Surg. 1964 Jul;51:544–549. doi: 10.1002/bjs.1800510721. [DOI] [PubMed] [Google Scholar]