Abstract
PGE2 plays an important role in the regulation of fluid metabolism chiefly via antagonizing vasopressin-induced osmotic permeability in the distal nephron, but its enzymatic sources remain uncertain. The present study was undertaken to investigate the potential role of microsomal PGE synthase (mPGES)-1 in the regulation of urine concentrating ability after water deprivation (WD). Following 24-h WD, wild-type (WT) mice exhibited a significant reduction in urine volume, accompanied by a significant elevation in urine osmolality compared with control groups. In contrast, in response to WD, mPGES-1 knockout (KO) mice had much less urine volume and higher urine osmolality. Analysis of plasma volume by measurement of hematocrit and by using a nanoparticle-based method consistently demonstrated that dehydrated WT mice were volume depleted, which was significantly improved in the KO mice. WD induced a twofold increase in urinary PGE2 output in WT mice, which was completely blocked by mPGES-1 deletion. At baseline, the KO mice had a 20% increase in V2 receptor mRNA expression in the renal medulla but not the cortex compared with WT controls; the expression was unaffected by WD irrespective of the genotype. In response to WD, renal medullary aquaporin-2 (AQP2) mRNA exhibited a 60% increase in WT mice, and this increase was greater in the KO mice. Immunoblotting demonstrated increased renal medullary AQP2 protein abundance in both genotypes following WD, with a greater increase in the KO mice. Similar results were obtained by using immunohistochemistry. Paradoxically, plasma AVP response to WD seen in WT mice was absent in the KO mice. Taken together, these results suggest that mPGES-1-derived PGE2 reduces urine concentrating ability through suppression of renal medullary expression of V2 receptors and AQP2 but may enhance it by mediating the central AVP response.
Keywords: aquaporin-2; PGE2, vasopressin
the maintenance of water balance relies on renal control of urine concentrating capability, which is chiefly determined by the hormonal regulation of water permeability in the collecting duct (CD) (4, 5). AVP is a primary regulator of osmotic water permeability in the CD. AVP is synthesized in the hypothalamus and stored in vesicles at the posterior pituitary, where it is released into the bloodstream in response to a rise in plasma osmolality. A primary mechanism by which AVP controls urine concentration involves PKA-dependent phosphorylation of the water channel aquaporin-2 (AQP2) that leads to shuttling of the channel to the apical membrane in the CD (22, 23). Besides AVP, locally produced autocrine/paracrine factors, such as PGs, also participate in regulation of water excretion. PGE2 is a major prostanoid produced in the kidney, and it has an established role in the regulation of water homeostasis. In the microdissected nephron segments, the inner medullary collecting duct (IMCD) has the highest capacity of PGE2 generation (1). In IMCD, PGE2 exerts dual effects on CD water permeability (2). When added to the AVP-prestimulated CD, the E series of PGs potently inhibit water absorption and cAMP accumulation (7, 9, 10), consistent with their in vivo diuretic effects (19). However, in the absence of AVP, basolateral PGE2 increases osmotic water absorption (10). Additionally, PGE2 may indirectly regulate water excretion by reduction of osmotic gradient via inhibition of solute transport in the thick ascending limbs (TAL) (36) or by an increase in renal medullary blood flow (33, 34).
To date, three major forms of PGE synthase (PGES) have been cloned and characterized: microsomal PGES (mPGES)-1, mPGES-2, and cytosolic PGES, with mPGES-1 being the best-characterized PGES (25). Expression of mPGES-1 is induced by proinflammatory stimuli, often in parallel with the expression of cyclooxygenase-2 (COX-2) (27, 29). whereas the expression of mPGES-2 and cPGES is rather constitutive. Within the kidney, cPGES was mainly expressed in the collecting duct (39) while mPGES-2 had a wide distribution (38). Recently, mice have been engineered with specific deletions in each of these three PGES enzymes. Although each of the enzymes is capable of generating PGE2 in vitro, only deletion of mPGES-1 but not mPGES-2 or cPGES affects tissue or urine PGE2 levels in vivo (12, 26, 30, 37). The functional role of mPGES-2 and cPGES remains elusive.
Within the kidney, mPGES-1 predominates in the CD, a major site for production and action of PGE2 . In light of the well-recognized role of PGE2 in the CD as discussed above, we postulate that mPGES-1 may be involved in regulation of urine dilution and concentration. The importance of this investigation is also highlighted by the rising interest in mPGES-1 inhibitors as a next generation of analgesics; a better understanding the physiological function of mPGES-1 will help predict the safety profile of mPGES-1 inhibitors. Using mPGES-1 knockout (KO) mice, we demonstrated an essential role of mPGES-1 in the regulation of water metabolism (17, 35). mPGES-1 deletion significantly delayed the diuretic response following acute water loading and markedly improved the polyuria induced by lithium treatment (12, 27). In extension of these observations, the present study provides evidence for a role of mPGES-1 in regulation of urine concentrating capability during WD.
METHODS
Animals.
mPGES-1 WT and KO mice were originally generated by Trebino et al. (37). This mouse colony was propagated at the University of Utah and maintained on a mixed DBA/1lacJxC57/BL6x129/Sv background. In all studies, 3- to 4-mo-old male mice were used. All protocols employing mice were conducted in accordance with the principles and guidance of the University of Utah Institutional Animal Care and Use Committee.
WD.
Male mPGES-1 WT and KO mice were subjected to 24-h WD by removing water bottles from the metabolic cages where the mice were housed (Hatteras Instruments). The control groups of animals had free access to water and standard food, while the WD groups were provided only with standard food. Urine (24 h) was collected, and the urine volume and osmolality were measured. After the urine collection, mice were euthanized and kidneys were harvested for gene expression analysis.
Hematocrit measurement.
The sphenous vein was punctured using a 23-gauge needle, and one drop of blood (≈5–10 μl) was collected by using a 10-μl capillary glass (Idaho Technology, Salt Lake City, UT). One side of the tube was sealed with Hemato-Seal and then centrifuged for 2 min in a Thermo IEC (Boston, MA) microcentrifuge machine.
Nanoparticle measurement of plasma volume.
Measurement of plasma volume is traditionally reliant on the use of a dye tracer such as indocyanine green and Evans blue, which suffer numerous drawbacks including binding plasma proteins. Eisner et al. (3) have recently developed a nanotechnology-based method for accurate measurement of plasma volume in mice. Briefly, conscious mice received the fluorescent nanoparticle atto647 via a single bolus injection of suspension (100 μg in 50 μl of saline) into the tail vein. Seven minutes after tail vein injection, whole blood samples were collected via puncturing of the submandibular vein. Fluorescence measurements were performed by using FluostarOptima (BMG Labtech). Plasma volume was determined based on the dilution factors.
Immunoblotting.
Lysates of the kidney medullary tissue were stored at −80°C until assayed. Protein concentrations were determined using a Coomassie reagent. An equal amount of the whole tissue protein was denatured at 100°C for 10 min, separated by SDS-PAGE, and transferred to nitrocellulose membranes. The blots were blocked overnight with 5% nonfat dry milk in Tris-buffered saline (TBS), followed by incubation for 1 h with rabbit polyclonal antibodies against AQP2 (gift from Dr. Mark A. Knepper). The blots were washed with TBS followed by incubation with goat anti-rabbit horseradish peroxidase (HRP)-conjugated secondary antibody for AQP2. Immune complexes were detected using enhanced chemiluminescence methods. The immunoreactive bands were quantified using the Gel and Graph Digitizing System (Silk Scientific).
Immunohistochemistry.
Kidneys from the mPGES-1 WT and KO mice after 24 h WD were fixed with 3% paraformaldehyde and embedded in paraffin. Kidney sections (4-μm thickness) were incubated in 3% H2O2 for 10 min at room temperature to block endogenous peroxidase activity. The slides were boiled in antigen retrieval solution (1 mmol/l Tris·HCl, 0.1 mmol/l EDTA, pH = 8.0) for 15 min at high power in a microwave oven. The sections were incubated with anti-AQP2 antibody by a dilution of 1:2,000 overnight at 4°. After washing of sections with PBS, the secondary antibody was applied, and the signals were visualized using the ABC kit (Santa Cruz Biotechnology).
Enzyme immunoassay.
Urine samples were centrifuged for 5 min at 10,000 rpm and diluted 1:1 with enzyme immunoassay buffer. Concentrations of urinary PGE2 were determined by enzyme immunoassay (Cayman Chemical, Ann Arbor, MI) according to the manufacturer's instructions. The plasma AVP level was also determined by an enzyme immunoassay (EIA) kit (Cayman Chemical) following the manufacturer's instructions.
Quantitative RT-PCR.
Total RNA was isolated from renal tissues using TRIzol. One microgram of total RNA was denatured at 65°C for 5 min, and cDNA synthesis was then performed at 42°C for 1 h using Superscript reverse transcriptase (BRL, Gaithersburg, MD). Oligonucleotides were designed using Primer3 software (available at http://frodo.wi.mit.edu). The sequences of the oligonucleotide primers in the public sequence are as shown in the Table 1. Quantitative (q) PCR amplification was performed using SYBR Green Master Mix (Applied Biosystems) and the Prism 7500 Real-Time PCR Detection System (Applied Biosystems). Cycling conditions were 95°C for 10 min, followed by 40 repeats of 95°C for 15 s and 60°C for 1 min.
Table 1.
Sequences of primers for real-time PCR
| Gene | Primer Sequence | Accession Number |
|---|---|---|
| β-Actin | 5′-gctctggctcctagcaccat-3′ | NM_007393 |
| 5′-gccaccgatccacacagagt-3′ | ||
| NKCC2 | 5′-gctcttcattcgcctctcct-3′ | NM_011389 |
| 5′-agcctattgacccaccgaac-3′ | ||
| AQP2 | 5′-ggacctggctgtcaatgct-3′ | NM_009699 |
| 5′-atcggtggaggcaaagatg-3′ | ||
| V2 | 5′-tcatcagccaccacacca-3′ | NM_019404 |
| 5′-agatagcagggccagttcag-3′ | ||
| COX-1 | 5′-cattgcacatccatccactc-3′ | BC023322 |
| 5′-ccaaagcggacacagacac-3′ | ||
| COX-2 | 5′-aggactctgctcacgaagga-3′ | NM_011198 |
| 5′-tgacatggattggaacagca-3′ | ||
| mPGES-1 | 5′-agcacactgctggtcatcaa-3′ | BC024960 |
| 5′-ctccacatctgggtcactcc-3′ | ||
| mPGES-2 | 5′-gctggggctgtaccacac-3′ | NM_133783 |
| 5′-gattcacctccaccacctga-3′ | ||
| cPGES | 5′-ggtagagaccgccggagt-3′ | NM_019766 |
| 5′-tcgtaccactttgcagaagca-3′ | ||
| UTA1 | 5′-gacagtgagacgcagtgaag-3′ | AF366052 |
| 5′-acggtctcagagctctcttc-3′ | ||
| UTA3 | 5′-agcagaaatgctctccttgc-3′ | NM_030683 |
| 5′-cctcagggttagggaggaac-3′ |
See text for definitions.
Data analysis.
Data are summarized as means ± SE. Statistical analysis was performed using one-way ANOVA or Student's t-test as appropriate. P < 0.05 was considered statistically significant.
RESULTS
Effect of mPGES-1 deletion on urine concentrating ability after 24-h WD.
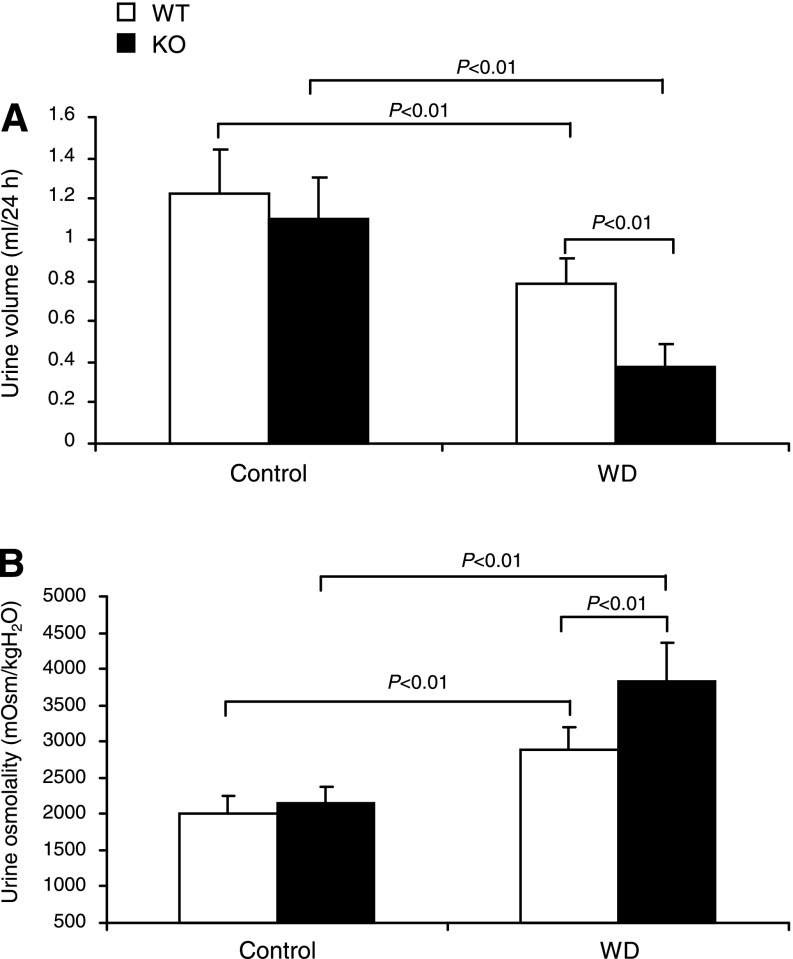
Dehydrated WT mice had reduced urine volume (0.79 ± 0.12 vs. 1.22 ± 0.22 ml, P < 0.01) and elevated urine osmolality (2,877.6 ± 323.3 vs. 2,019.64 ± 239.3 mosmol/kgH2O, P < 0.01) (Fig. 1, A and B). At baseline, neither urine volume nor urine osmolality was different between WT and mPGES-1 KO mice. However, in response to WD, the KO mice had a much lower urine volume ( 0.374 ± 0.11 ml, P < 0.01 vs. WT/WD) and much higher urine osmolality (3,836.3 ± 523.3 mosmol/kgH2O, P < 0.01 vs. WT/WD) (Fig. 1, A and B), suggesting enhanced urine concentrating ability.
Fig. 1.
Urine volume (A) and urine osmolality (B) in mPGES-1 wild-type (WT) and knockout (KO) mice following 24-h water deprivation (WD). WT/Control: n = 11; WT/WD: n = 21; KO/Control: n = 11; KO/WD: n = 21. Values are means ± SE.
Effect of mPGES-1 deletion on plasma volume.
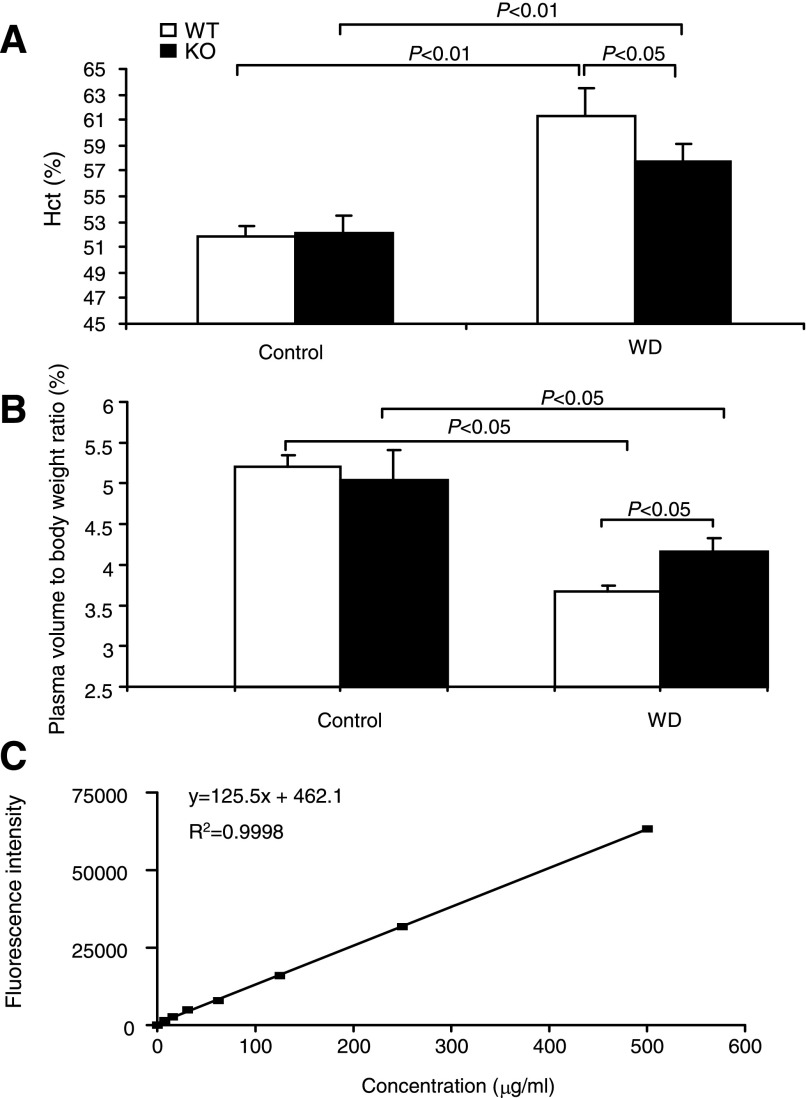
Improved urine concentrating ability in mPGES-1 KO mice may lead to better preservation of plasma volume in response to WD. We initially measured hematocrit as an indirect assessment of plasma volume. As expected, WD elevated hematocrit from 51.84 ± 0.88 to 61.3 ± 2.17% (P < 0.01) in WT mice, indicating volume depletion. In contrast, WD-induced elevation of hematocrit was less in the KO mice, suggesting improvement of fluid loss (57.7 ± 1.3%, P < 0.05 vs. WT WD) (Fig. 2A). Subsequently, we performed a newly developed nanoparticle-based method to directly measure plasma volume. At baseline, plasma volume was not different between the genotypes; after WD, plasma volume was deceased in both genotypes, but this decrease was less in the KO mice (Fig. 2B).
Fig. 2.
Evaluation of plasma volume in microsomal PGE synthase (mPGES)-1 WT and KO mice following 24-h WD. A: hematocrit (Hct); n = 16–19/group. B: nanoparticle measurement of plasma volume. Expressed is plasma volume relative to body weight; n = 4–10/group. C: linear relationship between fluorescent intensity and the concentration of nanoparticles. Values are means ± SE.
Effect of mPGES-1 deletion on expression of renal medullary transporters.
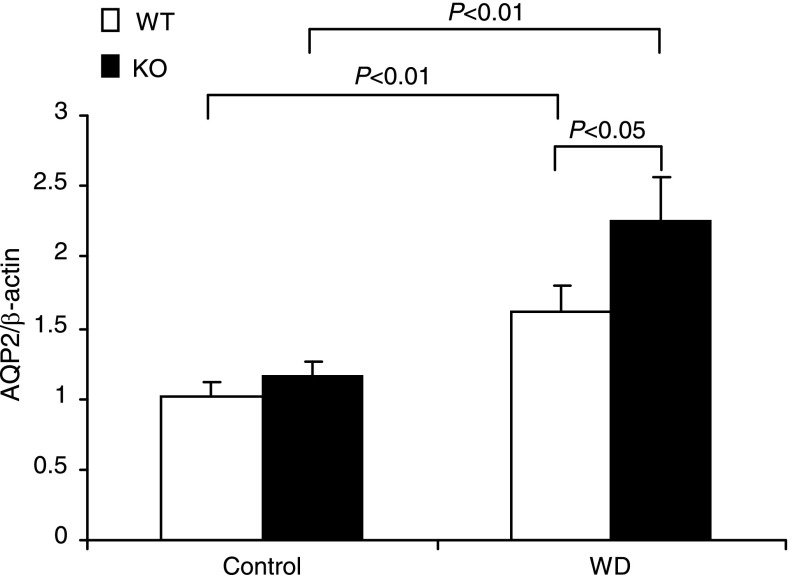
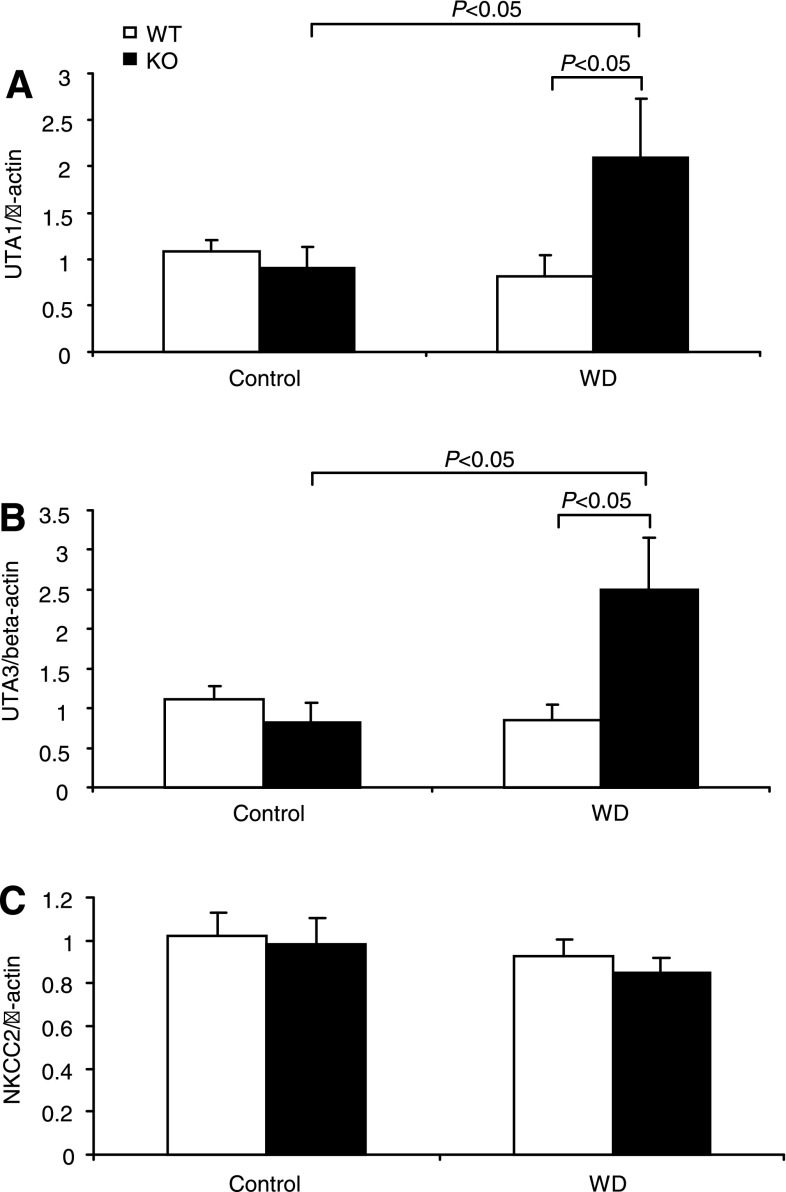
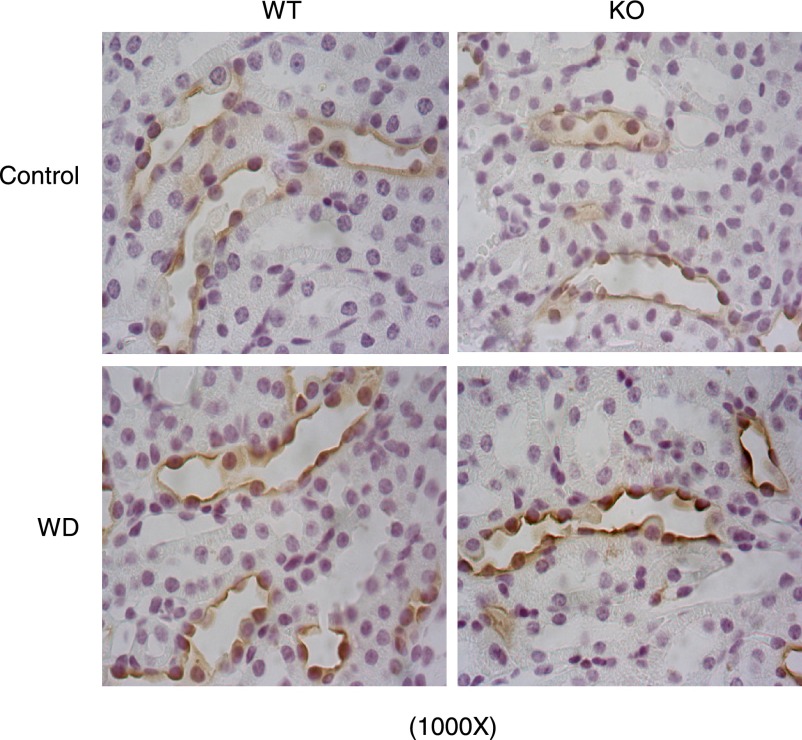
The expression levels of AQP2, Na-K-Cl cotransporter (NKCC2), and urea transporter A (UTA) are key determinants of urine concentrating capability. AQP2 and UTA (20) are abundantly expressed in the CD, and NKCC2 is mainly expressed in the thick ascending limb. We examined the effect of mPGES-1 deletion on the expression levels of these transporters following WD. WD elevated renal medullary AQP2 mRNA by 60% in WT mice (P < 0.05 vs. control), with 110% upregulation of AQP2 mRNA in mPGES-1 KO mice (P < 0.05 vs. WT/WD) (Fig. 3), contrasting to unaltered NKCC2 mRNA in any groups (see Fig. 6C). Immunoblotting detected AQP2 protein as multiple bands of 35–50 (glycosylated) and 29 kDa (native) in the medulla (Fig. 4). Consistent with the mRNA data, the abundances of 29- and 35- to 50-kDa bands in WT mice exhibited a trend and significant increase in response to WD, respectively (Fig. 4). The elevation of 35- to 50-kDa bands but not the 29-kDa band was potentiated by mPGES-1 deletion, indicating a potential role of glycosylated AQP2 in the regulation of urine concentrating ability during the WD (Fig. 4). Immunohistochemistry showed the significant increase in AQP2 abundance in the renal medulla after WD with a higher induction in the KO mice (Fig. 5). Moreover, WD strikingly elevated UTA1 (Fig. 6A) and UTA3 (Fig. 6B) mRNA expression in the renal medulla of mPGES-1 KO mice by 2.1- and 2.5-fold, respectively, with no effect in the mPGES-1 WT mice.
Fig. 3.
qRT-PCR analysis of aquaporin-2 (AQP2) in the renal medulla of mPGES-1 WT and KO mice following 24-h WD. Expression was normalized by β-actin; n = 6–9/group. Values are means ± SE.
Fig. 6.
qRT-PCR analysis of urea transporter (UT)-A1 (A), UT-A3 (B), and Na-K-2Cl cotransporter (NKCC2; C) in the renal medulla of mPGES-1 WT and KO mice following 24-h WD. Expression was normalized by β-actin; n = 6–9/group. Values are means ± SE.
Fig. 4.
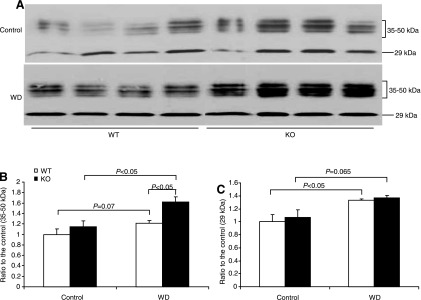
Immunoblot analysis of AQP2 protein expression in the renal medulla of mPGES-1 WT and KO mice following 24-h WD. A: immunoblots of AQP2. B: densitometric analysis of 35- to 50-kDa and the 29-kDa bands; n = 4/group. Values are means ± SE.
Fig. 5.
Immunohistochemistry of AQP2 in the renal medulla of mPGES-1 WT and KO mice following 24-h WD. Shown are representatives from 6–9 mice/group.
Effect of mPGES-1 deletion on plasma AVP and renal V2 receptor expression levels.
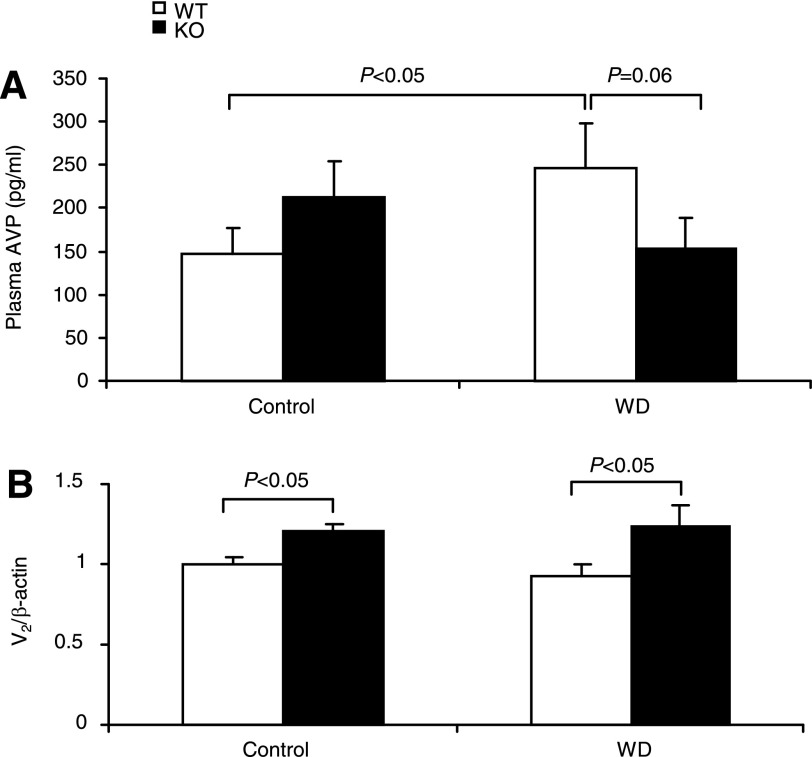
AVP via V2 receptors targets AQP2, thereby determining water permeability in the CD. Thus we measured plasma AVP by using EIA and renal medullary V2 mRNA by using qRT-PCR. As expected, WD significantly elevated plasma AVP levels (246.7 ± 52.4 vs. 147.5 ± 29.3 pg/ml, P < 0.01) in WT mice. In contrast, the AVP response was completely blocked by mPGES-1 deletion (Fig. 7A). By qRT-PCR, renal medullary V2 mRNA was significantly elevated in mPGES-1 KO mice under both control and dehydration states compared with WT controls; the expression was unaffected by WD irrespective of the genotype (Fig. 7B).
Fig. 7.
Plasma AVP and renal medullary V2 mRNA expression in mPGES-1 WT and KO mice following 24-h WD. A: plasma AVP was measured by using enzyme immunoassay (EIA). B: renal medullary V2 mRNA was determined by using qRT-PCR and normalized by β-actin; n = 6–9/group. Values are means ± SE.
Effect of mPGES-1 deletion on PGE2 production.
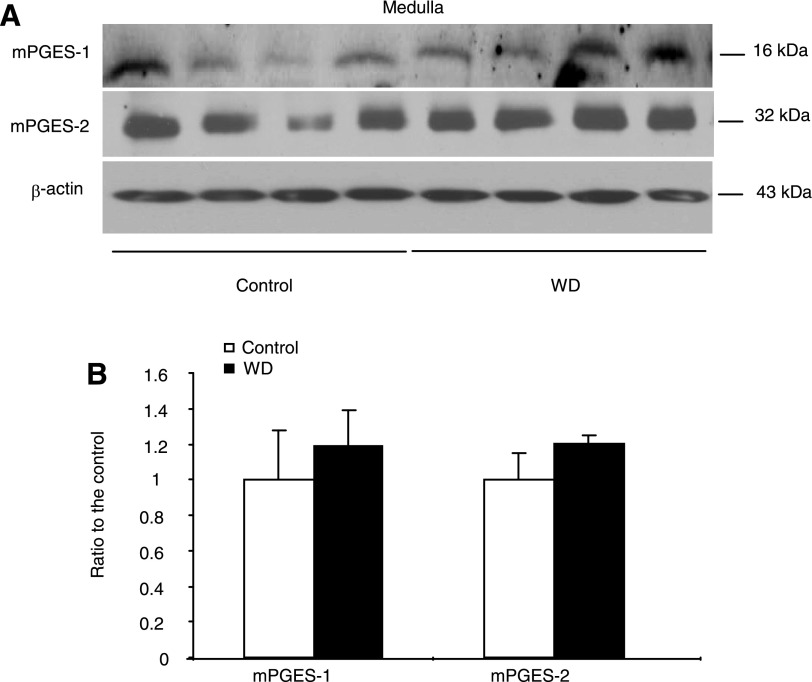
Urinary excretion of PGE2 generally reflects renal synthesis. We measured urinary PGE2 output by using EIA. WD induced a significant increase in urinary PGE2 excretion in WT mice (892.04 ± 191.1 vs. 558.8 ± 69.5 pg/24 h, P < 0.05). In contrast, mPGES-1 KO mice had reduced baseline PGE2 excretion (383.5 ± 79.3 pg/24 h, P < 0.05 vs. WT/Control) that did not respond to WD at all (286.2 ± 79.9 pg/24 h, P > 0.05 vs. WT/WD) (Fig. 8A). This finding suggested mPGES-1 as a dominant source of renal PGE2 synthesis during WD. Next, we examined the regulation of key enzymes in PGE2 biosynthesis in the renal medulla by using qRT-PCR. Interestingly, only COX-2 mRNA was elevated in response to WD, contrasting with the lack of response of COX-1 and any of the three PGES isoforms (Fig. 8, B–F). mPGES-1 KO mice displayed a compensatory response in the expression of COX-1, COX-2, mPGES-2, and cPGES under basal or WD conditions (Fig. 8, C–F). The immunoblot analysis of mPGES-1 and mPGES-2 in the medulla of WT mice further confirmed the real-time PCR results ( Fig. 9, A and B) showing the unaltered protein levels after WD.
Fig. 8.
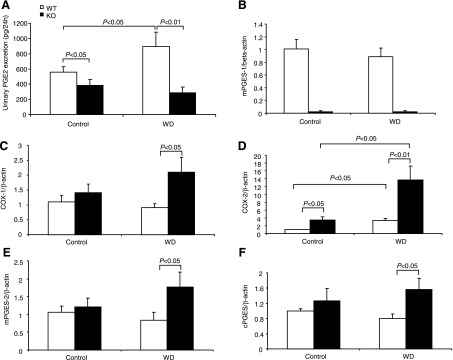
Urinary PGE2 excretion (A) and renal medullary mRNA expression of mPGES-1 (B), cyclooxygenase (COX)-1 (C), COX-2 (D), mPGES-2 (E), and cPGES (F) in mPGES-1 WT and KO mice following 24-h WD. Urinary PGE2 was determined by EIA and renal medullary gene expression by qRT-PCR; n = 6–9/group. Values are means ± SE.
Fig. 9.
Immunoblotting analysis of mPGES-1 and mPGES-2 protein expression in the renal medulla of mPGES-1 WT mice following 24-h WD. A: immunoblots of mPGES-1, mPGES-2, and β-actin. B: densitometric analysis of mPGES-1 and mPGES-2; n = 4/group. Values are means ± SE.
DISCUSSION
mPGES-1 has been characterized as a primary PGES with implications for serving as a molecular target for the next generation of anti-inflammatory drugs (25, 37). It is of critical importance to understand the potential role of this enzyme in physiological processes. Increasing numbers of studies support a physiological role of mPGES-1 in renal control of sodium and water balance and blood pressure. In particular, our previous studies demonstrated an impaired diuretic/natriuretic response in mPGES-1 KO mice following acute water or salt loading or lithium treatment; these mice were susceptible to hypertension development or fluid retention in response to ANG II infusion, chronic salt loading, or aldosterone or DOCA-salt treatment (14–18). However, other investigators found no role for mPGES-1 during chronic salt loading. Employing mPGES-1 KO mice, the present study provides additional evidence supporting an important role for mPGES-1 in the regulation of water homeostasis during WD. We found that mPGES-1 deletion potentiated urinary concentrating capability after WD, as reflected by more effective reduction of urine volume and elevation of urinary osmolality and better preservation of plasma volume. The enhanced urine concentrating capability in the null mice was associated with increased renal medullary expression of the V2 receptor, AQP2, UTA1, and UTA3 receptors but not NKCC2. Paradoxically, these mice exhibit a suppressed but not enhanced response to plasma AVP.
Previous in vitro studies suggest a complex roles for PGE2 in the regulation of water permeability in the CD (2). When added to the AVP-prestimulated CD, the E series of PGs potently inhibit water absorption and cAMP accumulation (7, 9, 10). However, in the absence of AVP, basolateral PGE2 increases osmotic water absorption (10). The availability of mPGES-1 KO mice offers a unique opportunity to evaluate the in vivo role of endogenously produced PGE2 in renal water handling. Under baseline condition, we found no difference between the genotypes in terms of changes in urine volume or urine osmolality. However, following WD, mPGES-1-null mice were more effective than their WT controls in reducing urine volume and increasing urine osmolality, and in preserving plasma volume. These findings establish an in vivo role for mPGES-1-derived PGE2 in the negative regulation of urine concentration. In general, these findings support the inhibitory effect of PGE2 on AVP-induced water permeability in the CD but provide no evidence for the stimulatory effect of PGE2 on baseline water permeability.
The inhibitory effect of mPGES-1-derived PGE2 on AVP-induced water permeability is compatible with the diuretic property of this prostanoid. Consistent with this notion, our previous studies report that mPGES-1 deletion attenuates the diuretic response to acute water loading and lithium-induced nephrogenic diabetes insipidus. However, the present study disagrees with the report of Francois et al. (6) that mPGES-1 KO mice had normal urine concentrating capability. The reason for the discrepancy is unknown, but differences in experimental protocols are likely accountable. For example, the length of WD (12 h in the Francois et al. study vs. 24 h in ours) and the method of urine collection (bladder massage in the Francois et al. study vs. metabolic cages in ours) are different between the two studies.
In addition to the peripheral effect of PGs in the CD, a sizable literature documents central mechanisms by which PGs regulate fluid metabolism. Although systemic administration of PGE1 induces a diuretic response (28), an intracerebroventricular (icv) injection of PGE2 in rabbits (8) and rats (31) increased the concentrations of the antidiuretic hormone AVP. The stimulatory effect of PGE2 on AVP release appears to be direct since this effect was observed in isolated rat posterior pituitary fragments (8) and in the guinea pig hypothalamo-neurohypophyseal complex (HNC) (11) in cultures. Along this line, in the explants of HNC, indomethacin reduces the release of AVP in response to hypertonic treatment without affecting baseline values (11). In vivo studies report that pretreatment with systemic administration of indomethacin attenuates the AVP response to histamine or endotoxin (LPS) (24). Consistent with these observations, we found that mPGES-1 KO mice had normal AVP concentrations at baseline but lacked a response to WD of AVP release. These findings suggest that mPGES-1-derived PGE2 may serve as a major mediator of AVP release in response to WD while the basal production of AVP may be regulated by other factors such as histamine (24).
The biological action of PGE2 is mediated by G protein-coupled E-prostanoid receptors designated EP1, EP2, EP3 and EP4 (2), and these four subtypes of EP receptors couple to distinct signaling pathways. Among the four EP subtypes, EP1 is reported to play an important role in the regulation of AVP release from the hypothalamus (21). EP1 deletion did not affect plasma levels of AVP at baseline but abolished the response of plasma AVP to WD, an observation almost analogous to our finding. Together, it is likely that mPGES-1-derived PGE2 via EP1 mediates the central response of AVP during WD. However, it is important to note that despite the similar changes in the AVP response observed in mice lacking the PGE synthase and EP1 receptors, the changes in urine concentration between the two strains of null mice are completely opposite, with urine concentration being enhanced in mPGES-1-null mice but reduced in EP1-null mice. The reason for this phenomenon is unclear but may reflect differences in the renal response to WD. In support of this notion, renal expressions of V2 receptors and AQP2 were elevated by mPGES-1 deletion but unaffected by EP1 deletion, suggesting involvement of EP subtypes other than EP1 receptors in the inhibition of AVP-stimulated water permeability in the CD. The inhibitory effect of PGE2 on AVP-stimulated water reabsorption and cAMP production in cortical collecting ducts is partially reversed by an inhibitor of protein kinase C (10), suggesting the requirement of a calcium signal. Besides EP1 receptors, EP3 receptors are a candidate EP subtype which may signal via elevation of intracellular calcium to inhibit the action of AVP. However, EP3-null mice concentrate and dilute their urine normally in response to WD and water loading, respectively, arguing against a major role EP3 receptors may play in modulation of the action of AVP. Of interesting note, EP4 receptors are also expressed in the CD (13), and activation of EP2/EP4 receptors in this nephron segment increases trafficking and ser-264 phosphorylation of AQP2, enhancing urine concentration (32). We suspect that the net effect of mPGES-1 deletion may depend on the balanced effects of EP2/EP4 vs. EP1/EP3 receptors on water transport.
In the present study, mPGES-1 gene deletion completely abolished WD-induced urinary PGE2 excretion, supporting mPGES-1 as a dominant source of increased renal PGE2 synthesis during WD. This notion is compatible with the reports that deletion of neither mPGES-2 nor cPGES affected PGE2 synthesis in vivo. We subsequently examined renal medullary expression of COX-1, COX-2, mPGES-1, mPGES-2, and cPGES following WD. Interestingly, increased expression was only observed for COX-2 but not the rest of the enzymes. These results suggest that the regulatory process of WD-induced renal PGE2 synthesis may be primarily determined by COX-2 although mPGES-1 is required for PGE2 synthesis.
In summary, the present study examined urine concentrating capability of mPGES-1-null mice following WD. The null mice exhibited enhanced urine concentrating capability and are more effective in preserving plasma volume. Paradoxically, the response of plasma AVP is blunted in these mice. These findings suggest distinct roles of central and peripheral mPGES-1 in regulation of urine concentrating mechanism.
GRANTS
This work was supported by a VA Merit Review, NIH grant DK079162, and a grant from the American Heart Association (to T. Yang). T. Yang is an Established Investigator of the American Heart Association and a Research Career Scientist at the Department of Veterans Affairs.
DISCLOSURES
No conflicts of interest, financial or otherwise, are declared by the authors.
AUTHOR CONTRIBUTIONS
Author contributions: Z.J. and G.L. performed experiments; Z.J, A.Z, and T.Y. analyzed data; Z.J. prepared figures; Z.J, A.Z, and T.Y. drafted manuscript; Z.D. and T.Y. interpreted results of experiments; Z.D, A.Z, and T.Y. edited and revised manuscript; A.Z. and T.Y. provided conception and design of research; A.Z. and T.Y. approved final version of manuscript.
ACKNOWLEDGMENTS
The authors thank Kenneth Wang and Hooisweng Ow (Hybrid Silica Technologies, Cambridge, MA) for providing atto647 and Pfizer for providing breeder pairs of mPGES-1 KO mice.
REFERENCES
- 1.Bonvalet JP, Pradelles P, Farman N. Segmental synthesis and actions of prostaglandins along the nephron. Am J Physiol Renal Fluid Electrolyte Physiol 253: F377–F387, 1987 [DOI] [PubMed] [Google Scholar]
- 2.Breyer MD, Breyer RM. Prostaglandin E receptors and the kidney. Am J Physiol Renal Physiol 279: F12–F23, 2000 [DOI] [PubMed] [Google Scholar]
- 3.Eisner COH, Yang T, Jia Z, Dimitriadis E, Li L, Wang K, Briggs J, Levine M, Schnermann J, Espey M. Measurement of plasma volume using fluorescent silica-based nanoparticles. J Appl Physiol 112: 681–687, 2012 [DOI] [PMC free article] [PubMed] [Google Scholar]
- 4.Fenton RA, Brond L, Nielsen S, Praetorius J. Cellular and subcellular distribution of the type-2 vasopressin receptor in the kidney. Am J Physiol Renal Physiol 293: F748–F760, 2007 [DOI] [PubMed] [Google Scholar]
- 5.Fenton RA, Knepper MA. Mouse models and the urinary concentrating mechanism in the new millennium. Physiol Rev 87: 1083–1112, 2007 [DOI] [PubMed] [Google Scholar]
- 6.Francois H, Facemire C, Kumar A, Audoly L, Koller B, Coffman T. Role of microsomal prostaglandin E synthase 1 in the kidney. J Am Soc Nephrol 18: 1466–1475, 2007 [DOI] [PubMed] [Google Scholar]
- 7.Grantham JJ, Orloff J. Effect of prostaglandin E1 on the permeability response of the isolated collecting tubule to vasopressin, adenosine 3′,5′-monophosphate, and theophylline. J Clin Invest 47: 1154–1161, 1968 [DOI] [PMC free article] [PubMed] [Google Scholar]
- 8.Hashimoto H, Noto T, Nakajima T. A study on the release mechanism of vasopressin and oxytocin. Neuropeptides 12: 199–206, 1988 [DOI] [PubMed] [Google Scholar]
- 9.Hebert RL, Jacobson HR, Breyer MD. PGE2 inhibits AVP-induced water flow in cortical collecting ducts by protein kinase C activation. Am J Physiol Renal Fluid Electrolyte Physiol 259: F318–F325, 1990 [DOI] [PubMed] [Google Scholar]
- 10.Hebert RL, Jacobson HR, Fredin D, Breyer MD. Evidence that separate PGE2 receptors modulate water and sodium transport in rabbit cortical collecting duct. Am J Physiol Renal Fluid Electrolyte Physiol 265: F643–F650, 1993 [DOI] [PubMed] [Google Scholar]
- 11.Ishikawa S, Saito T, Yoshida S. The effect of prostaglandins on the release of arginine vasopressin from the guinea pig hypothalamo-neurohypophyseal complex in organ culture. Endocrinology 108: 193–198, 1981 [DOI] [PubMed] [Google Scholar]
- 12.Jania LA, Chandrasekharan S, Backlund MG, Foley NA, Snouwaert J, Wang IM, Clark P, Audoly LP, Koller BH. Microsomal prostaglandin E synthase-2 is not essential for in vivo prostaglandin E2 biosynthesis. Prostaglandins Other Lipid Mediat 88: 73–81, 2008 [DOI] [PMC free article] [PubMed] [Google Scholar]
- 13.Jensen BL, Stubbe J, Hansen PB, Andreasen D, Skøtt O. Localization of prostaglandin E2 EP2 and EP4 receptors in the rat kidney. Am J Physiol Renal Physiol 280: F1001–F1009, 2001 [DOI] [PubMed] [Google Scholar]
- 14.Jia Z, Aoyagi T, Kohan DE, Yang T. mPGES-1 deletion impairs aldosterone escape and enhances sodium appetite. Am J Physiol Renal Physiol 299: F155–F166, 2010 [DOI] [PMC free article] [PubMed] [Google Scholar]
- 15.Jia Z, Aoyagi T, Yang T. mPGES-1 protects against DOCA-salt hypertension via inhibition of oxidative stress or stimulation of NO/cGMP. Hypertension 55: 539–546 [DOI] [PubMed] [Google Scholar]
- 16.Jia Z, Guo X, Zhang H, Wang MH, Dong Z, Yang T. Microsomal prostaglandin synthase-1-derived prostaglandin E2 protects against angiotensin II-induced hypertension via inhibition of oxidative stress. Hypertension 52: 952–959, 2008 [DOI] [PubMed] [Google Scholar]
- 17.Jia Z, Wang H, Yang T. Mice lacking mPGES-1 are resistant to lithium-induced polyuria. Am J Physiol Renal Physiol 297: F1689–F1696, 2009 [DOI] [PMC free article] [PubMed] [Google Scholar]
- 18.Jia Z, Zhang A, Zhang H, Dong Z, Yang T. Deletion of microsomal prostaglandin E synthase-1 increases sensitivity to salt loading and angiotensin II infusion. Circ Res 99: 1243–1251, 2006 [DOI] [PubMed] [Google Scholar]
- 19.Johnston HH, Herzog JP, Lauler DP. Effect of prostaglandin E1 on renal hemodynamics, sodium and water excretion. Am J Physiol 213: 939–946, 1967 [DOI] [PubMed] [Google Scholar]
- 20.Jung JY, Madsen KM, Han KH, Yang CW, Knepper MA, Sands JM, Kim J. Expression of urea transporters in potassium-depleted mouse kidney. Am J Physiol Renal Physiol 285: F1210–F1224, 2003 [DOI] [PubMed] [Google Scholar]
- 21.Kennedy CR, Xiong H, Rahal S, Vanderluit J, Slack RS, Zhang Y, Guan Y, Breyer MD, Hebert RL. Urine concentrating defect in prostaglandin EP1-deficient mice. Am J Physiol Renal Physiol 292: F868–F875, 2007 [DOI] [PubMed] [Google Scholar]
- 22.Knepper MA. Molecular physiology of urinary concentrating mechanism: regulation of aquaporin water channels by vasopressin. Am J Physiol Renal Physiol 272: F3–F12, 1997 [DOI] [PubMed] [Google Scholar]
- 23.Knepper MA, Verbalis JG, Nielsen S. Role of aquaporins in water balance disorders. Curr Opin Nephrol Hypertens 6: 367–371, 1997 [DOI] [PubMed] [Google Scholar]
- 24.Knigge U, Kjaer A, Kristoffersen U, Madsen K, Toftegaard C, Jorgensen H, Warberg J. Histamine and prostaglandin interaction in regulation of oxytocin and vasopressin secretion. J Neuroendocrinol 15: 940–945, 2003 [DOI] [PubMed] [Google Scholar]
- 25.Kudo I, Murakami M. Prostaglandin e synthase, a terminal enzyme for prostaglandin E2 biosynthesis. J Biochem Mol Biol 38: 633–638, 2005 [DOI] [PubMed] [Google Scholar]
- 26.Lovgren AK, Kovarova M, Koller BH. cPGES/p23 is required for glucocorticoid receptor function and embryonic growth but not prostaglandin E2 synthesis. Mol Cell Biol 27: 4416–4430, 2007 [DOI] [PMC free article] [PubMed] [Google Scholar]
- 27.Mancini JA, Blood K, Guay J, Gordon R, Claveau D, Chan CC, Riendeau D. Cloning, expression, and up-regulation of inducible rat prostaglandin e synthase during lipopolysaccharide-induced pyresis and adjuvant-induced arthritis. J Biol Chem 276: 4469–4475, 2001 [DOI] [PubMed] [Google Scholar]
- 28.Mills IH, Obika LF. Increased urinary kallikrein excretion during prostaglandin E1 infusion in anaesthetized dogs and its relation to natriuresis and diuresis. J Physiol 273: 459–474, 1977 [DOI] [PMC free article] [PubMed] [Google Scholar]
- 29.Murakami M, Naraba H, Tanioka T, Semmyo N, Nakatani Y, Kojima F, Ikeda T, Fueki M, Ueno A, Oh S, Kudo I. Regulation of prostaglandin E2 biosynthesis by inducible membrane-associated prostaglandin E2 synthase that acts in concert with cyclooxygenase-2. J Biol Chem 275: 32783–32792, 2000 [DOI] [PubMed] [Google Scholar]
- 30.Nakatani Y, Hokonohara Y, Kakuta S, Sudo K, Iwakura Y, Kudo I. Knockout mice lacking cPGES/p23, a constitutively expressed PGE2 synthetic enzyme, are peri-natally lethal. Biochem Biophys Res Commun 362: 387–392, 2007 [DOI] [PubMed] [Google Scholar]
- 31.Okuno T, Lindheimer MD, Oparil S. Central effects of prostaglandin E2 on blood pressure and plasma renin activity in rats. Role of the sympathoadrenal system and vasopressin. Hypertension 4: 809–816, 1982 [DOI] [PubMed] [Google Scholar]
- 32.Olesen ET, Rutzler MR, Moeller HB, Praetorius HA, Fenton RA. Vasopressin-independent targeting of aquaporin-2 by selective E-prostanoid receptor agonists alleviates nephrogenic diabetes insipidus. Proc Natl Acad Sci USA 108: 12949–12954, 2011 [DOI] [PMC free article] [PubMed] [Google Scholar]
- 33.Pallone TL. Vasoconstriction of outer medullary vasa recta by angiotensin II is modulated by prostaglandin E2. Am J Physiol Renal Fluid Electrolyte Physiol 266: F850–F857, 1994 [DOI] [PubMed] [Google Scholar]
- 34.Roman RJ, Lianos E. Influence of prostaglandins on papillary blood flow and pressure-natriuretic response. Hypertension 15: 29–35, 1990 [DOI] [PubMed] [Google Scholar]
- 35.Soodvilai S, Jia Z, Wang MH, Dong Z, Yang T. mPGES-1 deletion impairs diuretic response to acute water loading. Am J Physiol Renal Physiol 296: F1129–F1135, 2009 [DOI] [PMC free article] [PubMed] [Google Scholar]
- 36.Stokes JB. Effect of prostaglandin E2 on chloride transport across the rabbit thick ascending limb of Henle. Selective inhibitions of the medullary portion. J Clin Invest 64: 495–502, 1979 [DOI] [PMC free article] [PubMed] [Google Scholar]
- 37.Trebino CE, Stock JL, Gibbons CP, Naiman BM, Wachtmann TS, Umland JP, Pandher K, Lapointe JM, Saha S, Roach ML, Carter D, Thomas NA, Durtschi BA, McNeish JD, Hambor JE, Jakobsson PJ, Carty TJ, Perez JR, Audoly LP. Impaired inflammatory and pain responses in mice lacking an inducible prostaglandin E synthase. Proc Natl Acad Sci USA 100: 9044–9049, 2003 [DOI] [PMC free article] [PubMed] [Google Scholar]
- 38.Yang G, Chen L, Zhang Y, Zhang X, Wu J, Li S, Wei M, Zhang Z, Breyer MD, Guan Y. Expression of mouse membrane-associated prostaglandin E2 synthase-2 (mPGES-2) along the urogenital tract. Biochim Biophys Acta 1761: 1459–1468, 2006 [DOI] [PubMed] [Google Scholar]
- 39.Zhang Y, Schneider A, Rao R, Lu WJ, Fan X, Davis L, Breyer RM, Breyer MD, Guan Y. Genomic structure and genitourinary expression of mouse cytosolic prostaglandin E2 synthase gene. Biochim Biophys Acta 1634: 15–23, 2003 [DOI] [PubMed] [Google Scholar]


