Abstract
Insulin regulates glucose uptake into fat and muscle by modulating the subcellular distribution of GLUT4 between the cell surface and intracellular compartments. However, quantification of these translocation processes in muscle by classical subcellular fractionation techniques is confounded by contaminating microfibrillar protein; dynamic studies at the molecular level are almost impossible. In this study, we introduce a muscle-specific transgenic mouse model in which HA-GLUT4-GFP is expressed under the control of the MCK promoter. HA-GLUT4-GFP was found to translocate to the plasma membrane and T-tubules after insulin stimulation, thus mimicking endogenous GLUT4. To investigate the dynamics of GLUT4 trafficking in skeletal muscle, we quantified vesicles containing HA-GLUT4-GFP near the sarcolemma and T-tubules and analyzed insulin-stimulated exocytosis at the single vesicle level by total internal reflection fluorescence and confocal microscopy. We found that only 10% of the intracellular GLUT4 pool comprised mobile vesicles, whereas most of the GLUT4 structures remained stationary or tethered at the sarcolemma or T-tubules. In fact, most of the insulin-stimulated exocytosis emanated from pretethered vesicles, whereas the small pool of mobile GLUT4 vesicles was not significantly affected by insulin. Our data strongly suggest that the mobile pool of GLUT4 vesicles is not a major site of insulin action but rather locally distributed. Most likely, pretethered GLUT4 structures are responsible for the initial phase of insulin-stimulated exocytosis.
Keywords: hemagglutinin, glucose transporter 4, green fluorescent protein, insulin, fusion
muscle, especially skeletal muscle, is a major direct contributor to mammalian systemic glucose homeostasis (1, 10). It is now well established that insulin stimulates glucose transport in adipose and muscle cells through the translocation of glucose transporter 4 (GLUT4) from intracellular sites to the plasma membrane (5, 13, 15). However, whereas the molecular mechanism of GLUT4 translocation has been extensively studied in primary adipose cells and cultured adipocytes during the past years, relatively few studies have focused on GLUT4 trafficking in primary skeletal muscle cells (18, 20). In part, this is due to the presence of abundant microfibrillar protein and large amounts of nuclei such that most fractionation protocols suffer from poor resolution for the analysis of the subcellular distribution of GLUT4 in skeletal muscle. Likewise, because of technical limitations, morphological analyses of GLUT4 in skeletal muscle by photolabeling techniques, immunofluorescence, and electron microscopy have not provided sufficient information about the kinetics and dynamics of GLUT4 recycling through the multiple intracellular compartments.
Recent alternative approaches involving ectopic expression of tagged glucose transporters in culture cells offer novel opportunities for the molecular analysis of GLUT4 translocation (9, 11, 35). In these studies, recombinant GLUT4 reporters carrying extracellular epitope tags [e.g., myc, hemagglutinin (HA)] and/or fluorescent markers (e.g., GFP) are ectopically expressed and analyzed by fluorescence microscopy. In particular, studies of transfected primary adipose cells and 3T3-L1 adipocytes with HA-GLUT4-GFP fusion proteins allow detailed tracking of individual molecules and identification of the specific structures which mediate GLUT4 trafficking (2, 21, 23). Using multicolor total internal reflection fluorescence (TIRF) microscopy, it was demonstrated that insulin can regulate the tethering and fusion (22) of GLUT4 storage vesicles, as well as the post-fusion redistribution of GLUT4 molecules to the plasma membrane in adipose cells (33). However, in muscles cells, it still remains unclear which of these steps are regulated by insulin.
The analysis of epitope-tagged GLUT4 has become increasingly attractive for studying the mechanism of GLUT4 translocation in muscle cells. Among the most widely used clonal muscle cell lines are rat L6 cells and mouse C2C12 cells, both of which lines can differentiate from myoblasts into insulin-sensitive myotubes (27, 32). While these cell types differ in prominent features from adult skeletal muscle (e.g., degree of cross striation, T-tubule formation, and GLUT4 expression), L6 cells in particular have been extremely useful in studying the mechanism of insulin action and GLUT4 recycling (26). Recently, transient expression of fluorescent GLUT4-GFP fusion proteins in rat and mouse skeletal muscles have been used to investigate insulin-induced changes of the glucose transporter distribution in vivo using confocal microscopy (16, 18–19). While these studies have provided the first insights on GLUT4 translocation in muscles in vivo, detailed information on GLUT4 vesicle trafficking, and fusion at sarcolemma and T-tubules was still missing due to insufficient resolution of in vivo imaging.
In the present study, we introduce a transgenic mouse line that expresses HA-GLUT4-GFP specifically in skeletal muscle and the heart. Analysis of insulin-stimulated exocytosis at the single vesicle level by TIRF and confocal microscopy demonstrates remarkable differences in the dynamics of GLUT4 recycling between adipose and muscle cells. Our results indicate that the site of insulin action involves fusion of nonmobile, pretethered GLUT4 vesicles with the plasma membrane, similar to the docking and fusion of neurotransmitter-containing vesicles in synapses and neuroendocrine cells.
MATERIALS AND METHODS
HA-GLUT4-GFP transgenic mice.
The cDNA for HA-GLUT4-GFP (9) was cloned into pBSMCK-poly(A), which contains 6.5 kb of the muscle creatine kinase promoter and enhancer 1, untranslated exon 1, intron 1 including the enhancer region E2, the first 16 bp of exon 2, and a poly(A) signal (4). The 9-kb transgene was liberated from plasmid sequences by AscI/SacII digest, gel purified, and injected into fertilized eggs of FVB/N mice. The oocytes were implanted into C57BL/6J foster mothers, and the presence of the transgene in the offspring was assessed by PCR.
Male and female C57BL/6J-Tg (HA-GLUT4-GFP) transgenic and wild-type (hereafter control) littermates (N10) were analyzed at the age of 7–20 wk. Mice were typically reared three or four per cage on a 12:12-h light-dark cycle (lights on 0600–1800) and fed water and NIH-07 diet (11% calories from fat; Zeigler Brothers) ad libitum. All procedures were conducted in accordance with National Institutes of Health guidelines as approved by the Animal Care and Use Committee of the National Institute of Diabetes and Digestive and Kidney Diseases.
Body composition and serum analysis.
Body composition was measured in nonanesthetized mice using the Bruker minispec NMR analyzer mq10 (Bruker Optics). Blood obtained from the tail vein in the nonfasted state was used for biochemical serum analysis. Glucose levels were measured using a Glucometer Elite (Bayer). Insulin was assayed using radioimmunoassay (Linco Research). Serum triglycerides, cholesterol (Thermo DMA), and free fatty acids (FFA; Roche Applied Science) were measured according to the manufacturer's procedures.
Glucose tolerance and insulin tolerance tests.
For glucose tolerance tests, mice were fasted overnight, and glucose (2 g/kg body wt) was injected intraperitoneally. Blood glucose levels were measured at 0, 15, 30, 60, and 120 min after the injection. Insulin tolerance tests were performed on nonfasted mice at 8:00 AM. Human insulin (0.75 IU/kg; Eli Lilly) was injected intraperitoneally. Blood glucose levels were assessed at 0, 15, 30, 45, 60, 90, and 120 min after the injection.
Quantification and western blot analysis of GLUT4.
Ten HA-GLUT4-GFP transgenic and control mice were used for Western blot analysis. Mice were euthanized, and skeletal muscles were carefully dissected out and snap-frozen in liquid nitrogen. Isolated muscles wre thawed in 250 μl of TRIS-EDTA sucrose buffer, pH 7.4, and homogenized with a Brinkman Eppendorf polytron PT 1200E for 12 s on ice. The homogenate was centrifuged at 1,000 rpm for 10 min at 4°C, and the supernatant was then ultracentrifuged for 20 min at 4°C in at 80,000 g using an MLA80 rotor (Beckmann). The protein pellet after the latter centrifugation was resuspended in a small amount of TRIS-EDTA sucrose buffer, pH 7.4, and used for Western blot analysis with a monoclonal anti-HA antibody (α-HA; Covance) or polyclonal antibodies against GLUT4 [α-GLUT4; (9)] using the ECL method (GE Healthcare). For quantification of relative immunoreactivities, lysates from HeLa cells expressing either HA-GLUT4 or HA-GLUT4-GFP were separated by SDS-PAGE (50 μg protein/lane) and transferred onto nitrocellulose filters. The relative immunoreactivities of the recombinant glucose transporters were determined by probing the filters with either α-HA or α-GLUT4 antibodies using the ECL method and quantification of the respective bands using ImageQuant software (Applied Biosystems).
Glucose uptake in isolated muscles.
Mice were anesthetized with an intraperitoneal injection of pentobarbital sodium (40 mg/kg body wt) after an overnight fast. Soleus and extensor digitorum longus muscles were removed intact. FDB fibers were obtained by digestion in KRBH buffer with 0.5% collagenase for 2 h in a 37°C water shaking bath constantly oxygenated with 95% O2-5% CO2. After digestion, fibers were collected by trituration followed by washing twice in KRBH buffer. After a 1-h preequilibration in KRBH buffer, muscles were incubated for 10 min in the absence or presence of insulin (2,000 μU/ml). Thereafter, muscles were incubated for 15 min in the presence of 2-deoxy-[14C]glucose (2 μCi/ml) and [3H]mannitol (0.3 μCi/ml) and then quickly blotted on filter paper and frozen in liquid nitrogen. Muscles were digested for 1 h at 50°C in KOH (1 N) and then counted for radioactive tracer incorporation (14).
Dissection and immunostaining of skeletal muscle.
For in vivo insulin stimulation, insulin was injected intraperitoneally (0.75 IU/kg) in four transgenic and control mice. After 10 min, the mice were euthanized, and two skeletal muscles per mouse were dissected out and incubated with 4% paraformaldehyde for 1 h at 4°C. After incubation, the samples were washed three times with 1% PBS containing 1% BSA and 3% normal goat serum (Vector Laboratories) and mounted on coverslips with Vectashield mounting medium (Vector Laboratories). For ex vivo stimulation, we used either soleus or flexor digitorum brevis (FDB) muscles from HA-GLUT4-GFP transgenic and control mice. Six mice for each condition were euthanized, and FDB muscles where dissected out and incubated with oxygenated KRBH buffer. After dissection, muscles were constantly oxygenated with 95% O2-5% CO2 and incubated at 37°C for 1 h in a water bath with slow shaking. After incubation, muscles were washed three times with oxygenated KRBH, and muscles were either treated with insulin or kept basal for 15–30 min. After stimulation, basal (nonstimulated) and stimulated muscles were fixed for 1 h at 4°C with 4% paraformaldehyde in PBS, washed three times with PBS containing 1% BSA and 3% goat serum (Vector Laboratories), and incubated for 30 min with anti-HA (Covance) or anti-GLUT4 antibodies and for 30 min with fluorescently labeled second antibodies Alexa 488/594 (Invitrogen).
TIRF and confocal microscopy.
For live-cell imaging, isolated muscle fibers (FDB) or pieces of soleus muscle tissue were placed into a temperature- and gas-controlled chamber (Delta-T, Bioptechs), perfused with KRBH buffer containing 5% BSA 2% Ficoll, pH 7.4, and gassed with 95% O2-5% CO2. For immunofluorescence microscopy, the muscle cells were fixed with 4% formaldehyde in PBS for 15 min, washed twice with PBS, and transferred to KRBH with 1% BSA and 3% goat serum (Vector Laboratories) for incubation with antibodies. Cells were imaged using either a confocal LSM 510 microscope (Zeiss) or a custom-built TIRFM setup (33). In brief, an Axiovert 200 microscope (Zeiss) with a 100 × 1.45 NA lens, TIRF slider (Till Photonics), and AOTF laser combiner system (LSM Technologies) was used for evanescent wave excitation with 405/488/561 nm lasers (Coherent). The penetration depth of the evanescent field was measured to be 110 ± 20 nm by a calibration procedure with 40-nm fluorescent beads attached to a piezo-driven micropipette (23). Fluorescence images were collected through a multiband dichroic and emission filter set LF405/488/561/635-A (Semrock) and digitized with an Ixon EMCCD camera (Andor). For T-tubule observations, the laser incident angle was set slightly below the total inner reflection angle to illuminate 1–10 μm deep into the fiber. All hardware was synchronized and controlled using μManager 1.2.38 (http://www.micro-manager.org).
Image analysis.
All image analysis was carried out in ImageJ 1.41 (NIH). A set of semiautomated image processing macros was used to measure fluorescence intensity at the sarcolemma and T-tubules (22), to detect vesicular structures, to measure their density (number per unit area), and to calculate the frequency of fusion events as described previously (33). Statistical information was combined from several representative regions of interest (ROI) 10 × 10 μm for each fiber. The following criteria were used to detect individual structures: 1) fluorescence had a local maximum; 2) integrated pixel intensity was at least threefold above the standard deviation of pixel intensity; and 3) 70% of the peak intensity was contained within a circular ROI of five pixels. Density was measured as the number of structures per square micrometer; frequency of fusion was calculated as the number of events per square micrometer per minute.
Particle tracking was carried out using a custom-modified Particle Tracker algorithm (31). To quantify populations of stationary and mobile structures, we utilized a time projection method (22). Multicolor TIRF and confocal images were analyzed to measure colocalization between red and green channels at the sarcolemma, T-tubules, and individual vesicles. All data are represented as means ± SE. Statistical significance was analyzed using Student's t-test or ANOVA.
RESULTS
Protein expression of HA-GLUT4-GFP in transgenic mouse muscles.
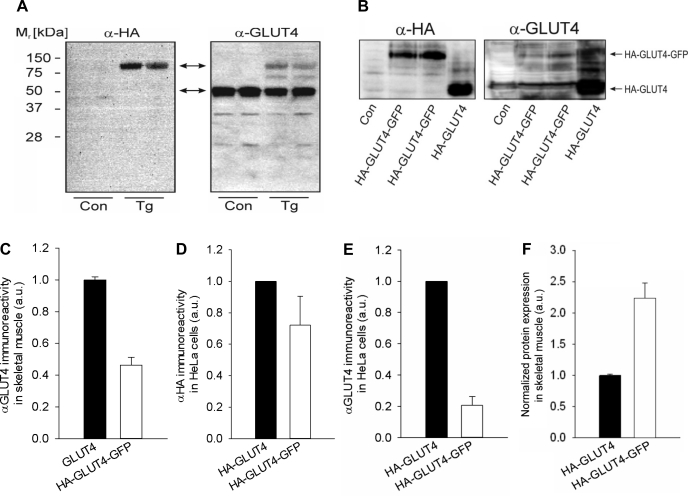
The muscle-specific protein expression of HA-GLUT4-GFP was verified by Western blot analysis of four different types of skeletal muscle (soleus, EDL, FDB, and gastrocnemius) derived from the transgenic mice. The HA-GLUT4-GFP construct contains an intracellular GFP tag fused to the COOH terminus of GLUT4 and also an HA epitope in the first extracellular loop that is exposed on the cell surface when GLUT4 is inserted into the plasma membrane. Protein detection by Western blotting using a specific monoclonal anti-HA antibody (α-HA) shows an immunoreactive band at ∼100 kDa that corresponds to the predicted molecular mass of HA-GLUT4-GFP (Fig. 1A, top arrow). To verify that the band detected by the HA antibody was GLUT4, an antibody against the COOH terminus of GLUT4 (α-GLUT4) was used; the same HA-GLUT4-GFP band was detected at ∼100 kDa with the GLUT4 antibody, as was endogenous GLUT4 at ∼50 kDa (Fig. 1A, bottom arrow). Notably, the α-GLUT4 immunoreactivity of the 100-kDa band was relatively low compared with that of the endogenous GLUT4 (HA-GLUT4-GFP/GLUT4 = 0.46; Fig. 1C), indicating low levels of expression of the transgene and/or reduced affinity of the antibody against the HA-GLUT4-GFP fusion protein.
Fig. 1.
GLUT4 expression and glucose utilization in hemagglutinin (HA)-GLUT4-GFP transgenic mice. A: Western blot analysis of endogenous GLUT4 and HA-GLUT4-GFP, using anti-GLUT4 and anti-HA antibodies. Gastrocnemius skeletal muscle membranes were isolated from wild-type (WT) C57BL/6J (Con) and HA-GLUT4-GFP transgenic (Tg) mice. HA-GLUT4-GFP was detected as ∼100-kDa band (top arrow), and endogenous GLUT4 was detected as ∼50-kDa band (bottom arrow). B: Western blot analysis of immunoreactivity of GLUT4 antibody against GFP-tagged GLUT4. HeLa cells were transfected with HA-GLUT4, HA-GLUT4-GFP, and empty vector (Con), and proteins were detected using α-HA and α-GLUT4 antibodies. In Western blots, HA-GLUT4-GFP and HA-GLUT4 showed comparable α-HA immunoreactivity, whereas α-GLUT4 immunoreactivity was substantially reduced for GFP fusion protein. C: quantified intensity of endogenous GLUT4 and HA-GLUT4-GFP bands detected with anti-GLUT4 antibody in skeletal muscle of Tg mice. Average intensity of the HA-GLUT4-GFP band was 0.46 ± 0.08 of endogenous GLUT4. Data are means ± SE; n = 5. D: quantified immunoreactivity of HA antibody against HA-GLUT4 and HA-GLUT4-GFP. HA antibody showed comparable immunoreactivity for both HA-GLUT4-GFP and HA-GLUT4 and therefore was used as a control for the amount of protein expressed. Data are means ± SE; n = 3. E: quantified immunoreactivity of GLUT4 antibody against HA-GLUT4 and HA-GLUT4-GFP. On average, the quantified intensity of the HA-GLUT4-GFP band was 0.21 ± 0.07 of HA-GLUT4. Data are means ± SE; n = 3. F: comparative expression level of HA-GLUT4-GFP and endogenous GLUT4 in gastrocnemius skeletal muscles isolated from Tg mice. Quantitative comparison was performed using intensities of α-GLUT4 bands in Western blots (A) normalized according to reduced immunoreactivity of α-GLUT4 toward HA-GLUT4-GFP, as measured in B. We estimate that, on average, Tg mice overexpress HA-GLUT4-GFP by ∼2.2-fold vs. endogenous GLUT4. Data are means ± SE; n = 5.
To quantitate the expression level of the HA-GLUT4-GFP, we analyzed protein lysates from transiently transfected HeLa cells expressing HA-GLUT4 and HA-GLUT4-GFP by Western blotting (Fig. 1B). Both HA-GLUT4 and HA-GLUT4-GFP exhibited comparable immunoreactivities when α-HA antibodies were used (Fig. 1D). However, whereas HA-GLUT4 was readily detectable with α-GLUT4 antibodies, the corresponding band intensity of the HA-GLUT4-GFP was greatly reduced (HA-GLUT4-GFP/HA-GLUT4 = 0.21; Fig. 1E). Thus, taking into account the reduced α-GLUT4 immunoreactivity of HA-GLUT4-GFP, we estimate that the transgenic mice overexpress HA-GLUT4-GFP by ∼2.2-fold compared with the endogenous GLUT4 (Fig. 1F).
HA-GLUT4-GFP mice show normal insulin sensitivity.
To investigate the physiological properties of the HA-GLUT4-GFP transgenic mice, we compared transgenic and control mice for a number of parameters including body composition; relative fat and lean mass; serum levels of glucose, insulin, FFA, and triglycerides; glucose tolerance; and glucose utilization. All measurements were performed in transgenic and control mice of the same age kept under identical diets and other conditions. Six mice were analyzed per each condition. Transgenic and control animals had similar body weights (less than 10% difference), with HA-GLUT4-GFP mice having somewhat increased fat mass, 14 ± 1 vs. 10 ± 1% (mean ± SE, n = 11, P < 0.003). Further serum analyses of nonfasting animals showed that transgenic mice had blood glucose and serum insulin, FFA, and TG within the normal range (data not shown).
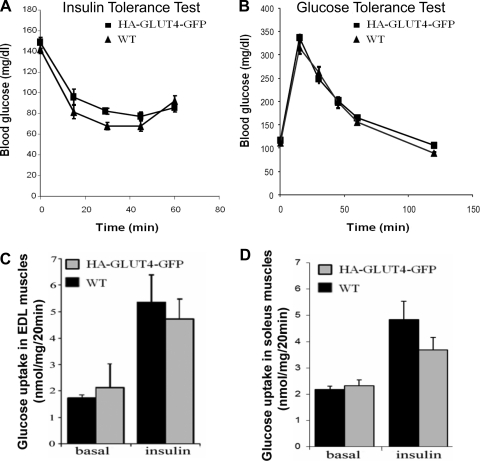
To assess insulin sensitivity in the transgenic mice, we performed both an insulin tolerance test (ITT) using nonfasted mice and a glucose tolerance test (GTT) on mice fasted overnight. No significant differences were observed in either ITT or GTT between the transgenic and control mice (Fig. 2, A and B). Likewise, we found no genotype-dependent differences in basal and insulin-stimulated 2-deoxyglucose (2-DOG) uptake of intact isolated EDL and soleus muscles (Fig. 2, C and D), clearly indicating that the HA-GLUT4-GFP reporter molecule was catalytically inactive. Taken together, these data suggest that the transgenic mice have normal glucose homeostasis and insulin sensitivity and represent a good model for studying the role of GLUT4 in the muscle glucose transport response to insulin.
Fig. 2.
Glucose tolerance and utilization in HA-GLUT4-GFP transgenic mice. A: insulin tolerance test performed in nonfasted mice with injection of insulin (0.75 IU/kg ip). Data are means ± SE; n = 5. B: glucose tolerance test performed using mice fasted overnight. Glucose was injected (2 g/kg ip). Data are means ± SE; n = 6. C: insulin-dependent glucose uptake in isolated extensor digitorum longus (EDL) muscles from WT C57BL/6J and Tg mice (HA-GLUT4-GFP). Basal and insulin-stimulated glucose uptake was measured using 2-deoxy-[14C]glucose. Data are means ± SE; n = 3. D: insulin-dependent glucose uptake in soleus muscles. Soleus muscles were isolated from WT C57BL/6J and Tg mice (HA-GLUT4-GFP). Basal and insulin-stimulated glucose uptake was measured using 2-deoxy-[14C]glucose. Data are means ± SE; n = 3.
HA-GLUT4-GFP mimics endogenous GLUT4 distribution and translocation.
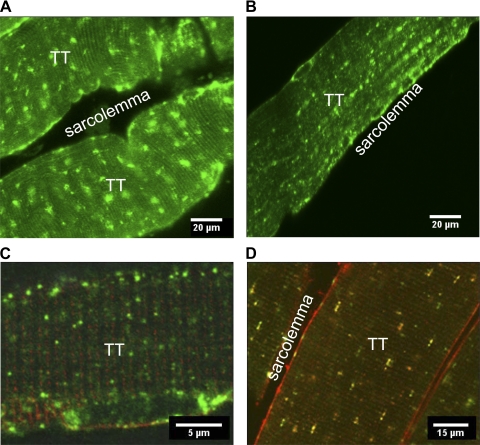
The essence of insulin-regulated GLUT4 translocation is the GLUT4 trafficking to the plasma membrane after stimulation. To verify that HA-GLUT4-GFP has a correct cellular localization and undergoes insulin-stimulated translocation, we analyzed fibers isolated from the transgenic mice by using confocal immunofluorescence microscopy. A clear GFP signal was detected in different types of skeletal muscles, including gastrocnemius, FDB, and soleus. Figure 3 shows representative confocal images of isolated basal soleus muscles (Fig. 3A) and FDB fibers (Fig. 3B). In the basal state, HA-GLUT4-GFP appeared in distinct puncta localized near the sarcolemma and T-tubules (Fig. 3C). Also, larger patches of HA-GLUT4-GFP were visible throughout the muscle fibers (Fig. 3, A, B, and D). We further showed that HA-GLUT4-GFP exhibited a correct cellular localization with endogenous GLUT4 by imaging fixed, permeabilized muscles stained with anti-GLUT4 antibody. Structures exhibiting GFP signals colocalized with structures labeled with GLUT4 antibody in both basal and insulin-stimulated muscles (Fig. 3D).
Fig. 3.
Subcellular localization of HA-GLU4-GFP in skeletal muscles isolated from Tg mice. Confocal images of GLUT4-GFP in isolated soleus (A) and flexor digitorum brevis (FDB; B) muscle fibers. C: localization of GLUT4-GFP vesicles in the vicinity of the sarcolemma and T-tubules (TT) in FDB muscle fibers stained with FM4-64 membrane dye. D: immunofluorescence microscopy of isolated permeabilized FDB muscle fibers. Cells were fixed, permeabilized, and stained with mouse anti-HA antibody and secondary goat-anti-mouse conjugated with Alexa 594 (red). Endogenous GLUT4 was detected with rabbit anti-GLUT4 antibody and secondary goat anti-rabbit conjugated with Alexa 633 (pseudocolored green). Panels show representative images from ≥3 independent experiments.
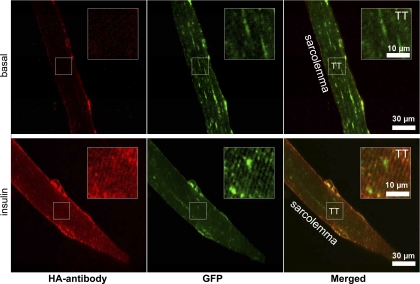
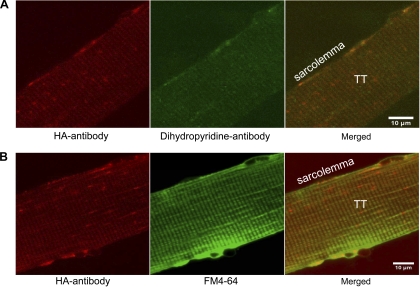
Consistent with previous reports (12, 18, 24), GLUT4 translocation induced by insulin resulted in an increased GLUT4-GFP labeling of the sarcolemma and the T-tubules (Fig. 4). To further verify the translocation of HA-GLUT4-GFP to the cell surface, we imaged fixed, nonpermeabilized FDB fibers stained with HA-antibody conjugated to Alexa 594 to detect exposure of the extracellular HA tag in the sarcolemma and T-tubules. In basal muscle fibers, we detected only a rather weak HA antibody staining (Fig. 4, top), suggesting that only a small amount of HA-GLUT4-GFP was exposed at the cell surface in the absence of insulin. In insulin-stimulated fibers, we observed a much stronger HA antibody signal at the sarcolemma and T-tubules that was well colocalized with the GFP signal (Fig. 4, bottom). Localization of HA antibody at the T-tubules was also verified by colocalization with dihyropyridine receptor (Fig. 5A) and lipid marker FM4-64 (Fig. 5B).
Fig. 4.
Translocation of HA-GLU4-GFP to sarcolemma and immunofluorescence detection of surface exposed HA-tag. Confocal images showing GLUT4-GFP (green) and anti-HA (red) signals in isolated nonpermeabilized FDB muscle fibers. Cells were either kept basal, nonstimulated (top), or stimulated with insulin (bottom), stained with anti-HA antibody for 15 min, then fixed and labeled with Alexa 594-conjugated secondary antibodies. Insets: magnified regions depicting HA labeling of T-tubules. Images shown are representative cells from 5 independent experiments.
Fig. 5.
Immunofluorescence detection of surface-exposed HA tag and colocalization with T-tubules. A: isolated nonpermeabilized FDB fibers from HA-GLUT4-GFP Tg mice were stained with anti-HA (red) and dihyropyridine receptor (green) antibodies. Cells were stimulated with insulin for 30 min and stained with mouse anti-HA and rabbit anti-dihyropyridine antibodies for 15 min at RT. After fixation, primary antibodies were detected with goat anti-mouse-Alexa 594 and goat anti-rabbit-Alexa 488 secondary antibodies. Note high level of colocalization at T-tubules. Bar, 10 μm. Images shown are representative cells from 2 experiments. B: colocalization of HA antibody (red) and lipid marker FM4-64 (pdseudocolored green) at T-tubules of isolated nonpermeabilized FDB fibers. Cells were stimulated with insulin for 30 min and stained with anti-HA antibody for 15 min, then fixed and labeled with Alexa 594-conjugated secondary antibody. Images shown are representative cells from 3 experiments.
On the basis of these data, we conclude that HA-GLUT4-GFP show a correct localization and follow the same translocation pathway as endogenous GLUT4, allowing us to use the exposed epitope of HA as a marker of GLUT4 insertion into the surface membrane.
GLUT4 dynamics in the vicinity of the sarcolemma.
The benefit of having HA-GLUT4-GFP transgenic mice is the ability to monitor the dynamics of GLUT4 trafficking and translocation in live muscle fibers. The few previous studies of GLUT4 in live muscle fibers relied on transient transfection and were limited to confocal imaging (16, 18, 19). Here, we introduce the concept of TIRF imaging of HA-GLUT4-GFP in live muscle fibers to characterize the trafficking of GLUT4 near the sarcolemma.
We used intact isolated FDB muscle fibers for high-resolution imaging and applied both confocal and TIRF microscopy to monitor the GLUT4 dynamics. In basal FDB fibers, we found a punctate distribution of HA-GLUT4-GFP similar to the distribution observed with confocal microscopy of fixed muscles. However, due to the improved signal-to-noise ratio and efficiency of light collection, TIRF microscopy provided better resolution of individual GLUT4 structures in the TIRF-zone (Fig. 6A). This allowed us to quantify the density of GLUT4 vesicles near the sarcolemma. We found that, using TIRF, we detected about threefold more GLUT4 vesicles near the sarcolemma than could be observed with confocal microscopy or were previously published (16). We counted individual diffraction-limited puncta per 10 × 10 μm2 regions for basal and insulin-stimulated fibers and found that the number of GLUT4 puncta was slightly decreased after 30 min of insulin stimulation (basal 56 ± 3, insulin 43 ± 3, n = 15 cells, P = 0.0038). This is consistent with the notion that a decrease in the number of vesicles is associated with their disappearance due to insulin-stimulated exocytosis.
Fig. 6.
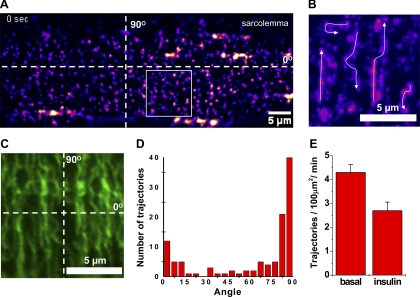
Localization and trafficking of HA-GLUT4-GFP vesicles in the vicinity of the sarcolemma of isolated muscle fibers. A: total internal reflection fluorescent (TIRF) microscopy was used to visualize trafficking of HA-GLUT4-GFP vesicles near the sarcolemma of isolated FDB fibers. Image shown is a representative region of sarcolemma of a live FDB fiber isolated from a HA-GLUT4-GFP Tg mouse. Fluorescence intensity is shown in pseudocolor. Dotted lines correspond to 0 and 90° axes parallel and perpendicular to the fiber axis and represent the main directions of vesicular movements (see Supplemental Movie 1). B: time-lapse projection image of region outlined in A showing trajectories of mobile GLUT4 vesicles detected during 60 s of recording. Fluorescence intensity is shown in pseudocolor. Arrows show direction of movement. Bar, 5 μm. C: microtubular network visualized with immunofluorescence confocal microscopy in isolated FDB fibers. Isolated muscle fibers were stained with mouse anti-tubulin antibodies and goat anti-mouse-Alexa 594 secondary antibodies. Image shown is a representative sarcolemma region of FDB fibers observed in 3 independent experiments. Bar, 5 μm. D: angular distribution of GLUT4 vesicle traffic; 114 trajectories from 15 cells were analyzed and their angles measured relative to the fiber axis shown in A. Note preferential direction of traffic along T-tubules that corresponds to the 90° peak. E: comparison of GLUT4 vesicle traffic measured in basal and insulin-stimulated states. Data represent mean number of trajectories detected per 100 μm2 region per minute. Trajectories were measured in 2–3 regions per cell, with ≥15 cells analyzed in each state.
However, time-lapse recordings revealed that the predominant fraction of GLUT4 structures remained relatively stationary at least for several minutes (typical time of recordings, 2–4 min) and that only ∼10% of the vesicles exhibited directed movements exceeding 1 μm displacement. The speed varied significantly during intermittent movements of the mobile vesicles and ranged from 0.1 to 2 μm/s with no apparent dependence on the direction of movement. Intermittent stops were evident, especially when GLUT4 vesicles were changing direction for 90 or 180°. Interestingly, GLUT4 vesicles preferentially moved either parallel (0°) or perpendicular (90°) to the fiber axis (Fig. 6, A and B, and Suppl. Movie 1), with only a few short (∼2 μm) trajectories going at significantly different angles. The characteristic length (5–10 μm) and angular distribution of trajectories obtained with TIRF microscopy were consistent with microtubule organization detected with anti-tubulin antibody in isolated FDB fibers (Fig. 6, C and D). Speed of movement of individual GLUT4 vesicles is also consistent with typical kinesin-based motion reported for GLUT4 in rat adipose cells and 3T3-L1 adipocytes.
To quantify traffic intensity, we measured the number of trajectories generated by mobile vesicles per 100 μm2 per minute of recording (Fig. 6E). Typically, only trajectories exceeding one micrometer were effectively detected. We found that insulin stimulation resulted in a rather modest decrease in traffic intensity (basal 4.3 ± 0.3, insulin 2.7 ± 0.4, n = 15 cells, P = 0.0028). Because the total number of GLUT4 puncta also decreased moderately with insulin, the decrease in traffic intensity expressed as a percent of total puncta did not significantly decrease (8 ± 1% and 7 ± 1.2%,, correspondingly, n = 15 cells, P = 0.53). Furthermore, no apparent change in either the direction or speed of movement was observed.
Insulin stimulates fusion of GLUT4 vesicles at the sarcolemma.
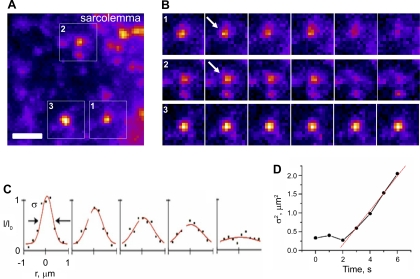
We further investigated the process of fusion of individual HA-GLUT4-GFP vesicles induced by insulin stimulation. To detect exocytosis in the sarcolemma regions, we applied TIRF microscopy. Fusion of GLUT4 vesicles was detected as the disappearance of diffraction-limited puncta and lateral redistribution of GLUT4-GFP fluorescence from the site of fusion (Fig. 7, A and B). The rate of GLUT4-GFP redistribution from the site of fusion was assessed by analyzing the width of the intensity profile corresponding to a punctum during the frames when it disappeared (Fig. 7C). The widening of the profile (Fig. 7C) is determined by the diffusion of GLUT4 molecules; the slope of the curve in Fig. 7D is proportional to the diffusion coefficient, which was estimated to be ∼ 0.11 μm2/s. The widening of the intensity profile also served as a control that the vesicle did not bleach or move away from the sarcolemma but indeed underwent exocytosis.
Fig. 7.
Insulin-induced fusion of HA-GLUT4-GFP vesicles at the sarcolemma of isolated FDB fibers. A: image from time-lapse TIRF movie (see Supplemental Movie 2) showing insulin-induced HA-GLUT4-GFP translocation at the sarcolemma regions in a live isolated FDB fiber. Fluorescence intensity is shown in pseudocolor. Bar, 2 μm. B: sequential time frames from regions outlined in A depicting HA-GLUT4-GFP redistribution upon fusion of vesicles (1, 2). Arrows indicate onset of fusion. Vesicle (3) did not undergo fusion and is shown as a control. All frames shown are 1 s apart. C: axial intensity profiles corresponding to HA-GLUT4-GFP fluorescence redistribution during fusion events. Red line represents Gaussian fit of vesicle fluorescence radial intensity profile. Note characteristic decrease of peak intensity and simultaneous radial widening of the profile (σ = full-width half-maximum). Width of profile corresponds to diffraction-limited image of the vesicle (∼0.5 μm) and significantly exceeds the physical size of the vesicle (∼40 nm). Profiles are shown for 5 sequential frames from onset of fusion. D: increase of σ of axial intensity profile during fusion of individual vesicles. Red line represents linear fit used to determine diffusion coefficient for HA-GLUT4-GFP (D = 1/4 dσ2/dt ∼ 0.11 μm2/s). Note: widening of the profile can be observed only after fluorophores diffuse ≥0.5 μm away from site of fusion.
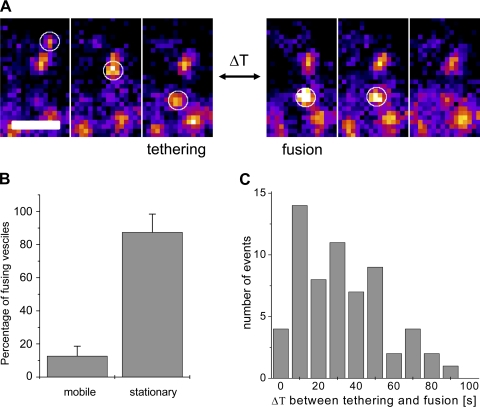
In the basal state, fusion events were very rare (<0.001 μm2/min), but after insulin stimulation, the frequency of the fusion events significantly increased and averaged 0.012 ± 0.001 μm2/min. To determine whether insulin stimulated primarily the fusion of stationary vesicles or recruitment of mobile vesicles, we analyzed the history of the vesicles that underwent exocytosis and determined whether the vesicles exhibited tethering shortly prior to fusion (Fig. 8A). Interestingly, more than 80% of the vesicles were found to be stationary for the whole time of the recording (2–4 min) prior to fusion (Fig. 8B). For the rest of the vesicles that arrived at the fusion site within the observation time, we analyzed the time between their arrival and disappearance via fusion. For these mobile vesicles, the time they spent tethered before fusion was typically between 10 and 50 s (Fig. 8C). Taken together, this further indicates that in skeletal muscles the majority of GLUT4 that undergoes complete exocytosis in response to insulin is recruited from pretethered depots rather than by recruitment of mobile vesicles from intracellular compartments.
Fig. 8.
Insulin-induced fusion of stationary and mobile GLUT4 vesicles. A: example of tethering event followed by fusion. Three sequential time frames on the left show arrival and tethering of vesicle; 3 sequential time frames on the right show fusion of the vesicle. ΔT represents time delay between tethering and onset of fusion and, in the example shown, represents 28 skipped frames (ΔT = 28 s). All sequential frames are 1 s apart. Fluorescence intensity is shown in pseudocolor. Bar, 2 μm. B: relative number of stationary and mobile vesicles that undergo insulin-stimulated fusion. A total of 491 fusion events were analyzed, and the majority of vesicles were found to be stationary (for >2 min) prior to fusion. Data are means ± SE; n = 15 cells. C: histogram of time delay (ΔT) between tethering and fusion observed for 62 vesicles that were mobile before fusion (as shown in A).
DISCUSSION
In this study, we have introduced a transgenic mouse expressing human GLUT4 engineered to encode both the HA tag in the extracellular domain and a fluorescent protein (GFP) at the COOH terminus on the cytoplasmic surface of muscle cells. Using this GLUT4 model, we were able to use the GFP tag to monitor GLUT4 trafficking in live muscle fibers as well as the HA tag to detect the insertion and exposure of GLUT4 at the cell surface. Using confocal and TIRF microscopy, we have dissected the effect of insulin on GLUT4 trafficking and fusion. In contrast to adipose cells, insulin has little effect of on the recruitment of GLUT4 vesicles from the interior of the skeletal muscle cell; rather, insulin-stimulated GLUT4 translocation was mostly driven by fusion of pretethered GLUT4 vesicles, at both the sarcolemma and T-tubules. All together, these data suggest that in skeletal muscles insulin affects GLUT4 vesicle fusion and has little or no effect on the tethering of GLUT4 vesicles. These data highlight the differences in insulin regulation of GLUT4 exocytosis in adipose cells and skeletal muscles.
A number of studies have been reported where the GLUT4 gene was manipulated specifically within muscle tissue, and it was shown that GLUT4 expression was critical for whole body glucose homeostasis (3, 6, 37). In insulin-resistant states such as obesity and type 2 diabetes, GLUT4 expression was shown to be decreased in adipose cells but not in muscles (1). This suggests that insulin resistance in muscle is due to defects in GLUT4 translocation rather than downregulation of GLUT4 expression. Several groups have developed different transgenic mice and cell lines as muscle models where the mechanisms of GLUT4 translocation can be studied. Transient expression of GLUT4-GFP has been used to visualize GLUT4 trafficking in vivo but could not differentiate GLUT4 inserted in the plasma membrane from intracellular compartments closely apposed to the plasma membrane (17, 18). A myc-tagged GLUT4 transgenic mouse was recently introduced to study GLUT4 translocation in muscles. It has the advantage of permitting quantitative measurement of the amount of GLUT4 translocation and was used to validate the additive effect of insulin and contraction on GLUT4 redistribution (32). However, myc-GLUT4 could not be used for live-cell imaging of GLUT4 traffic, since it is lacking a fluorescent tag. To combine the benefits of both tags, we have generated an HA-GLUT4-GFP transgenic mouse that can be used for both live-cell imaging and immunofluorescent GLUT4 translocation assays.
We found the ectopic HA-GLUT4-GFP to colocalize with endogenous GLUT4, distributed in a nonhomogenous, patchy fashion throughout the fiber, that is consistent with the presence of large stationary GLUT4 compartments (16, 19) and small GLUT4 vesicles (16, 28).
The fact that GLUT4 distribution in transiently transfected muscles as well as the muscles from our transgenic mice show similar distributions suggests that the observed large GLUT4 structures are not artifacts of acute overexpression. Indeed, the estimated level of GLUT4 overexpression in our mice was within two- to threefold. Moreover, HA-GLUT4-GFP showed proper translocation in response to both insulin and contraction, and this engineered protein was inserted into both the sarcolemma and T-tubules, similar to endogenous GLUT4. The fact that the insulin-induced translocation of GLUT4 did not induce accumulation of HA-GLUT4-GFP in the vicinity of the sarcolemma suggests that local depots of GLUT4 are responsible for the acute insulin response. This is also consistent with previous reports of a “local depletion” of GLUT4 upon insulin stimulation (16) and contraction (17).
In contrast to transgenic mice, muscle cell lines have been very useful for elucidating the molecular details of insulin signaling and its interaction with GLUT4 translocation machinery. In L6 myoblasts, GLUT4 translocation is shown to depend on Akt2 and AS160 phosphorylation (29), similar to adipose cells (25, 36). Skeletal muscle also contains TBC1D1, which is related to AS160 and plays a similar role in insulin-stimulated glucose uptake (7). Intriguingly, the AS160/TBC1D1-targeted Rabs differ between adipose cells and muscles, with Rab8a and Rab13 being activated in muscle (34) and Rab10 in adipose cells (8, 30). These finding are in line with the different effects of insulin on GLUT4 trafficking and fusion observed in primary adipose cells and muscles. Whereas in adipose cells the main effect of insulin is to stimulate tethering/docking of GLUT4 vesicles to the plasma membrane (23), in muscles cells the majority of insulin-stimulated GLUT4 exocytosis occurs from pretethered/docked vesicles, with little effect on the mobile GLUT4 pool. This suggests that the major site of action of insulin in muscles is activation of the GLUT4 vesicle fusion machinery at the sarcolemma and T-tubular region rather than the release of GLUT4 from the intracellular retention cycle, as proposed in 3T3-L1 adipocytes (11). The low GLUT4 traffic intensity that we observed in isolated FDB and soleus muscles, together with the Lauritzen data (16), suggests that an overall redistribution of GLUT4 in response to insulin in skeletal muscle does not require significant relocation of GLUT4 vesicles from distant intracellular pools. Also, the rather long delay between recruitment of new GLUT4 vesicles and their fusion is in contrast to GLUT4 translocation in adipose cells where the time of tethering preceding fusion is relatively short for a major part of the GLUT4 fusion events (2). Together with the high abundance of relatively stationary GLUT4 structures near the sarcolemma, these data suggest that the bulk of the insulin response may be achieved by local exocytosis of pretethered GLUT4 vesicles.
In conclusion, we would like to highlight the importance of elucidating the insulin signaling pathways downstream of AS160 that lead to activation of different cohorts of Rab proteins regulating tethering/docking and fusion of GLUT4 vesicles in adipose and muscle cells. We propose that HA-GLUT4-GFP will be a useful model to study specific defects in GLUT4 translocation in muscle associated with metabolic disorders such as insulin resistance and type 2 diabetes.
DISCLOSURES
No conflicts of interest, financial or otherwise, are declared by the author(s).
AUTHOR CONTRIBUTIONS
Author contributions: V.L., H.A.-H., and S.W.C. conception and design of research; V.L., K.S., I.L., O.G., D.R.Y., and A.C. performed experiments; V.L., K.S., I.L., O.G., and A.C. analyzed data; V.L., K.S., I.L., O.G., H.A.-H., J.Z., and S.W.C. interpreted results of experiments; V.L. and I.L. prepared figures; V.L., K.S., I.L., J.Z., and S.W.C. drafted manuscript; V.L., K.S., H.A.-H., J.Z., and S.W.C. edited and revised manuscript; V.L., K.S., I.L., O.G., D.R.Y., A.C., H.A.-H., J.Z., and S.W.C. approved final version of manuscript.
Supplementary Material
ACKNOWLEDGMENTS
This work was supported in part by a Postdoctoral Fellowship to K. Stenkula from the Swedish Research Council and by the intramural research programs of National Institute of Diabetes and Digestive and Kidney Diseases and National Institute of Child Health and Human Development, National Institutes of Health.
REFERENCES
- 1. Abel ED, Peroni O, Kim JK, Kim YB, Boss O, Hadro E, Minnemann T, Shulman GI, Kahn BB. Adipose-selective targeting of the GLUT4 gene impairs insulin action in muscle and liver. Nature 409: 729–733, 2001 [DOI] [PubMed] [Google Scholar]
- 2. Bai L, Wang Y, Fan J, Chen Y, Ji W, Qu A, Xu P, James DE, Xu T. Dissecting multiple steps of GLUT4 trafficking and identifying the sites of insulin action. Cell Metab 5: 47–57, 2007 [DOI] [PubMed] [Google Scholar]
- 3. Brozinick JT, Jr, Yaspelkis BB, 3rd, Wilson CM, Grant KE, Gibbs EM, Cushman SW, Ivy JL. Glucose transport and GLUT4 protein distribution in skeletal muscle of GLUT4 transgenic mice. Biochem J 313: 133–140, 1996 [DOI] [PMC free article] [PubMed] [Google Scholar]
- 4. Bruning JC, Michael MD, Winnay JN, Hayashi T, Horsch D, Accili D, Goodyear LJ, Kahn CR. A muscle-specific insulin receptor knockout exhibits features of the metabolic syndrome of NIDDM without altering glucose tolerance. Mol Cell 2: 559–569, 1998 [DOI] [PubMed] [Google Scholar]
- 5. Bryant NJ, Govers R, James DE. Regulated transport of the glucose transporter GLUT4. Nat Rev Mol Cell Biol 3: 267–277, 2002 [DOI] [PubMed] [Google Scholar]
- 6. Carvalho E, Schellhorn SE, Zabolotny JM, Martin S, Tozzo E, Peroni OD, Houseknecht KL, Mundt A, James DE, Kahn BB. GLUT4 overexpression or deficiency in adipocytes of transgenic mice alters the composition of GLUT4 vesicles and the subcellular localization of GLUT4 and insulin-responsive aminopeptidase. J Biol Chem 279: 21598–21605, 2004 [DOI] [PubMed] [Google Scholar]
- 7. Chadt A, Leicht K, Deshmukh A, Jiang LQ, Scherneck S, Bernhardt U, Dreja T, Vogel H, Schmolz K, Kluge R, Zierath JR, Hultschig C, Hoeben RC, Schurmann A, Joost HG, Al-Hasani H. Tbc1d1 mutation in lean mouse strain confers leanness and protects from diet-induced obesity. Nat Genet 40: 1354–1359, 2008 [DOI] [PubMed] [Google Scholar]
- 8. Chen Y, Deng Y, Zhang J, Yang L, Xie X, Xu T. GDI-1 preferably interacts with Rab10 in insulin-stimulated GLUT4 translocation. Biochem J 422: 229–235, 2009 [DOI] [PMC free article] [PubMed] [Google Scholar]
- 9. Dawson K, Aviles-Hernandez A, Cushman SW, Malide D. Insulin-regulated trafficking of dual-labeled glucose transporter 4 in primary rat adipose cells. Biochem Biophys Res Commun 287: 445–454, 2001 [DOI] [PubMed] [Google Scholar]
- 10. DeFronzo RA, Jacot E, Jequier E, Maeder E, Wahren J, Felber JP. The effect of insulin on the disposal of intravenous glucose. Results from indirect calorimetry and hepatic and femoral venous catheterization. Diabetes 30: 1000–1007, 1981 [DOI] [PubMed] [Google Scholar]
- 11. Eguez L, Lee A, Chavez JA, Miinea CP, Kane S, Lienhard GE, McGraw TE. Full intracellular retention of GLUT4 requires AS160 Rab GTPase activating protein. Cell Metab 2: 263–272, 2005 [DOI] [PubMed] [Google Scholar]
- 12. Fazakerley DJ, Lawrence SP, Lizunov VA, Cushman SW, Holman GD. A common trafficking route for GLUT4 in cardiomyocytes in response to insulin, contraction and energy-status signalling. J Cell Sci 122: 727–734, 2009 [DOI] [PMC free article] [PubMed] [Google Scholar]
- 13. Goodyear LJ, King PA, Hirshman MF, Thompson CM, Horton ED, Horton ES. Contractile activity increases plasma membrane glucose transporters in absence of insulin. Am J Physiol Endocrinol Metab 258: E667–E672, 1990 [DOI] [PubMed] [Google Scholar]
- 14. Heron-Milhavet L, Haluzik M, Yakar S, Gavrilova O, Pack S, Jou WC, Ibrahimi A, Kim H, Hunt D, Yau D, Asghar Z, Joseph J, Wheeler MB, Abumrad NA, LeRoith D. Muscle-specific overexpression of CD36 reverses the insulin resistance and diabetes of MKR mice. Endocrinology 145: 4667–4676, 2004 [DOI] [PubMed] [Google Scholar]
- 15. Holman GD, Lo Leggio L, Cushman SW. Insulin-stimulated GLUT4 glucose transporter recycling. A problem in membrane protein subcellular trafficking through multiple pools. J Biol Chem 269: 17516–17524, 1994 [PubMed] [Google Scholar]
- 16. Lauritzen HP, Galbo H, Brandauer J, Goodyear LJ, Ploug T. Large GLUT4 vesicles are stationary while locally and reversibly depleted during transient insulin stimulation of skeletal muscle of living mice: imaging analysis of GLUT4-enhanced green fluorescent protein vesicle dynamics. Diabetes 57: 315–324, 2008 [DOI] [PubMed] [Google Scholar]
- 17. Lauritzen HP, Galbo H, Toyoda T, Goodyear LJ. Kinetics of contraction-induced GLUT4 translocation in skeletal muscle fibers from living mice. Diabetes 59: 2134–2144, 2010 [DOI] [PMC free article] [PubMed] [Google Scholar]
- 18. Lauritzen HP, Ploug T, Prats C, Tavare JM, Galbo H. Imaging of insulin signaling in skeletal muscle of living mice shows major role of T-tubules. Diabetes 55: 1300–1306, 2006 [DOI] [PubMed] [Google Scholar]
- 19. Lauritzen HP, Reynet C, Schjerling P, Ralston E, Thomas S, Galbo H, Ploug T. Gene gun bombardment-mediated expression and translocation of EGFP-tagged GLUT4 in skeletal muscle fibres in vivo. Pflügers Arch 444: 710–721, 2002 [DOI] [PubMed] [Google Scholar]
- 20. Lauritzen HP, Schertzer JD. Measuring GLUT4 translocation in mature muscle fibers. Am J Physiol Endocrinol Metab 299: E169–E179, 2010 [DOI] [PubMed] [Google Scholar]
- 21. Li CH, Bai L, Li DD, Xia S, Xu T. Dynamic tracking and mobility analysis of single GLUT4 storage vesicle in live 3T3-L1 cells. Cell Res 14: 480–486, 2004 [DOI] [PubMed] [Google Scholar]
- 22. Lizunov VA, Lisinski I, Stenkula K, Zimmerberg J, Cushman SW. Insulin regulates fusion of GLUT4 vesicles independent of Exo70-mediated tethering. J Biol Chem 284: 7914–7919, 2009 [DOI] [PMC free article] [PubMed] [Google Scholar]
- 23. Lizunov VA, Matsumoto H, Zimmerberg J, Cushman SW, Frolov VA. Insulin stimulates the halting, tethering, and fusion of mobile GLUT4 vesicles in rat adipose cells. J Cell Biol 169: 481–489, 2005 [DOI] [PMC free article] [PubMed] [Google Scholar]
- 24. Marette A, Burdett E, Douen A, Vranic M, Klip A. Insulin induces the translocation of GLUT4 from a unique intracellular organelle to transverse tubules in rat skeletal muscle. Diabetes 41: 1562–1569, 1992 [DOI] [PubMed] [Google Scholar]
- 25. Miinea CP, Sano H, Kane S, Sano E, Fukuda M, Peranen J, Lane WS, Lienhard GE. AS160, the Akt substrate regulating GLUT4 translocation, has a functional Rab GTPase-activating protein domain. Biochem J 391: 87–93, 2005 [DOI] [PMC free article] [PubMed] [Google Scholar]
- 26. Mitsumoto Y, Burdett E, Grant A, Klip A. Differential expression of the GLUT1 and GLUT4 glucose transporters during differentiation of L6 muscle cells. Biochem Biophys Res Commun 175: 652–659, 1991 [DOI] [PubMed] [Google Scholar]
- 27. Niu W, Bilan PJ, Yu J, Gao J, Boguslavsky S, Schertzer JD, Chu G, Yao Z, Klip A. PKCepsilon regulates contraction-stimulated GLUT4 traffic in skeletal muscle cells. J Cell Physiol 226: 173–180, 2011 [DOI] [PubMed] [Google Scholar]
- 28. Ploug T, van Deurs B, Ai H, Cushman SW, Ralston E. Analysis of GLUT4 distribution in whole skeletal muscle fibers: identification of distinct storage compartments that are recruited by insulin and muscle contractions. J Cell Biol 142: 1429–1446, 1998 [DOI] [PMC free article] [PubMed] [Google Scholar]
- 29. Randhawa VK, Ishikura S, Talior-Volodarsky I, Cheng AW, Patel N, Hartwig JH, Klip A. GLUT4 vesicle recruitment and fusion are differentially regulated by Rac, AS160, and Rab8A in muscle cells. J Biol Chem 283: 27208–27219, 2008 [DOI] [PubMed] [Google Scholar]
- 30. Sano H, Eguez L, Teruel MN, Fukuda M, Chuang TD, Chavez JA, Lienhard GE, McGraw TE. Rab10, a target of the AS160 Rab GAP, is required for insulin-stimulated translocation of GLUT4 to the adipocyte plasma membrane. Cell Metab 5: 293–303, 2007 [DOI] [PubMed] [Google Scholar]
- 31. Sbalzarini IF, Koumoutsakos P. Feature point tracking and trajectory analysis for video imaging in cell biology. J Struct Biol 151: 182–195, 2005 [DOI] [PubMed] [Google Scholar]
- 32. Schertzer JD, Antonescu CN, Bilan PJ, Jain S, Huang X, Liu Z, Bonen A, Klip A. A transgenic mouse model to study glucose transporter 4myc regulation in skeletal muscle. Endocrinology 150: 1935–1940, 2009 [DOI] [PubMed] [Google Scholar]
- 33. Stenkula KG, Lizunov VA, Cushman SW, Zimmerberg J. Insulin controls the spatial distribution of GLUT4 on the cell surface through regulation of its postfusion dispersal. Cell Metab 12: 250–259, 2010 [DOI] [PMC free article] [PubMed] [Google Scholar]
- 34. Sun Y, Bilan PJ, Liu Z, Klip A. Rab8A and Rab13 are activated by insulin and regulate GLUT4 translocation in muscle cells. Proc Natl Acad Sci USA 107: 19909–19914, 2010 [DOI] [PMC free article] [PubMed] [Google Scholar]
- 35. Wang Q, Khayat Z, Kishi K, Ebina Y, Klip A. GLUT4 translocation by insulin in intact muscle cells: detection by a fast and quantitative assay. FEBS Lett 427: 193–197, 1998 [DOI] [PubMed] [Google Scholar]
- 36. Zeigerer A, McBrayer MK, McGraw TE. Insulin stimulation of GLUT4 exocytosis, but not its inhibition of endocytosis, is dependent on RabGAP AS160. Mol Biol Cell 15: 4406–4415, 2004 [DOI] [PMC free article] [PubMed] [Google Scholar]
- 37. Zisman A, Peroni OD, Abel ED, Michael MD, Mauvais-Jarvis F, Lowell BB, Wojtaszewski JF, Hirshman MF, Virkamaki A, Goodyear LJ, Kahn CR, Kahn BB. Targeted disruption of the glucose transporter 4 selectively in muscle causes insulin resistance and glucose intolerance. Nat Med 6: 924–928, 2000 [DOI] [PubMed] [Google Scholar]
Associated Data
This section collects any data citations, data availability statements, or supplementary materials included in this article.


