Abstract
When arteries constrict to agonists, the endothelium inversely responds, attenuating the initial vasomotor response. The basis of this feedback mechanism remains uncertain, although past studies suggest a key role for myoendothelial communication in the signaling process. The present study examined whether second messenger flux through myoendothelial gap junctions initiates a negative-feedback response in hamster retractor muscle feed arteries. We specifically hypothesized that when agonists elicit depolarization and a rise in second messenger concentration, inositol trisphosphate (IP3) flux activates a discrete pool of IP3 receptors (IP3Rs), elicits localized endothelial Ca2+ transients, and activates downstream effectors to moderate constriction. With use of integrated experimental techniques, this study provided three sets of supporting observations. Beginning at the functional level, we showed that blocking intermediate-conductance Ca2+-activated K+ channels (IK) and Ca2+ mobilization from the endoplasmic reticulum (ER) enhanced the contractile/electrical responsiveness of feed arteries to phenylephrine. Next, structural analysis confirmed that endothelial projections make contact with the overlying smooth muscle. These projections retained membranous ER networks, and IP3Rs and IK channels localized in or near this structure. Finally, Ca2+ imaging revealed that phenylephrine induced discrete endothelial Ca2+ events through IP3R activation. These events were termed recruitable Ca2+ wavelets on the basis of their spatiotemporal characteristics. From these findings, we conclude that IP3 flux across myoendothelial gap junctions is sufficient to induce focal Ca2+ release from IP3Rs and activate a discrete pool of IK channels within or near endothelial projections. The resulting hyperpolarization feeds back on smooth muscle to moderate agonist-induced depolarization and constriction.
Keywords: calcium transients, gap junctions, potassium channels, signal transduction
the cardiovascular system consists of a muscular pump and a distribution network of arteries, veins, and capillaries. Within this integrated system, it is the resistance arteries that control the magnitude and distribution of organ blood flow (4, 43, 63). To change perfusion, multiple segments of an arterial network and the cells within these structures must work in a cooperative manner (5, 44, 59). Cooperative cellular behavior is dependent on gap junctions, intercellular pores permeable to charged ions, second messengers, and perhaps paracrine agents (10, 21, 24, 39). Charged ion movement among vascular cells enables the endothelium to effectively hyperpolarize the smooth muscle and induce a robust conducted response (8, 9, 45). While studies have established the importance of electrical charge movement, they have not been able to resolve whether second messenger communication occurs and whether it contributes to blood flow control (6, 16, 38, 60).
As vascular cells are homo- and heterologously coupled (11, 24, 40), it follows that second messenger communication could occur between endothelial cells, between smooth muscle cells, and between the two cell layers. Although a range of behaviors are possible, studies to date have principally focused on two working examples (6, 54). The first highlights the idea of a “Ca2+ wave” propagating longitudinally among endothelial cells, a process that would augment conducted vasodilation (48, 53, 54). The second centers on the presumed flux of Ca2+ and/or inositol trisphosphate (IP3) through myoendothelial gap junctions to initiate a feedback response that would attenuate arterial depolarization and constriction (6, 14, 20, 60). Dora et al. (6) introduced this concept of myoendothelial feedback, and Yashiro and Duling (60) expanded on it. These investigations generally argued that two key elements underlie this defined response (6, 60). The first requires the stimulus driving constriction to depolarize smooth muscle and augment second messenger concentration. The second requires a sufficient quantity of second messenger flux to elicit endothelial Ca2+ responses that, consequently, activate a Ca2+-dependent effector. This includes endothelial nitric oxide synthase (NOS) and small- or intermediate-conductance Ca2+-activated K+ (SK or IK) channels. While the general concept of myoendothelial feedback has garnered interest, experimental observations are incomplete and originated from a diverse set of tissues (6, 13, 20, 60). To strengthen current understanding, it is necessary to perform experiments on a single vessel class under conditions in which physiological parameters such as membrane potential (Vm), endothelial Ca2+, and arterial diameter are presented in parallel with key structural information. This concerted approach would also allow investigators to address key questions related to the nature of intercellular signaling: 1) Which second messenger(s) functionally cross(es) myoendothelial gap junctions? 2) What is the dynamic nature of the endothelial Ca2+ response? Understanding the latter is particularly important to targeting specified downstream effectors and ensuring that feedback is not only graded but distinct from responses elicited by endothelium-dependent vasodilators.
With use of complementary experimental approaches, this investigation determined whether second messenger flux across myoendothelial gap junctions could initiate a feedback response in hamster retractor muscle feed arteries. We specifically hypothesized that when phenylephrine elicits a depolarization and a rise in second messenger concentration, IP3 flux across myoendothelial gap junctions will be sufficient to induce Ca2+ release from a discrete pool of IP3 receptors (IP3Rs), and this will in turn activate specific downstream effectors to moderate constriction. With use of isolated pressurized feed arteries, this study presents three sets of observations to support our working hypothesis. 1) From a functional perspective, perturbations that inhibited IK channel activation or impaired endothelial Ca2+ mobilization from the endoplasmic reticulum (ER) enhanced the contractile/electrical responsiveness to phenylephrine. 2) Structural analysis confirmed that endothelial projections make contact with the overlying smooth muscle and retained ER; key proteins (i.e., IP3Rs and IK channels) also localized in and near these structures. 3) Ca2+ imaging revealed that phenylephrine induced discrete endothelial Ca2+ events, termed “wavelets,” through IP3R activation. Our findings collectively indicate that these events activate a discrete pool of IK channels within or near the endothelial projections to induce a hyperpolarization sufficient to moderate constrictor-induced responses.
MATERIALS AND METHODS
Animal and tissue preparations.
Animal procedures were approved by the Animal Care and Use Committee at the University of Calgary. Briefly, each male golden Syrian hamster (10–12 wk of age) was anesthetized with pentobarbital sodium (65 mg/kg ip). An incision was made through the skin overlying the right or left retractor muscle (56). Superficial connective tissue was removed from the exposed tissue, which was continuously superfused with PBS (in mM: 138 NaCl, 3 KCl, 10 Na2HPO4, 2 NaH2PO4, 5 glucose, 0.1 CaCl2, and 0.1 MgSO4, pH 7.4). The retractor muscle was excised and pinned out in a dissecting dish. Connective tissue was removed, and the feed arteries were cut into 2- to 3-mm segments. The hamster was euthanized with an overdose of pentobarbital sodium administered intraperitoneally.
Vessel myography.
Feed arteries dissected free from surrounding tissues were cannulated onto glass pipettes in a customized arteriograph chamber designed to facilitate diameter and Vm measurements. The arteriograph was positioned on an inverted microscope, and the vessel was equilibrated at 15 mmHg intravascular pressure (20 min) in a physiological saline solution (PSS) at 37°C in 5% CO2 and 21% O2 (pH 7.35) containing (in mM) 119 NaCl, 4.7 KCl, 1.7 KH2PO4, 1.2 MgSO4, 1.6 CaCl2, 5 glucose, and 20 NaHCO3. Intravascular pressure was slowly raised to 40 mmHg, and contractile responsiveness was assessed by brief (∼10 s) exposure of the tissue to 60 mM KCl (55). We kept vessels at this modestly lower pressure to moderate myogenic tone (∼15 μm) and, thus, increase the overall constrictor capacity (55). Using light microscopy, we performed an end-to-end survey of the endothelial layer to ascertain cellular continuity. Vessels with contiguous endothelium robustly dilate to 0.1 μM acetylcholine; intraluminal air bubble treatment (3–4 min) visually disrupted the cellular layer, eliminating this response [Δdiameter = 23.1 ± 3.6 μm (control) and 0.4 ± 0.9 μm (endothelium-denuded), n = 7]. Upon further equilibration, we pursued the following experiments. First, phenylephrine was sequentially (0.01–1 μM) added to the superfusate while arterial diameter was monitored at one defined site. Assessments were made under control conditions and in the presence of 1) intraluminal apamin (50 nM) and/or triarylmethane (TRAM)-34 (1 μM) or 2) luminal nitro-l-arginine methyl ester (l-NAME) (50 μM). In a second set of experiments, feed arteries with intact endothelium/denuded endothelium were superfused with phenylephrine (0.1 μM) while vasomotor responses were monitored under control conditions and in the presence of 1) intraluminal apamin (50 nM) and/or TRAM-34 (1 μM). At the end of experimentation, feed arteries were exposed to a Ca2+-free PSS containing 2 mM EGTA to achieve maximal diameter. We employed the technique defined by Doughty et al. (7) to change intraluminal solutions in pressurized arteries. Arterial diameter was monitored using a ×10 objective and manual video calipers. Vm was measured using the sharp microelectrode technique. The criteria for successful cell impalement included 1) a sharp negative Vm deflection upon entry, 2) a stable recording for ≥1 min following entry, and 3) a sharp return to baseline upon electrode removal.
Supplemental experiments were also performed on pressurized (40 mmHg) feed arteries preconstricted to 0.1 μM phenylephrine or 2 mM 4-aminopyridine (4-AP), a voltage-dependent K+ (KV) channel inhibitor (17). In these experiments, diameter was continuously monitored while 10 μM BAPTA-AM (a Ca2+ buffer), 100 nM thapsigargin (a Ca2+-ATPase inhibitor), 50 μM 2-aminoethoxydiphenyl borate (2-APB, a nonselective IP3R inhibitor), or 10 μM xestospongin C (a selective IP3R blocker) (57, 58) was luminally perfused. We assessed maximal diameter and smooth muscle Vm as described above.
Endothelial Ca2+ imaging.
This study first assessed endothelial Ca2+ dynamics in pressurized vessels (40 mmHg). Briefly, feed arteries were intraluminally perfused (10 min) with a HEPES buffer (37°C, pH 7.3) containing (in mM) 134 NaCl, 6 KCl, 1 MgCl2, 2 CaCl2, 10 HEPES, 10 glucose, and 0.01 fluo 4-AM and 2.5 μg/ml pluronic acid. After the loading period, the luminal perfusate was replaced with fluo 4-free HEPES buffer (15 min) and then with PSS (22, 23). Endothelial Ca2+ events were visualized by exciting fluo 4-loaded arteries using a krypton-argon laser (wavelength = 488 nm, power = 5–8 mW) and monitoring emission spectra (510 nm) through a ×63 water immersion objective (numerical aperture 1.2) coupled in series with a dual Nipkow spinning disk confocal head (Solamere Technology Group) and a Mega-10 intensified charge-coupled device camera (Stanford Photonics). Image acquisition was limited to two 30-s periods (20 frames/s) in the absence and presence of phenylephrine (0.1 μM). In a second set of complementary experiments, isolated feed arteries were opened longitudinally, mounted onto a Sylgard block, and equilibrated for 20 min in HEPES buffer containing fluo 4-AM and pluronic acid (22, 23). As mentioned above, the loading solution was replaced with fluo 4-free HEPES buffer (15 min) and then with PSS. The Sylgard block was placed in a perfusion chamber, with the endothelium near, but not in contact with, the bottom of the chamber. Image acquisition consisted of one 135-s period during which phenylephrine (0.1 μM) or 4-AP (2 mM) was introduced at the 45-s mark and 2-APB was introduced at the 90-s mark. We halted the collections for 5 min to allow time for xestospongin C penetration.
Movie file analysis.
Movie files were analyzed offline using software provided by Stanford Photonics. Briefly, investigators first identified 10 visibly loaded endothelial cells in phenylephrine-treated arteries, and a single measurement box (∼1.5–1.5 μm) was placed on each cell near sites of transient Ca2+ activity. In endothelial cells where such sites could not be identified, the measurement box was placed on the center of the visible region. Changes in fluo 4 emission were assessed at these fixed positions, and data were normalized to baseline fluorescence. Global endothelial Ca2+ was assessed by placement of a measurement box over three fluo 4-loaded endothelial cells. Endothelial cells displaying bright fluo 4 fluorescence, an index of cellular damage, were excluded from analysis. A secondary line scan analysis was performed with ImageJ to characterize the spatial and temporal characteristics of defined Ca2+ events. This analysis entailed identifying the initiation sites for Ca2+ wavelets and then performing two line scans, one parallel (“length”) and the other perpendicular (“width”) to the long axis of the endothelial cell. Ca2+ wavelet area was subsequently estimated by multiplying length by width. Duration, which was also measured by line scan analysis, represented the time interval between the initiation and the termination of the Ca2+ wavelet.
Immunofluorescence microscopy.
Isolated feed arteries were prepared for immunohistochemistry as previously described (23). Briefly, feed arteries were opened longitudinally, mounted onto a Sylgard block, and then fixed/permeabilized in PBS containing 4% formalin and 0.5% Triton. Fixed arteries were blocked/permeabilized for 1 h (PBS supplemented with 3% goat serum, 1% BSA, and 0.05% Tween 20) and then exposed overnight to a PBS buffer containing primary antibodies: α1d-adrenoreceptor (1:100 dilution), KCa2.3 (1:400 dilution), KCa3.1 (1:400 dilution), IP3R1 (1:400 dilution), and IP3R2 (1:400 dilution). On the next morning, the vessels were washed three times in PBS-0.5% Triton and then incubated for 1 h in a PBS-Triton buffer containing Alexa Fluor 568 or Alexa Fluor 647 goat anti-rabbit IgG (1:1,000 dilution) antibody. Hoechst 33342 (1:2,000 dilution) was used to label nuclei. Immunofluorescence was detected through a ×63 water immersion lens coupled to a Perkin Elmer RS-3 Ultraview or a Nikon A1 laser confocal microscope. Images were recorded in z stacks at 0.25-μm increments from the base of the endothelium to the surface of the smooth muscle. Image analysis and three-dimensional (3-D) rendering were performed offline using Velocity and NIS Element software. Primary antibodies were chosen/screened on the basis of prior experimentation (2, 49) and by Western blot analysis. Secondary antibody controls were also performed and were negative for nonselective labeling staining.
Transmission electron microscopy, tomography, and immunogold labeling.
Feed arteries were prepared for electron microscopy as described by Sandow et al. (42). Briefly, hamsters were anesthetized with pentobarbital sodium (65 mg/kg) and perfused intracardially with 0.9% NaCl containing 0.1% NaNO3, 0.1% BSA, and 5 U/ml heparin to clear out the blood. Once cleared of blood, the animal was perfused with 3% glutaraldehyde and 1% paraformaldehyde in 0.1 mmol/l sodium cacodylate with 0.2 mmol CaCl2·6H2O, 0.15 mol/l sucrose, and 10 mmol/l betaine. Segments of retractor muscle feed arteries were dissected free of surrounding tissues and further fixed overnight in the same solution (42). On the next day, the samples were washed three times and postfixed for 1 h in a 1% osmium tetroxide solution buffered with sodium cacodylate. Tissues were then dehydrated through a graded series of ethanol washes and embedded in Spurr's resin. Ultrathin sections were cut in a Reichert-Jung Ultracut E microtome using a diamond knife and stained with 2% aqueous uranyl acetate and Reynolds' lead citrate. Sections were viewed and photographed on a Hitachi H7650 transmission electron microscope (80 keV) coupled to an AMT 16000 digital camera.
To examine the subcellular structure of the endothelial projection, electron-tomographic imaging was performed. Briefly, feed arteries were prepared as described above; thick (∼300-nm) sections were cut and stained with 2% aqueous uranyl acetate and Reynolds' lead citrate. Sections were then placed on one side of a transmission electron microscopy slot grid (1 × 2 mm slot) covered with a continuous formvar film (∼40 nm) and left to dry (10 min). Colloidal gold particles (10 nm diameter) were then placed on both sides of the grid to serve as fiducial markers, and a thin carbon coating was applied to both sides of the grid for mechanical stabilization and to reduce electric charging. Once prepared, sections were viewed on a Tecnai F20 transmission electron microscope (200 keV), regions of interest were defined, and images were captured on a 1,024 × 1,024 charge-coupled device camera (GIF 794, Gatan, Pleasanton, CA). To perform dual-axis transmission electron-microscopic tomography, Serial EM software (28) was employed to capture one image per degree of sample rotation (between 120 and 130 degrees). Tomographic reconstruction was performed by weighted backprojection with the IMOD software package (18, 27); this yielded a contiguous stack of two-dimensional photomicrographs with ∼4-nm resolution. The same software was used to trace subcellular structures on each section of the contiguous stack. We then compiled the traces to produce a 3-D rendition of the endothelial projection.
Isolated feed arteries were prepared for immunogold labeling using a modified immunofluorescent procedure. As described above, vessels were opened longitudinally, mounted onto a Sylgard block, fixed/permeabilized, and then exposed overnight to a PBS buffer containing primary antibodies (IP3R1 and KCa3.1 at 1:400 dilution). On the next morning, the vessels were washed and incubated for 4 h in a PBS-Triton buffer containing immunogold (5-nm particle)-labeled goat anti-rabbit IgG (1:1,000 dilution) antibodies. After a second set of washes, tissues were postfixed for 1 h in a 1% osmium tetroxide-PBS solution, dehydrated in ethanol, and embedded in Epon. Ultrathin sections were cut, lightly stained with 2% aqueous uranyl acetate and Reynolds' lead citrate (15 min), and viewed/photographed using a Hitachi H7650 transmission electron microscope (80 keV) and an AMT 16000 digital camera.
Solutions and chemicals.
2-APB, thapsigargin, BAPTA-AM, phenylephrine, 4-AP, apamin, TRAM-34, l-NAME, and buffer reagents were purchased from Sigma-Aldrich (St. Louis, MO); xestospongin C from Cayman Chemicals (Ann Arbor, MI); fluo 4, pluronic acid, bis-(1,3-dibutylbarbituric acid)trimethine oxonol, Cyto-Green, Hoechst 33342, and Alexa Fluor 568 and Alexa Fluor 647 goat anti-rabbit IgG from Invitrogen; primary antibodies against IP3R1 (Ab 9072) and IP3R2 (Ab 9074) from Chemicon; and primary antibodies against α1d-adrenoreceptor (AAR-019), KCa2.3 (APR35098), and KCa3.1 (APC-025) from Alomone (Jerusalem, Israel) or Aviva Systems. Electron Microscopy Sciences was the preferred supplier of electron microscopy reagents, except the gold-labeled secondary antibodies, which were obtained from Structure Probe.
Statistical analysis.
Data are expressed as means ± SE; n indicates the number of feed arteries or cells. One feed artery was used per animal. Paired t-tests were used to compare feed artery responses prior to and following an experimental treatment. P ≤ 0.05 was considered statistically significant.
RESULTS
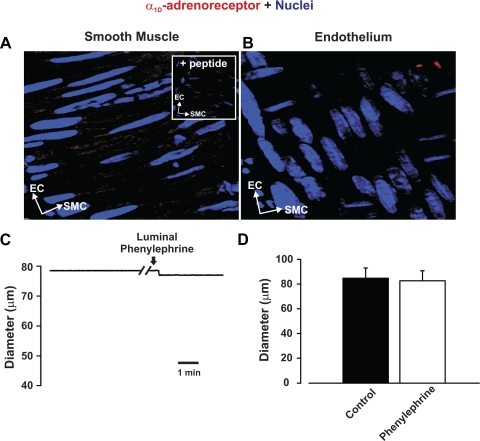
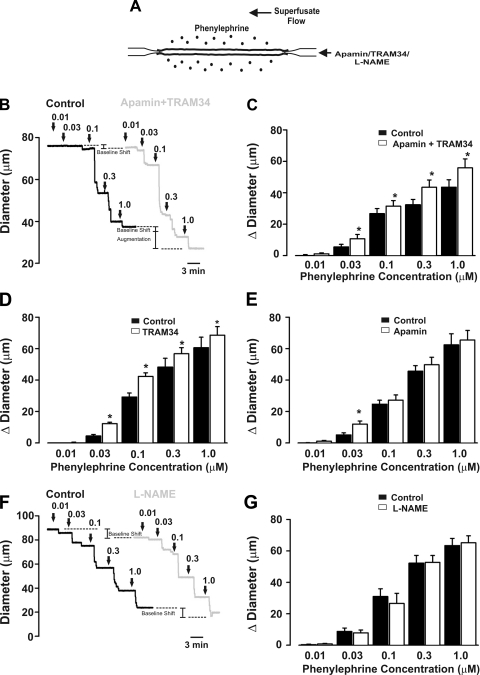
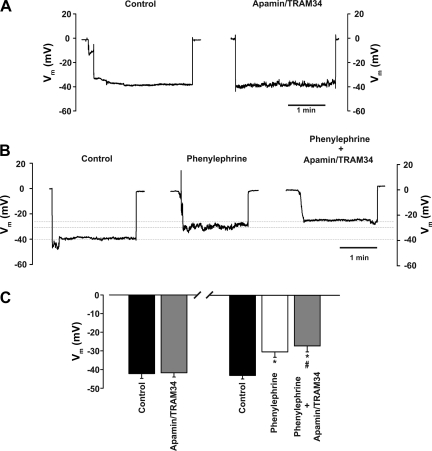
To test the overall hypothesis, one needs to deploy a constrictor agonist that only stimulates arterial smooth muscle. We chose phenylephrine, a selective α1-adrenoreceptor agonist, on the basis of the work of Jackson et al. (15), who showed that α1-adrenoreceptors are neither molecularly nor functionally present in endothelial cells from hamster skeletal muscle arteries. Similarly, we found that α1d-adrenoreceptor expression was restricted to the smooth muscle layer (Fig. 1, A and B) and that luminal phenylephrine application did not elicit dilation, a predicted response if such receptors were indeed present in the endothelium (Fig. 1, C and D). With this important control work completed, our examination of the specified feedback mechanism began with functional experiments in which we assessed whether the inhibition of Ca2+-dependent effectors (i.e., SK/IK channels or NOS) augmented agonist-induced constriction (Fig. 2A). Figure 2, B and C, reveals that global phenylephrine induces a constriction that increases proportionally with agonist concentration. Consistent with the concept of myoendothelial feedback, the combined luminal introduction of SK/IK inhibitors augmented phenylephrine-induced constriction beyond a baseline shift in arterial tone. IK inhibition alone produced a similar augmentation, while the introduction of apamin alone had a modest effect (Fig. 2, D and E). Control experiments confirmed that the ability of SK/IK inhibitors to augment phenylephrine (0.1 μM)-induced tone was absent in endothelium-denuded arteries [diameter response to apamin + TRAM-34 = 12.5 ± 1.0 μm (control) and 1.8 ± 1.5 μm (endothelium-denuded), n = 5]. In contrast, intraluminal l-NAME shifted baseline tone but had no significant effect on phenylephrine-induced constriction, inconsistent with NOS enabling the specified feedback response (Fig. 2, F and G). Subsequent measurements of arterial Vm supported a role for the SK/IK channel, as phenylephrine-induced depolarization was enhanced by ∼3.5 mV following the luminal application of apamin + TRAM-34 (Fig. 3).
Fig. 1.
Expression of α1D-adrenoreceptors and effects of luminal phenylephrine perfusion. A and B: feed arteries were isolated, fixed, and prepared for immunohistochemistry. Nuclei were stained with 4′,6-diamidino-2-phenylindole to differentiate cellular orientation of endothelial cells (ECs) and smooth muscle cells (SMCs). In A, z-stack images restricted to smooth muscle cell layer reveal abundant expression of α1D-adrenoreceptor (red); peptide control is presented in inset. In B, z-stack images restricted to endothelial cell layer reveal lack of α1D-adrenoreceptor expression. C and D: representative trace and summary data (minimal and maximal diameter were 16.12 ± 2 and 109 ± 5 μm, respectively, n = 5) illustrate that luminal phenylephrine (0.1 μM) perfusion does not elicit vasodilation.
Fig. 2.
Small- and intermediate-conductance K+ (SK and IK) channel blockade augments constriction induced by global phenylephrine. A: protocol. Phenylephrine was globally applied (0.01–1.0 μM) to the vessel, and responses were measured in the absence or presence of intraluminal apamin (50 nM), triarylmethane (TRAM)-34 (1 μM), and nitro-l-arginine methyl ester (l-NAME, 50 μM). B: representative traces showing diameter changes under control condition (black trace) and in the presence of luminal apamin + TRAM-34 (gray trace). C: summary data highlighting the ability of luminal apamin + TRAM-34 to augment phenylephrine-induced constriction (n = 6). In C, absolute diameters under control conditions and with apamin + TRAM-34 at maximum and minimum were 76 ± 4, 72 ± 4, 83 ± 6, and 9 ± 2 μm, respectively. Diameter change due to luminal perfusion of apamin + TRAM-34 was 2.2 ± 0.7 μm. D and E: summary data highlighting effects of luminal TRAM-34 (n = 6) or apamin (n = 6) on phenylephrine-induced constriction. Diameters at rest with TRAM-34 or apamin at maximum and minimum were 95 ± 6, 90 ± 4, 113 ± 4, and 11 ± 2 μm (TRAM-34 experiment) and 88 ± 4, 81 ± 3, 111 ± 5, and 11 ± 2 μm (apamin experiment). Diameter change due to luminal perfusion of TRAM-34 or apamin was 7.5 ± 2.1 and 5.9 ± 1.3 μm, respectively. F: representative traces showing diameter changes under control conditions (black trace) and in the presence of l-NAME (gray trace). l-NAME shifts baseline diameter without augmenting phenylephrine-induced constriction. G: summary data of phenylephrine-induced responses in the absence and presence of l-NAME (n = 5). Diameters under control conditions and with l-NAME at maximum and minimum were 94 ± 6, 89 ± 6, 106 ± 6, and 16 ± 4 μm, respectively. Diameter change due to luminal perfusion of l-NAME alone was 4.7 ± 1.8 μm.
Fig. 3.
Apamin + TRAM-34 enhances depolarization of phenylephrine-treated arteries. A: control trace illustrates effects of luminal apamin (50 nM) + TRAM-34 (1 μM) on arterial membrane potential (Vm) in the absence of phenylephrine. B and C: phenylephrine (0.1 μM) was applied globally while Vm was monitored in the absence or presence of luminal apamin + TRAM-34. Representative trace (B) and summary data (C) highlight the ability of apamin + TRAM-34 to enhance depolarization only in phenylephrine-induced arteries (n = 6 for each grouping). *Significantly different from control depolarization. #Significantly different from phenylephrine-induced depolarization.
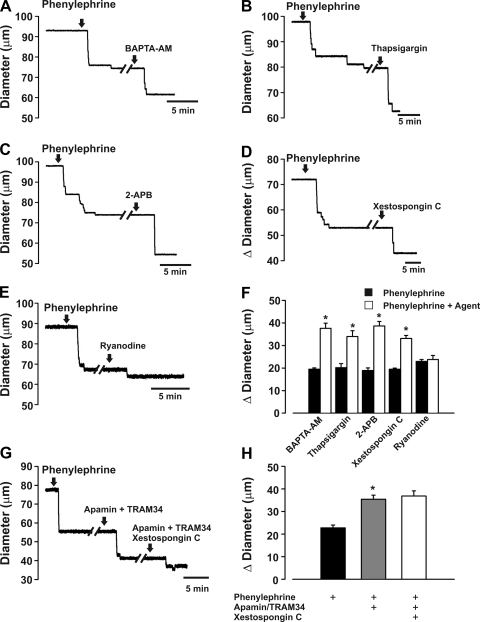
Having designated IK channels as a principal effector, further work was undertaken to ascertain the role of endothelial Ca2+ dynamics in the specified myoendothelial feedback response. Our physiological approach entailed an assessment of phenylephrine-induced tone prior to and following luminal perfusion with BAPTA-AM (a Ca2+ chelator), thapsigargin (an ER Ca2+-ATPase inhibitor), 2-APB/xestospongin C (IP3R inhibitors of variable selectivity), and ryanodine [which locks the ryanodine receptor (RyR) into a subconductance state (46)]. Figure 4, A and F, reveals that luminal BAPTA-AM enhanced phenylephrine-induced constriction. Luminal thapsigargin, 2-APB, and xestospongin C achieved similar results, findings consistent with ER Ca2+ release via IP3R-activating IK channels (Fig. 4, B–D). In contrast, luminal ryanodine had no effect on diameter, suggesting that the RyR is absent from endothelial cells (Fig. 4E). Control experiments in Fig. 4, G and H, confirmed that xestospongin C-induced constriction was absent in vessels pretreated with intraluminal IK/SK channel blockers.
Fig. 4.
Altering endothelial Ca2+ mobilization enhances phenylephrine-induced constriction. Briefly, feed arteries were isolated, pressurized, and superfused with phenylephrine while changes in diameter were monitored in the presence or absence of intraluminal BAPTA-AM (10 µM), thapsigargin (100 nM), 2-aminoethoxydiphenyl borate (2-APB) (50 µM), xestospongin C (10 µM), and ryanodine (50 µM). A–E: representative traces highlight the ability of Ca2+ chelation (BAPTA-AM), endoplasmic reticulum (ER) Ca2+ depletion (thapsigargin), inositol trisphosphate (IP3) receptor (IP3R) inhibition (2-APB/xestospongin C), and the opening of ryanodine receptor (RyR, ryanodine) to augment phenylephrine-induced constriction. F: summary data of feed artery responsiveness to phenylephrine alone and in combination with BAPTA-AM (n = 7), thapsigargin (n = 5), 2-APB (n = 8), xestospongin C (n = 7), and ryanodine (n = 5). Absolute diameter at rest, maximum diameter, and minimum diameter were 93 ± 4, 109 ± 3, and 16 ± 3 μm, respectively (BAPTA-AM experiment); 95 ± 4, 107 ± 4, and 13 ± 1 μm, respectively (thapsigargin experiment); 97 ± 6, 111 ± 5, and 13 ± 2 μm, respectively (2-APB experiment); 93 ± 5, 110 ± 3, and 20 ± 1 μm, respectively (xestospongin C experiment); and 85 ± 6, 108 ± 5, and 17 ± 4 μm, respectively (ryanodine experiment). *Significantly different from control. Diameter change due to luminal perfusion of BAPTA-AM, thapsigargin, 2-APB, and xestospongin C alone was 8.1 ± 1.0, 5.6 ± 1.0, 8.1 ± 1.7, and 5.5 ± 0.3 μm, respectively. G and H: representative traces and summary data (n = 6) highlighting effects of xestospongin C following sequential application of phenylephrine and apamin + TRAM-34. Diameter at rest, maximum diameter, and minimum diameter were 85 ± 7, 109 ± 7, and 17 ± 3 μm, respectively.
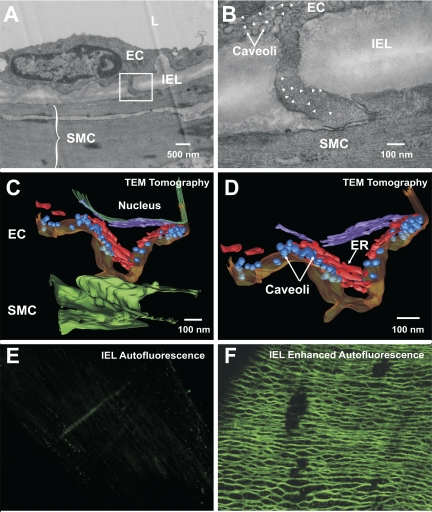
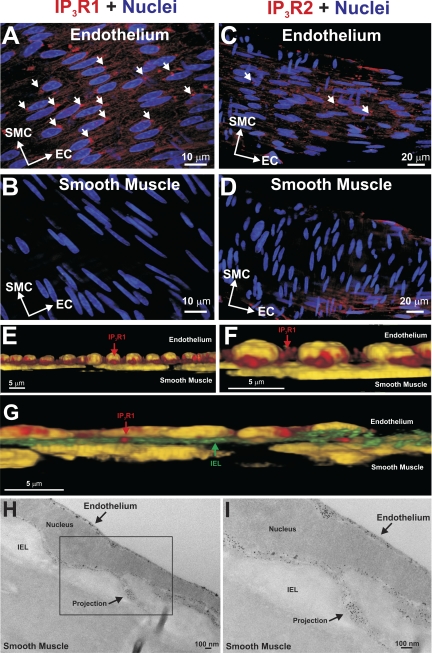
A structural analysis was undertaken to determine whether endothelial projections contact smooth muscle and whether IK channels/IP3Rs localize in or near endothelial projections. Electron microscopy confirmed that endothelial projections make contact with vascular smooth muscle (Fig. 5A). These structures were often found close to the endothelial nucleus, and membranous organelles reminiscent of ER were present at the base of and within the projection (Fig. 5B). With use of tomographic approaches to enhance visualization, ER-like structures became more discernable within the projection, as did the caveoli (Fig. 5, C and D). To localize IP3R and IK channels in or near endothelial projections, using tissue autofluorescence, we attempted to map “holes” in the internal elastic lamina (IEL) and then place the proteins within these specified regions. IEL autofluorescence was low in feed arteries (Fig. 5E); if beam strength and detector sensitivity were dramatically increased, a meshlike matrix network became visible, although IEL holes per se were not identifiable (Fig. 5F). Given this limitation, the preceding approach was modified, so that immunohistochemistry was performed in tandem with the marking of endothelial and smooth muscle nuclei. Figure 6, A and B, reveals that IP3R1 and IP3R2 label endothelial cells; repetitive punctate foci were more common for IP3R1, and this pattern was evident near nuclei where endothelial projections often arise. Smooth muscle labeling was largely absent (Fig. 6, C and D), a finding indicative of limited antibody penetration in these whole mounted arteries. We subsequently performed image enhancement on these photomicrographs, in which nuclei were colored yellow and red fluorescence was limited, so that only concentrated areas of IP3R1 labeling would be observed. In Fig. 6, E and F, 3-D renditions show that IP3R1 hotspots were observed between endothelial and smooth muscle nuclei. When IEL autofluorescence was visible, hotspots could be found within this tissue layer, suggestive of IP3R1 localization within projections (Fig. 6G). Immunogold labeling confirmed this view, and as shown in Fig. 6, H and I, electron-dense particles appear not only within projections, but underneath the plasma membrane in the endothelial cell body.
Fig. 5.
Endothelial projections make contact with smooth muscle. Feed arteries were isolated and prepared for transmission electron microscopy (TEM) and immunohistochemistry. A: traditional transmission electron photomicrograph (×15,000) of the arterial wall highlights lumen (L), endothelial cells (EC), smooth muscle cells (SMC), internal elastic lamina (IEL), and endothelial projection. B: higher magnification (×40,000) reveals points of contact between the 2 cell types: caveoli and ER-like structures (arrowheads) are visible at the base and within the endothelial projection. Photomicrograph is representative of 3 different arterial preparations. C and D: tomographic 3-D reconstructions of the endothelial projection. Rendered images reveal that smooth muscle (dark green) and endothelial (dark yellow) membranes come close to one another. A primary (red) and a secondary (purple) ER structure were resolved within the projection near caveoli (blue) or next to nuclei (dark green), respectively. E and F: IEL autofluorescence was weak in retractor muscle feed arteries but could be enhanced by increasing beam strength and detector gain. Photomicrograph is representative of 4 different arterial preparations.
Fig. 6.
Cell-specific labeling of IP3R1 and IP3R2. A–D: feed arteries were isolated, fixed, and prepared for immunohistochemistry. Nuclei were stained to reveal the distinct orientation of endothelial and smooth muscle cells. A and B: z-stack images restricted to the endothelial cell layer reveal IP3R1 and IP3R2 labeling. C and D: z stacks restricted to the smooth muscle cell layer reveal limited IP3R labeling, likely due to poor antibody penetration. Short arrows denote punctate sites of IP3R localization. Photomicrographs are representative of 5 different arterial preparations. E–I: 3-D rendering and immunogold labeling confirm IP3R1 expression in endothelial projections. E and F: existing photomicrographs were contrast-enhanced by colorizing the nuclei yellow and by decreasing red fluorescence, so that only concentrated areas of IP3R1 labeling areas are evident. Enhanced photomicrographs were rendered in 3-D, revealing a cross-sectional view of endothelial and smooth muscle nuclei. Note punctate IP3R1 labeling between the 2 sets in nuclei. In G, a strand of autofluorescent IEL is visualized between endothelial and smooth muscle nuclei, and IP3R1 appears to penetrate through the connective tissue layer. H and I: immunogold labeling reveals punctate IP3R1 labeling near the endothelial cell membrane and within the endothelial projection. Photomicrographs are representative of 3 different arterial preparations.
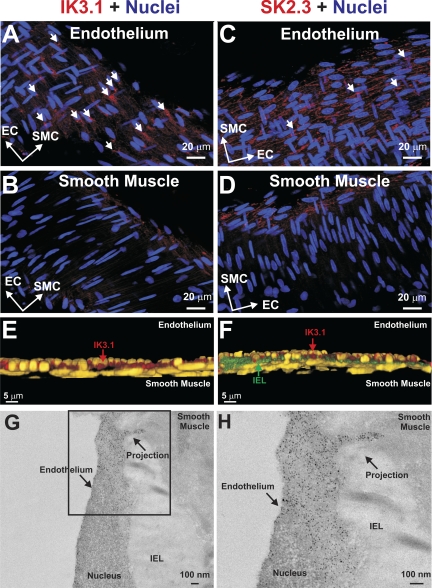
A similar approach was used to determine IK (i.e., KCa3.1) and SK (i.e., KCa2.3) channel localization. As mentioned above, a z stack of confocal images was collected, nuclei orientation was mapped, and KCa3.1/KCa2.3 expression was determined. As shown in Fig. 7, A and B, KCa3.1 and KCa2.3 labeling was specific to the endothelium, and the two proteins display different localization patterns. KCa3.1 labeling was more punctate, with foci that often appeared near endothelial nuclei. In contrast, KCa2.3 labeling was less discrete and appeared to outline the endothelial cell body. Neither of the antibodies labeled the smooth muscle layer (Fig. 7, C and D). Image enhancement and 3-D rendering techniques (Fig. 7E) showed that KCa3.1 could be found between endothelial and smooth muscle nuclei. Foci of KCa3.1 labeling also appeared within the IEL, consistent with channel expression in the endothelial projection (Fig. 7F). Immunogold labeling subsequently showed that KCa3.1 was present in and near endothelial projections (Fig. 7, G and H).
Fig. 7.
Cell-specific labeling of KCa3.1 (IK3.1) and KCa2.3 (SK3.2). Feed arteries were isolated, fixed, and prepared for immunohistochemistry. Nuclei were stained to reveal distinct orientation of endothelial and smooth muscle cells. A and B: z-stack images restricted to the endothelium better reveal KCa3.1 and KCa2.3 labeling. C and D: z stacks restricted to the smooth muscle reveal no apparent KCa3.1 or KCa2.3 labeling. Short arrows denote punctate sites of protein localization. Photomicrographs are representative of 5 different arterial preparations. E and F: 3-D rendering and immunogold labeling confirm KCa3.1 expression in endothelial projections. Existing photomicrographs were contrast-enhanced by colorizing the nuclei yellow and by decreasing red fluorescence, so that only concentrated areas of KCa3.1 labeling were evident. Enhanced photomicrographs were rendered in 3-D, revealing a cross-sectional view of endothelial and smooth muscle nuclei. Note punctate KCa3.1 labeling between the 2 sets in nuclei. In F, a strand of autofluorescent IEL is visualized between the endothelial and smooth muscle nuclei, and KCa3.1 appears to penetrate the connective tissue layer. G and H: immunogold labeling reveals punctate KCa3.1 labeling near the endothelial cell membrane and within the endothelial projection. Photomicrographs are representative of 3 different arterial preparations.
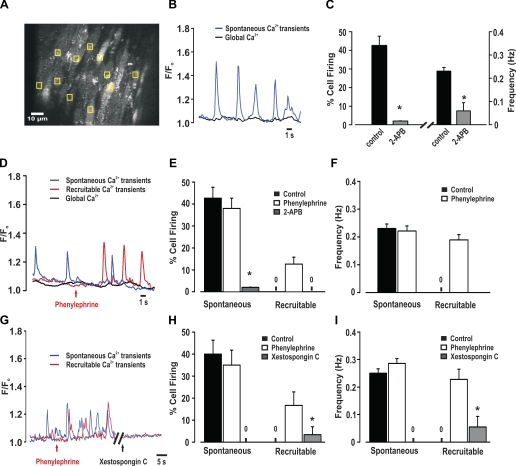
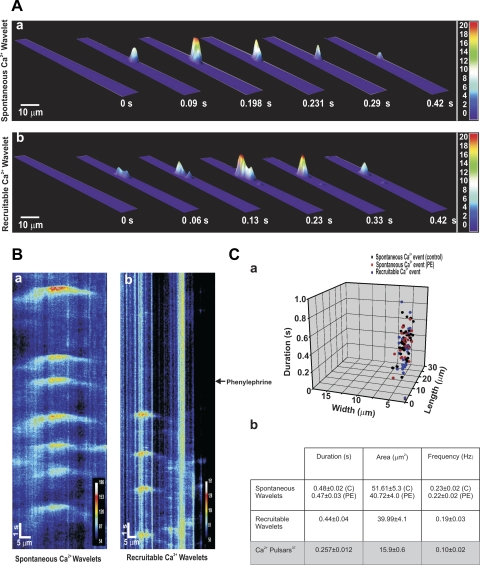
To assess whether phenylephrine elicits discrete endothelial Ca2+ events, feed arteries were mounted in a pressure myograph, and fluo 4 was introduced luminally to facilitate the preferential loading of endothelial cells. In regions where fluo 4 loading was evident in endothelial, but not smooth muscle, cells (Fig. 8A), transient Ca2+ events (frequency = 0.19 Hz) were identified in ∼40% of cells, whether phenylephrine was absent or present (Fig. 8, B and C). These events appeared wavelike, but systematic analysis was not possible, as fluo 4-loaded smooth muscle impaired sequential measurements and many endothelial cells did not reside in a common focal plane. Given these issues, we began working with opened arteries pinned to a Sylgard block, which helped limit tissue movement and enabled monitoring of a greater portion of the endothelium (Fig. 9A). Similar to intact vessels, ∼40% of endothelial cells fired discrete Ca2+ events with a frequency of 0.23 Hz under resting conditions (Fig. 9, B and C). These spontaneous events were inhibited by 2-APB, and their generation did not affect global Ca2+ concentration. While global phenylephrine application did not influence the preexisting spontaneous events, it did initiate discrete Ca2+ events in previously quiescent cells (Fig. 9, D-F; see video clip in Supplemental Material for this article, available online at the Journal website). These new “recruitable” events fired at ∼0.22 Hz and were sensitive to the nonselective IP3R inhibitor 2-APB. They were, along with the spontaneous events, sensitive to xestospongin C (Fig. 9, G–I). The discrete nature of the spontaneous and recruitable Ca2+ events are revealed in 3-D surface plots, and subsequent line scan analysis shows that, once initiated, both endothelial Ca2+ events spread in a wavelike manner part way through the cell (Fig. 10, A and B). Figure 10C reveals that the spontaneous or recruitable Ca2+ wavelets were longer in duration, larger in area, and greater in frequency than Ca2+ pulsars (23). The average velocity of Ca2+ wavelets was 40 ± 3 μm/s.
Fig. 8.
Discrete endothelial Ca2+ events in pressurized arteries. A–C: pressurized feed arteries (40 mmHg) were loaded with fluo 4-AM, and endothelial Ca2+ transients were monitored in the absence or presence of phenylephrine. A: representative photomicrograph reveals that luminal application of fluo-4 (10 µM) loads endothelial and smooth muscle cells. To measure endothelial Ca2+, measurement boxes were placed on cells, in areas where the smooth muscle was not loaded with fluo 4. B: representative traces of spontaneous endothelial Ca2+ events under resting conditions and in the presence of phenylephrine (0.1 μM). F/F0, fluorescence normalized to basal fluorescence. C: summary data highlighting frequency and percentage of cells firing spontaneous endothelial Ca2+ events (n = 62 cells from 15 arteries).
Fig. 9.
Phenylephrine superfusion elicits discrete endothelial Ca2+ events. A–C: feed arteries were cut open, pinned to a Sylgard block, and loaded with fluo 4-AM. Ca2+ activities were monitored under resting conditions and in the presence of phenylephrine (0.1 μM) with or without 2-APB (50 µM) or xestospongin C (10 µM). A: representative photomicrograph reveals fluo 4-AM loading of endothelial cells. To systematically analyze Ca2+ events, 10 endothelial cells were chosen, and 1 measurement box was placed within each cell over active areas, if present. Global endothelial Ca2+ was assessed by placing a measurement box over 3 visible endothelial cells loaded with fluo 4-AM. B: representative traces of spontaneous and global endothelial Ca2+ events under resting conditions. C: summary data highlighting frequency and percentage of cells firing spontaneous endothelial Ca2+ events (n = 150 cells from 15 arteries). D: representative traces of spontaneous, recruitable, and global endothelial Ca2+ events in the absence and presence of phenylephrine. Note phenylephrine's ability to recruit previously quiescent endothelial cells to fire discrete endothelial Ca2+ events. E and F: summary data highlighting frequency and percentage of cells firing spontaneous and recruitable endothelial Ca2+ events (n = 150 cells from 15 arteries). G: representative traces of spontaneous and recruitable endothelial Ca2+ events in the absence and presence of xestospongin C. H and I: summary data highlighting frequency and percentage of cells firing spontaneous and recruitable endothelial Ca2+ events (n = 50 cells from 5 arteries). *Significantly different from control.
Fig. 10.
Characterization of endothelial Ca2+ wavelets. A: 3-D surface plots of spontaneous and recruitable Ca2+ wavelets. Field of view corresponds to the area of a cell. B: pseudo-line scan analysis highlighting temporal and spatial nature of spontaneous and recruitable Ca2+ events in endothelial cells. C: summary data highlighting spatiotemporal characteristics of spontaneous [in the absence (control, C, n = 32 cells) and presence of phenylephrine (PE, n = 30 cells)] and recruitable (n = 28 cells) Ca2+ wavelets (a) and average values presented alongside published findings (23) for Ca2+ pulsars (b).
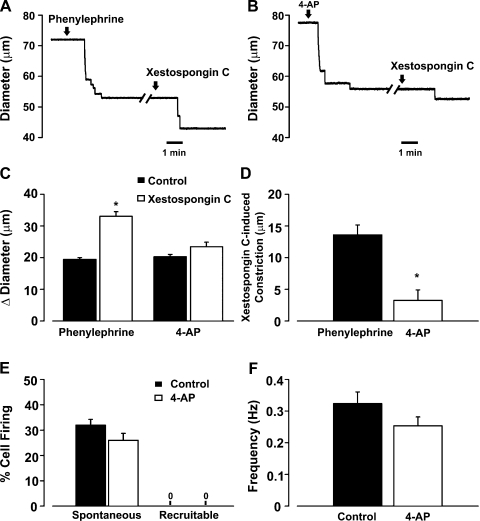
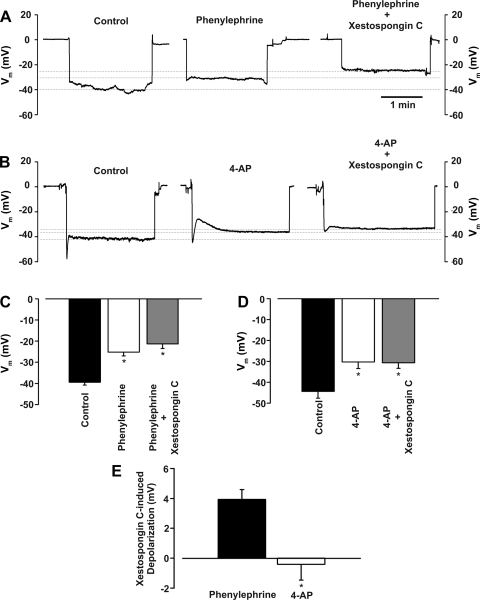
To strengthen the relationship between IP3 and the induction of recruitable Ca2+ wavelets, a final set of experiments were performed using phenylephrine or 4-AP. The latter agent is a KV channel inhibitor that induces arterial depolarization/constriction independent of IP3 production. Consistent with IP3, and not Ca2+, being the key second messenger fluxing across gap junctions, we present three key findings. 1) Xestospongin C-induced constriction, a functional measure of Ca2+ wavelet activity, was greater in vessels pretreated with phenylephrine than in vessels pretreated with 4-AP (Fig. 11, A–D). 2) Confocal Ca2+ measurements revealed that, unlike phenylephrine, 4-AP application failed to induce the generation of recruitable Ca2+ wavelets (Fig. 11, E and F). 3) Vm measurements showed that intraluminal xestospongin C further enhanced depolarization in phenylephrine- but not 4-AP-treated feed arteries (Fig. 12).
Fig. 11.
IP3 flux in the initiation of myoendothelial feedback and recruitable Ca2+ wavelets. A–D: feed arteries were isolated, pressurized, and superfused with phenylephrine (0.1 μM, an α-adrenoreceptor agonist, n = 6) or 4-AP (2 mM, a voltage-dependent K+ channel inhibitor, n = 6), while diameter changes were monitored in the presence or absence of luminal xestospongin C (10 μM, an IP3R inhibitor). A and B: representative traces of xestospongin C-induced constriction in feed arteries pretreated with phenylephrine or 4-AP. C and D: summary data highlighting arterial responsiveness to phenylephrine (n = 6) or 4-AP (n = 6) alone and in combination with xestospongin C. Diameter at rest, maximum diameter, and minimum diameter were 93 ± 5, 110 ± 3, and 20 ± 1 μm (phenylephrine experiment) and 73 ± 3, 87 ± 5, and 20 ± 1 μm (4-AP experiment). *Significantly different from control (C) or phenylephrine (D). Diameter change due to luminal perfusion of xestospongin C alone was 3.3 ± 1.6 μm. E and F: feed arteries were opened, pinned to a Sylgard block, and loaded with fluo 4-AM. Ca2+ wavelets were monitored in the absence and presence of 4-AP. See Fig. 8 legend for analysis details. Summary data (n = 50 cells from 5 arteries) highlight the inability of 4-AP to alter generation of spontaneous and recruitable Ca2+ wavelets.
Fig. 12.
IP3R inhibition enhances arterial depolarization to phenylephrine, but not 4-AP. Phenylephrine (0.1 μM) or 4-AP (2 mM) was applied to a pressurized vessel while Vm was monitored in the absence or presence of luminal xestospongin C (10 µM). A–D: representative traces and summary data highlight the ability of xestospongin C to enhance depolarization induced by phenylephrine (n = 6) or 4-AP (n = 5). E: summary data highlight the ability of xestospongin C to enhance phenylephrine-induced, but not 4-AP-induced, depolarization. *Significantly different from control.
DISCUSSION
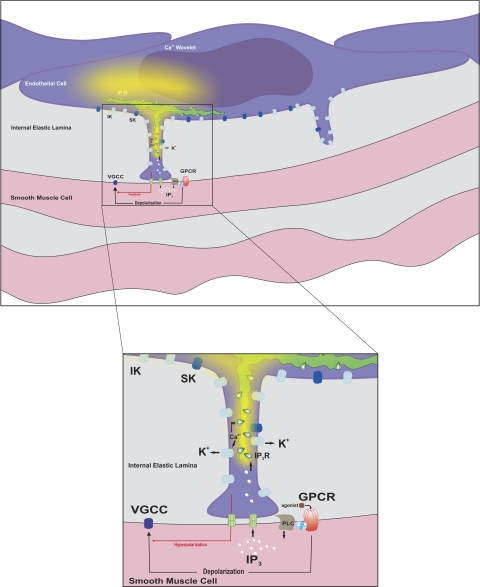
In this study, we determined whether second messenger flux through myoendothelial gap junctions can initiate a negative-feedback response that attenuates arterial constriction. It was specifically hypothesized that when agonists depolarize smooth muscle and elicit a rise in second messenger concentrations, IP3 flux across myoendothelial gap junctions is sufficient to initiate discrete endothelial Ca2+ events and locally activate downstream effectors to moderate the initial response. In support of this hypothesis, this investigation provided three sets of experimental observations. 1) The inhibition of IK and, to a lesser extent, SK channels, along with the impairment of ER Ca2+ mobilization, enhanced the contractile/electrical state of feed arteries to phenylephrine. 2) A structural analysis confirmed that endothelial projections, with ER at the base and within these extensions, make contact with smooth muscle and that IP3Rs and IK channels are focally expressed within or near these structures. 3) Confocal Ca2+ imaging revealed that phenylephrine induced discrete endothelial Ca2+ events, termed wavelets, as a result of IP3R activation. Our findings indicate that a myoendothelial feedback mechanism involving gap junctional communication does exist under constrained conditions and that, along with voltage-dependent K+ (KV) and large-conductance Ca2+-activated K+ (BK) channels (1, 30), it plays a role in tone development (Fig. 13).
Fig. 13.
Proposed myoendothelial feedback pathway. Smooth muscle agonists, such as phenylephrine, activate G protein-coupled receptors (GPCR) to initiate IP3 production via phospholipase C (PLC). This second messenger crosses myoendothelial gap junctions and triggers Ca2+ release from IP3Rs localized to the ER. As Ca2+ wavelets spread from the initiation site, they activate intermediate-conductance Ca2+-activated K+ (IK) channels concentrated within or near the endothelial projection. Resulting hyperpolarization spreads back to the smooth muscle layer, where it attenuates the initial depolarization. This reduces Ca2+ influx through voltage-gated Ca2+ (VGCC) channels and, consequently, moderates arterial constriction. SK, small-conductance Ca2+-activated K+ channel.
Background.
When arteries constrict to agonists, the endothelium responds in reciprocal fashion to attenuate the initial response. Several mechanisms have been proposed to account for this phenomenon, including the direct movement of signaling molecules among vascular cells (6, 14, 60). Early experiments suggest that second messenger movement from smooth muscle across myoendothelial gap junctions was substantive enough to activate an endothelial transduction sequence with physiological effects (5, 57, 58). Using a conduction paradigm, Yashiro and Duling (6, 61, 62) suggest that when phenylephrine is focally applied, the ensuing depolarization and rise in smooth muscle Ca2+ drive a global increase in endothelial Ca2+ that broadly activates downstream targets, including NOS and/or SK/IK channels. While this is an intriguing idea, functional observations are incomplete and lack supporting structural information. Recent studies have also raised concern with the conduction paradigm, as focal phenylephrine application fails to induce depolarization, a requisite element in the specified feedback response (51). The lack of depolarization reflects the unique nature of a conduction protocol whereby the number of smooth muscle cells generating depolarizing current is substantively smaller than the mass of unstimulated cells to which they are coupled. Under such conditions, the unstimulated cells function as electrical sinks, drawing charge away from the focal site of stimulation (51, 52).
Given these concerns, this study revisited whether second messenger flux across gap junctions was sufficient to activate a Ca2+-dependent effector in the endothelium to elicit a form of electrical feedback. Using a superfusion protocol that ensures the induction of depolarization, as all smooth muscle cells function as charge sources, this investigation began to build a functional case for myoendothelial feedback by defining the Ca2+-dependent targets participating in the response. Consistent with IK and, to a lesser extent, SK channels operating as key effector proteins, TRAM-34 and, to a smaller degree, apamin augmented phenylephrine-induced constriction (Fig. 2). Intraluminal l-NAME did not induce a similar effect, a finding that indicates no significant role for NOS in the specified myoendothelial feedback response, which is in contrast with past studies (6, 47). In support of the vasomotor observations, arterial Vm measurements indicate that SK/IK channel inhibition facilitates the depolarization of phenylephrine-treated arteries (Fig. 3). Mean augmentation was ∼3.5 mV, a result modestly lower than that observed when other feedback mechanisms in smooth muscle [e.g., BK (30, 31) or KV (17) channels] are inhibited. To the best of our knowledge, these are the first electrical observations in vascular smooth muscle in support of the specified form of myoendothelial feedback.
With IK channels defined as the principal downstream effector, the following question arises: Where does the Ca2+ required for activation originate? Past studies employing the problematic conduction paradigm argued that activator Ca2+ originated in smooth muscle and simply diffused to the endothelium in a nontargeted manner (6, 60, 61). While this is an interesting perspective, it is difficult to rationalize given the limited nature of myoendothelial coupling (39), the modest transcellular Ca2+ gradient (32), and active Ca2+ efflux mechanisms (37). A more likely prospect centers on smooth muscle IP3 fluxing across myoendothelial gap junctions to initiate ER Ca2+ release from IP3Rs. If ER and, similarly, the IP3Rs localized to this organelle contribute to myoendothelial feedback, then impairing ER Ca2+ mobilization should enhance phenylephrine-induced constriction. Consistent with this perspective, luminal thapsigargin (a Ca2+-ATPase inhibitor) or 2-APB/xestospongin C (IP3R blockers of variable selectivity) augmented constriction in phenylephrine-treated arteries (Fig. 4). This enhancement was similar to that induced by BAPTA-AM (a Ca2+ chelator) and was discernible during the initial 5–10 min of intraluminal application. In contrast, luminal ryanodine, a plant alkaloid that locks the RyR into a subconductance state, elicited no constrictor effect. This finding indicates that the RyR is not expressed in endothelial cells; a similar conclusion was derived by Ledoux et al. (23). From additional controls, it was noted that xestospongin C-induced constriction was eliminated in vessels pretreated with apamin/TRAM-34, a finding aligned with ER Ca2+ release being sequentially required to target IK/SK channels.
Structural requisites for myoendothelial feedback.
For IP3 to spread from smooth muscle to the endothelium, the two cell layers must contact one another. Myoendothelial contact sites typically consist of an endothelial projection penetrating the IEL, and such structures have been observed in a variety of resistance arteries (11, 36, 40, 42). In this study, similar contact sites were identified in hamster retractor muscle feed arteries and often originated near the nuclei. They also retained ER that resided near the base and extended into the membrane projection (Fig. 5). The ER structures, along with caveoli, were particularly evident in the tomographic reconstructions, a new technique for this investigative field. Although contact sites are essential, key proteins must also localize near these sites to decrease the diffusional distance over which smooth muscle IP3 must spread. To place IP3R and IK channels in or near endothelial projections, we first attempted to map IEL holes and then position proteins within these specified regions (23, 41). Unfortunately, the IEL did not strongly autofluoresce, and when visible, it appeared meshlike; the lack of fluorescence is indicative of limited elastin expression. Consequently, we modified our approach, first marking endothelial and smooth muscle nuclei and then performing immunohistochemistry. Antibodies directed against IP3R1 and IP3R2 gave rise to an endothelium-specific staining pattern (Fig. 6). In detail, IP3R1 more so than IP3R2 displays discrete labeling near endothelial nuclei in a pattern somewhat similar to mesenteric arteries (23). With use of enhanced contrasting and 3-D rendering techniques, punctate IP3R1 staining became more evident between endothelial and smooth muscle nuclei and at times appeared to penetrate the IEL. A similar stepwise approach to IK/SK channels showed that a higher density of KCa3.1 was localized near nuclei and that KCa2.3 labeling was more diffuse and outlined the endothelial cell body (Fig. 7). Enhanced imaging once again emphasized the discrete nature of KCa3.1 labeling between endothelial and smooth muscle nuclei and staining that at times appears to break through the IEL. While the immunofluorescence observations were supportive of IP3R1/KCa3.1 localization to projections, this study did deploy immunogold techniques to provide definitive evidence. Interestingly, this technique nicely highlighted that, in addition to localizing to endothelial projections, IP3R1 and KCa3.1 could be observed outside the structure, a finding distinct from the mesentery (23, 41). Overall, our structural approaches support the idea that IP3R1 and KCa3.1 channels are properly situated to operate as transduction elements in the specified feedback response.
Ca2+ wavelets and myoendothelial feedback.
For IP3 flux via myoendothelial gap junctions to activate IK channels and facilitate negative feedback, it must, by default, induce an endothelial Ca2+ response. In theory, one would expect this Ca2+ response to be spatially and temporally discrete, perhaps something akin to the Ca2+ pulsar (23). Discretization would enable endothelial cells to selectively target downstream effectors (i.e., a pool of IK channels) and, consequently, grade the extent of myoendothelial feedback. Our first attempts to ascertain whether phenylephrine could elicit discrete endothelial Ca2+ responses were performed in pressurized arteries. Under resting conditions, transient wavelike Ca2+ events were notable in ∼40% of endothelial cells, and these spontaneous events fired at ∼0.19 Hz (Fig. 8). While resting cells displayed spontaneous activity, phenylephrine had no discernable effect on the number of cells firing these events or their overall frequency. These Ca2+ events were, however, difficult to monitor, as smooth muscle loaded with fluo 4 dye and endothelial cells routinely moved into and out of the visual plane. Consequently, we began to work with open arteries, and similar to pressurized arteries, ∼40% of endothelial cells fired spontaneous Ca2+ events (Fig. 9). Interestingly, while phenylephrine failed to alter the spontaneous events, it did initiate a second set of agonist-sensitive responses. These new recruitable events had spatial and temporal characteristics similar to the spontaneous Ca2+ events (Fig. 10). Each fired at ∼0.22–0.23 Hz, spread in a wavelike manner over a discrete portion of the endothelial cell (40–50 μm2), and were eliminated by the IP3R inhibitors 2-APB and xestospongin C. Although phenylephrine consistently induced recruitable Ca2+ wavelets, their generation did not globally elevate endothelial Ca2+ concentration. This was expected, as these events were not only spatially and temporally discrete but discernable in only 10–15% of endothelial cells. The absence of a global rise does contrast with past studies, which argued that α-adrenoreceptor agonists elicited a change in endothelial Ca2+ equivalent to acetylcholine (6, 16).
With the successful identification of recruitable Ca2+ wavelets, this study pursued a final set of experiments to tighten the relationship between IP3 flux, discrete Ca2+ signaling, and the induction of endothelial feedback. In particular, we compared the effects of phenylephrine with the effect of 4-AP, a KV channel inhibitor that induces arterial depolarization/constriction independent of IP3 production. If IP3 flux across myoendothelial gap junctions was indeed important, then agents that depolarize and constrict arteries independent of G protein-coupled receptors should not induce the same myoendothelial feedback response. Three key sets of observations are consistent with this overall perspective. 1) Xestospongin C-induced constriction, an indirect index of Ca2+ wavelet activity, was found to be significantly smaller in arteries treated with 4-AP (a Kv channel inhibitor) than phenylephrine (Fig. 11). 2) We observed that, unlike phenylephrine, 4-AP application failed to induce recruitable Ca2+ wavelets. 3) The modest 3-mV depolarization induced by apamin and TRAM-34 in phenylephrine-treated arteries was absent in those exposed to 4-AP (Fig. 12).
In presenting these preceding observations, it is important to acknowledge four general caveats. 1) Our experimental approach focused on presumed outcomes of second messenger movement and did not directly assess transcellular IP3 flux. This approach is not unique to the present investigation and extends to all vascular communication studies irrespective of their interest in IP3, Ca2+, or ionic flux. 2) It is conceivable that a modest degree of smooth muscle Ca2+ flux might be required in conjunction with IP3 to coactivate endothelial IP3Rs. 3) We acknowledge that the manner in which we strictly assessed the prevalence of recruitable Ca2+ wavelets likely underestimates the total number in a given tissue. 4) This study did not attempt to block gap junctions, as there is no definitive evidence that inhibitors are target-selective. If agents were indeed selective, two electrical behaviors would be observed: 1) the endothelial Vm response to acetylcholine and, similarly, the smooth muscle Vm response to phenylephrine should dramatically shift leftward as cellular input resistance increases, and 2) resting Vm would become unstable as the filtering effect of the arterial wall is eliminated.
Conclusion.
We propose that when agonists depolarize and constrict arteries, there is sufficient second messenger flux across myoendothelial gap junctions to initiate an endothelial feedback response (Fig. 13). Contrary to previous studies (6, 60), which focused on transcellular Ca2+ movement, we propose that IP3 flux is essential to initiating this particular form of myoendothelial feedback. More specifically, we argue that this second messenger mobilizes a subpopulation of IP3Rs near endothelial projections, inducing the generation of recruitable Ca2+ wavelets that activate a discrete pool of IK channels. The resulting endothelium-dependent hyperpolarization then conducts back to the smooth muscle layer, where it attenuates, but does not abolish, constrictor tone. Viewed in a broader context, these findings foster questions as to the necessity of myoendothelial feedback, given that KV and BK channels are present in smooth muscle (32–35). We argue that while KV and BK channels do provide substantive negative feedback (1, 50), it may be insufficient under certain physiological conditions (e.g., perivascular nerve activation). In this scenario, KV and BK channels are actively inhibited by neurotransmitters such as epinephrine so as to facilitate the initial arterial depolarization and constriction (25, 26, 29). Future studies are required to ascertain whether vascular diseases such as hypertension and diabetes impair this defined form of feedback. Such a diminishment would be consistent with the “pro” constrictor state of diseased vessels and could arise from a variety of targeted alterations in gap junctional expression, conductance, and/or permeability (35, 50).
GRANTS
This work was principally supported by an operating grant from the Canadian Institute of Health Research (D. G. Welsh), the Heart and Stroke Foundation of Canada (F. Plane), and the National Institutes of Health (M. S. Taylor and N. M. Tsoukias). D. G. Welsh is a senior scholar with Alberta Innovates and holds a Canada Research Chair. C. H. Tran receives stipend support from Alberta Innovates and the Heart and Stroke Foundation of Canada.
DISCLOSURES
No conflicts of interest, financial or otherwise, are declared by the authors.
AUTHOR CONTRIBUTIONS
C.H.T.T., F.P., S.N., N.M.T., E.J.V., M.B., and D.G.W. are responsible for conception and design of the research; C.H.T.T., M.S.T., S.N., V.S., T.F., and M.B. performed the experiments; C.H.T.T., M.S.T., V.S., T.F., and D.G.W. analyzed the data; C.H.T.T., M.S.T., F.P., E.J.V., and D.G.W. interpreted the results of the experiments; C.H.T.T., M.S.T., S.N., N.M.T., V.S., T.F., M.B., and D.G.W. prepared the figures; C.H.T.T. and D.G.W. drafted the manuscript; C.H.T.T., F.P., S.N., N.M.T., E.J.V., and D.G.W. edited and revised the manuscript; C.H.T.T., M.S.T., F.P., S.N., N.M.T., V.S., E.J.V., T.F., M.B., and D.G.W. approved the final version of the manuscript.
Supplementary Material
ACKNOWLEDGMENTS
The authors thank Wei Xiang Dong and Suzanne Brett Welsh for their contributions.
REFERENCES
- 1.Brayden JE, Nelson MT. Regulation of arterial tone by activation of calcium-dependent potassium channels. Science 256: 532–535, 1992 [DOI] [PubMed] [Google Scholar]
- 2.Brown A, Cornwell T, Korniyenko I, Solodushko V, Bond CT, Adelman JP, Taylor MS. Myometrial expression of small conductance Ca2+-activated K+ channels depresses phasic uterine contraction. Am J Physiol Cell Physiol 292: C832–C840, 2007 [DOI] [PubMed] [Google Scholar]
- 3.Chen G, Suzuki H, Weston AH. Acetylcholine releases endothelium-derived hyperpolarizing factor and EDRF from rat blood vessels. Br J Pharmacol 95: 1165–1174, 1988 [DOI] [PMC free article] [PubMed] [Google Scholar]
- 4.Chien S, Lipowsky HH. Correlation of hemodynamics in macrocirculation and microcirculation. Int J Microcirc Clin Exp 1: 351–365, 1982 [PubMed] [Google Scholar]
- 5.Cohen KD, Sarelius IH. Muscle contraction under capillaries in hamster muscle induces arteriolar dilatation via KATP channels and nitric oxide. J Physiol 539: 547–555, 2002 [DOI] [PMC free article] [PubMed] [Google Scholar]
- 6.Dora KA, Doyle MP, Duling BR. Elevation of intracellular calcium in smooth muscle causes endothelial cell generation of NO in arterioles. Proc Natl Acad Sci USA 94: 6529–6534, 1997 [DOI] [PMC free article] [PubMed] [Google Scholar]
- 7.Doughty JM, Plane F, Langton PD. Charybdotoxin and apamin block EDHF in rat mesenteric artery if selectively applied to the endothelium. Am J Physiol Heart Circ Physiol 276: H1107–H1112, 1999 [DOI] [PubMed] [Google Scholar]
- 8.Emerson GG, Segal SS. Endothelial cell pathway for conduction of hyperpolarization and vasodilation along hamster feed artery. Circ Res 86: 94–100, 2000 [DOI] [PubMed] [Google Scholar]
- 9.Emerson GG, Segal SS. Electrical activation of endothelium evokes vasodilation and hyperpolarization along hamster feed arteries. Am J Physiol Heart Circ Physiol 280: H160–H167, 2001 [DOI] [PubMed] [Google Scholar]
- 10.Figueroa XF, Paul DL, Simon AM, Goodenough DA, Day KH, Damon DN, Duling BR. Central role of connexin40 in the propagation of electrically activated vasodilation in mouse cremasteric arterioles in vivo. Circ Res 92: 793–800, 2003 [DOI] [PubMed] [Google Scholar]
- 11.Hill CE, Rummery N, Hickey H, Sandow SL. Heterogeneity in the distribution of vascular gap junctions and connexins: implications for function. Clin Exp Pharmacol Physiol 29: 620–625, 2002 [DOI] [PubMed] [Google Scholar]
- 12.Isakson BE. Localized expression of an Ins(1,4,5)P3 receptor at the myoendothelial junction selectively regulates heterocellular Ca2+ communication. J Cell Sci 121: 3664–3673, 2008 [DOI] [PMC free article] [PubMed] [Google Scholar]
- 13.Isakson BE, Evans WH, Boitano S. Intercellular Ca2+ signaling in alveolar epithelial cells through gap junctions and by extracellular ATP. Am J Physiol Lung Cell Mol Physiol 280: L221–L228, 2001 [DOI] [PubMed] [Google Scholar]
- 14.Isakson BE, Ramos SI, Duling BR. Ca2+ and inositol 1,4,5-trisphosphate-mediated signaling across the myoendothelial junction. Circ Res 100: 246–254, 2007 [DOI] [PubMed] [Google Scholar]
- 15.Jackson WF, Boerman EM, Lange EJ, Lundback SS, Cohen KD. Smooth muscle α1D-adrenoceptors mediate phenylephrine-induced vasoconstriction and increases in endothelial cell Ca2+ in hamster cremaster arterioles. Br J Pharmacol 155: 514–524, 2008 [DOI] [PMC free article] [PubMed] [Google Scholar]
- 16.Kansui Y, Garland CJ, Dora KA. Enhanced spontaneous Ca2+ events in endothelial cells reflect signalling through myoendothelial gap junctions in pressurized mesenteric arteries. Cell Calcium 44: 135–146, 2008 [DOI] [PMC free article] [PubMed] [Google Scholar]
- 17.Knot HJ, Nelson MT. Regulation of membrane potential and diameter by voltage-dependent K+ channels in rabbit myogenic cerebral arteries. Am J Physiol Heart Circ Physiol 269: H348–H355, 1995 [DOI] [PubMed] [Google Scholar]
- 18.Kremer JR, Mastronarde DN, McIntosh JR. Computer visualization of three-dimensional image data using IMOD. J Struct Biol 116: 71–76, 1996 [DOI] [PubMed] [Google Scholar]
- 19.Kurata WE, Lau AF. p130gag-fps disrupts gap junctional communication and induces phosphorylation of connexin43 in a manner similar to that of pp60v-src. Oncogene 9: 329–335, 1994 [PubMed] [Google Scholar]
- 20.Lamboley M, Pittet P, Koenigsberger M, Sauser R, Beny JL, Meister JJ. Evidence for signaling via gap junctions from smooth muscle to endothelial cells in rat mesenteric arteries: possible implication of a second messenger. Cell Calcium 37: 311–320, 2005 [DOI] [PubMed] [Google Scholar]
- 21.Lampe PD, Lau AF. Regulation of gap junctions by phosphorylation of connexins. Arch Biochem Biophys 384: 205–215, 2000 [DOI] [PubMed] [Google Scholar]
- 22.Ledoux J, Bonev AD, Nelson MT. Ca2+-activated K+ channels in murine endothelial cells: block by intracellular calcium and magnesium. J Gen Physiol 131: 125–135, 2008 [DOI] [PMC free article] [PubMed] [Google Scholar]
- 23.Ledoux J, Taylor MS, Bonev AD, Hannah RM, Solodushko V, Shui B, Tallini Y, Kotlikoff MI, Nelson MT. Functional architecture of inositol 1,4,5-trisphosphate signaling in restricted spaces of myoendothelial projections. Proc Natl Acad Sci USA 105: 9627–9632, 2008 [DOI] [PMC free article] [PubMed] [Google Scholar]
- 24.Little TL, Xia J, Duling BR. Dye tracers define differential endothelial and smooth muscle coupling patterns within the arteriolar wall. Circ Res 76: 498–504, 1995 [DOI] [PubMed] [Google Scholar]
- 25.Luykenaar KD, Brett SE, Wu BN, Wiehler WB, Welsh DG. Pyrimidine nucleotides suppress KDR currents and depolarize rat cerebral arteries by activating Rho kinase. Am J Physiol Heart Circ Physiol 286: H1088–H1100, 2004 [DOI] [PubMed] [Google Scholar]
- 26.Luykenaar KD, El-Rahman RA, Walsh MP, Welsh DG. Rho-kinase-mediated suppression of KDR current in cerebral arteries requires an intact actin cytoskeleton. Am J Physiol Heart Circ Physiol 296: H917–H926, 2009 [DOI] [PMC free article] [PubMed] [Google Scholar]
- 27.Mastronarde DN. Dual-axis tomography: an approach with alignment methods that preserve resolution. J Struct Biol 120: 343–352, 1997 [DOI] [PubMed] [Google Scholar]
- 28.Mastronarde DN. Automated electron microscope tomography using robust prediction of specimen movements. J Struct Biol 152: 36–51, 2005 [DOI] [PubMed] [Google Scholar]
- 29.Minami K, Hirata Y, Tokumura A, Nakaya Y, Fukuzawa K. Protein kinase C-independent inhibition of the Ca2+-activated K+ channel by angiotensin II and endothelin-1. Biochem Pharmacol 49: 1051–1056, 1995 [DOI] [PubMed] [Google Scholar]
- 30.Nelson MT, Brayden JE. Regulation of arterial tone by calcium-dependent K+ channels and ATP-sensitive K+ channels. Cardiovasc Drugs Ther 7 Suppl 3: 605–610, 1993 [DOI] [PubMed] [Google Scholar]
- 31.Nelson MT, Cheng H, Rubart M, Santana LF, Bonev AD, Knot HJ, Lederer WJ. Relaxation of arterial smooth muscle by calcium sparks. Science 270: 633–637, 1995 [DOI] [PubMed] [Google Scholar]
- 32.Nelson MT, Quayle JM. Physiological roles and properties of potassium channels in arterial smooth muscle. Am J Physiol Cell Physiol 268: C799–C822, 1995 [DOI] [PubMed] [Google Scholar]
- 33.Perez GJ, Bonev AD, Patlak JB, Nelson MT. Functional coupling of ryanodine receptors to KCa channels in smooth muscle cells from rat cerebral arteries. J Gen Physiol 113: 229–238, 1999 [DOI] [PMC free article] [PubMed] [Google Scholar]
- 34.Pozo MJ, Perez GJ, Nelson MT, Mawe GM. Ca2+ sparks and BK currents in gallbladder myocytes: role in CCK-induced response. Am J Physiol Gastrointest Liver Physiol 282: G165–G174, 2002 [DOI] [PubMed] [Google Scholar]
- 35.Prior HM, Yates MS, Beech DJ. Functions of large conductance Ca2+-activated (BKCa), delayed rectifier (KV) and background K+ channels in the control of membrane potential in rabbit renal arcuate artery. J Physiol 511: 159–169, 1998 [DOI] [PMC free article] [PubMed] [Google Scholar]
- 36.Saez JC, Berthoud VM, Branes MC, Martinez AD, Beyer EC. Plasma membrane channels formed by connexins: their regulation and functions. Physiol Rev 83: 1359–1400, 2003 [DOI] [PubMed] [Google Scholar]
- 37.Sage SO, van BC, Cannell MB. Sodium-calcium exchange in cultured bovine pulmonary artery endothelial cells. J Physiol 440: 569–580, 1991 [DOI] [PMC free article] [PubMed] [Google Scholar]
- 38.Sanderson MJ, Charles AC, Boitano S, Dirksen ER. Mechanisms and function of intercellular calcium signaling. Mol Cell Endocrinol 98: 173–187, 1994 [DOI] [PubMed] [Google Scholar]
- 39.Sandow SL, Hill CE. Incidence of myoendothelial gap junctions in the proximal and distal mesenteric arteries of the rat is suggestive of a role in endothelium-derived hyperpolarizing factor-mediated responses. Circ Res 86: 341–346, 2000 [DOI] [PubMed] [Google Scholar]
- 40.Sandow SL, Looft-Wilson R, Doran B, Grayson TH, Segal SS, Hill CE. Expression of homocellular and heterocellular gap junctions in hamster arterioles and feed arteries. Cardiovasc Res 60: 643–653, 2003 [DOI] [PubMed] [Google Scholar]
- 41.Sandow SL, Neylon CB, Chen MX, Garland CJ. Spatial separation of endothelial small- and intermediate-conductance calcium-activated potassium channels (KCa) and connexins: possible relationship to vasodilator function? J Anat 209: 689–698, 2006 [DOI] [PMC free article] [PubMed] [Google Scholar]
- 42.Sandow SL, Tare M, Coleman HA, Hill CE, Parkington HC. Involvement of myoendothelial gap junctions in the actions of endothelium-derived hyperpolarizing factor. Circ Res 90: 1108–1113, 2002 [DOI] [PubMed] [Google Scholar]
- 43.Segal SS. Regulation of blood flow in the microcirculation. Microcirculation 12: 33–45, 2005 [DOI] [PubMed] [Google Scholar]
- 44.Segal SS, Beny JL. Intracellular recording and dye transfer in arterioles during blood flow control. Am J Physiol Heart Circ Physiol 263: H1–H7, 1992 [DOI] [PubMed] [Google Scholar]
- 45.Segal SS, Welsh DG, Kurjiaka DT. Spread of vasodilatation and vasoconstriction along feed arteries and arterioles of hamster skeletal muscle. J Physiol 516: 283–291, 1999 [DOI] [PMC free article] [PubMed] [Google Scholar]
- 46.Smith JS, Imagawa T, Ma J, Fill M, Campbell KP, Coronado R. Purified ryanodine receptor from rabbit skeletal muscle is the calcium-release channel of sarcoplasmic reticulum. J Gen Physiol 92: 1–26, 1988 [DOI] [PMC free article] [PubMed] [Google Scholar]
- 47.Straub AC, Billaud M, Johnstone SR, Best AK, Yemen S, Dwyer ST, Looft-Wilson R, Lysiak JJ, Gaston B, Palmer L, Isakson BE. Compartmentalized connexin 43 S-nitrosylation/denitrosylation regulates heterocellular communication in the vessel wall. Arterioscler Thromb Vasc Biol 31: 399–407, 2011 [DOI] [PMC free article] [PubMed] [Google Scholar]
- 48.Tallini YN, Brekke JF, Shui B, Doran R, Hwang SM, Nakai J, Salama G, Segal SS, Kotlikoff MI. Propagated endothelial Ca2+ waves and arteriolar dilation in vivo: measurements in Cx40BAC GCaMP2 transgenic mice. Circ Res 101: 1300–1309, 2007 [DOI] [PubMed] [Google Scholar]
- 49.Taylor MS, Bonev AD, Gross TP, Eckman DM, Brayden JE, Bond CT, Adelman JP, Nelson MT. Altered expression of small-conductance Ca2+-activated K+ (SK3) channels modulates arterial tone and blood pressure. Circ Res 93: 124–131, 2003 [DOI] [PubMed] [Google Scholar]
- 50.Thorneloe KS, Nelson MT. Ion channels in smooth muscle: regulators of intracellular calcium and contractility. Can J Physiol Pharmacol 83: 215–242, 2005 [DOI] [PubMed] [Google Scholar]
- 51.Tran CH, Vigmond EJ, Plane F, Welsh DG. Mechanistic basis of differential conduction in skeletal muscle arteries. J Physiol 587: 1301–1318, 2009 [DOI] [PMC free article] [PubMed] [Google Scholar]
- 52.Tran CH, Welsh DG. The differential hypothesis: a provocative rationalization of the conducted vasomotor response. Microcirculation 17: 226–236, 2010 [DOI] [PubMed] [Google Scholar]
- 53.Uhrenholt TR, Domeier TL, Segal SS. Resolution of Ca2+ dynamics underlying conducted vasodilation: the Ca2+ wave (Abstract). FASEB J 20: A277, 2006 [Google Scholar]
- 54.Uhrenholt TR, Domeier TL, Segal SS. Propagation of calcium waves along endothelium of hamster feed arteries. Am J Physiol Heart Circ Physiol 292: H1634–H1640, 2007 [DOI] [PubMed] [Google Scholar]
- 55.Welsh DG, Segal SS. Muscle length directs sympathetic nerve activity and vasomotor tone in resistance vessels of hamster retractor. Circ Res 79: 551–559, 1996 [DOI] [PubMed] [Google Scholar]
- 56.West WT. Histologic study of living striated muscle fibers in situ in the cheek pouch of the golden hamster. Am J Anat 103: 349–373, 1958 [DOI] [PubMed] [Google Scholar]
- 57.Wilkerson MK, Heppner TJ, Bonev AD, Nelson MT. Inositol trisphosphate receptor calcium release is required for cerebral artery smooth muscle cell proliferation. Am J Physiol Heart Circ Physiol 290: H240–H247, 2006 [DOI] [PubMed] [Google Scholar]
- 58.Xi Q, Adebiyi A, Zhao G, Chapman KE, Waters CM, Hassid A, Jaggar JH. IP3 constricts cerebral arteries via IP3 receptor-mediated TRPC3 channel activation and independently of sarcoplasmic reticulum Ca2+ release. Circ Res 102: 1118–1126, 2008 [DOI] [PMC free article] [PubMed] [Google Scholar]
- 59.Xia J, Little TL, Duling BR. Cellular pathways of the conducted electrical response in arterioles of hamster cheek pouch in vitro. Am J Physiol Heart Circ Physiol 269: H2031–H2038, 1995 [DOI] [PubMed] [Google Scholar]
- 60.Yashiro Y, Duling BR. Integrated Ca2+ signaling between smooth muscle and endothelium of resistance vessels. Circ Res 87: 1048–1054, 2000 [DOI] [PubMed] [Google Scholar]
- 61.Yashiro Y, Duling BR. Participation of intracellular Ca2+ stores in arteriolar conducted responses. Am J Physiol Heart Circ Physiol 285: H65–H73, 2003 [DOI] [PubMed] [Google Scholar]
- 62.Yeh HI, Rothery S, Dupont E, Coppen SR, Severs NJ. Individual gap junction plaques contain multiple connexins in arterial endothelium. Circ Res 83: 1248–1263, 1998 [DOI] [PubMed] [Google Scholar]
- 63.Zweifach BW. The microcirculation in experimental hypertension. Hypertension 5: I10–I16, 1983 [DOI] [PubMed] [Google Scholar]
Associated Data
This section collects any data citations, data availability statements, or supplementary materials included in this article.


