Abstract
The knowledge of molecular control mechanisms underlying the basal tone in the intact human internal anal sphincter (IAS) is critical for the pathophysiology and rational therapy for a number of debilitating rectoanal motility disorders. We determined the role of RhoA/ROCK and PKC pathways by comparing the effects of ROCK- and PKC-selective inhibitors Y 27632 and Gö 6850 (10−8 to 10−4 M), respectively, on the basal tone in the IAS vs. the rectal smooth muscle (RSM). Western blot studies were performed to determine the levels of RhoA/ROCK II, PKC-α, MYPT1, CPI-17, and MLC20 in the unphosphorylated and phosphorylated forms, in the IAS vs. RSM. Confocal microscopic studies validated the membrane distribution of ROCK II. Finally, to confirm a direct relationship, we examined the enzymatic activities and changes in the basal IAS tone and p-MYPT1, p-CPI-17, and p-MLC20, before and after Y 27632 and Gö 6850. Data show higher levels of RhoA/ROCK II and related downstream signal transduction proteins in the IAS vs. RSM. In addition, data show a significant correlation between the active RhoA/ROCK levels, ROCK enzymatic activity, downstream proteins, and basal IAS tone, before and after ROCK inhibitor. From these data we conclude 1) RhoA/ROCK and downstream signaling are constitutively active in the IAS, and this pathway (in contrast with PKC) is the critical determinant of the basal tone in intact human IAS; and 2) RhoA and ROCK are potential therapeutic targets for a number of rectoanal motility disorders for which currently there is no satisfactory treatment.
Keywords: smooth muscle tone, Rho kinase, rectoanal incontinence
although multifactorial, the basal tone in the IAS plays an important role in rectoanal incontinence (3, 24). It has been shown before that the basal tone in the IAS in different species including humans is primarily myogenic in nature (2, 5, 7, 17, 25), because of the characteristic properties of the IAS smooth muscle cells (SMCs) (7, 23, 25). Knowledge of molecular determinants of basal tone in the IAS is critical for treating a number of rectoanal motility disorders such as fecal incontinence, Hirschsprung's disease, recurrent anal fissures, and hemorrhoids (3, 17).
Mechanisms underlying the agonists-induced sustained contraction of intestinal smooth muscle involve prolonged myosin light chain (MLC20) phosphorylation (p-MLC20), the phosphorylation of cytoskeleton filaments and associated proteins, increase in Ca2+ influx, and Ca2+ sensitization (19). It is well known that RhoA/ROCK and PKC play a significant role in this regard. In the phasic contraction, p-MLC20 is rapidly dephosphorylated via myosin light chain phosphatase (MLCP). In the sustained contraction, on the other hand, this dephosphorylation is prevented or delayed primarily via MLCP inhibition by RhoA/ROCK and PKC pathways. These pathways do so primarily via the phosphorylation of regulatory binding subunit of MLCP (MYPT1), the catalytic subunit (PP1cδ) of MLCP, and protein kinase C-potentiated inhibitor or phosphoprotein for myosin phosphatase (CPI-17), the endogenous inhibitory protein of MLCP (8, 14, 19, 26). Our previous studies in rats have shown that, in the basal state under similar concentrations of Ca2+, the IAS develops steady tone whereas the rectal smooth muscle (RSM) does not (28).
Recent studies in rat IAS have shown that the renin-angiotensin system and sPLA2/AA/COX-1 via the generation of ANG II and thromboxanes and PGF2α within the IAS smooth muscle cells (SMCs), respectively, may provide an external trigger (9–11). Additionally, the animal data suggest a critical role of RhoA/ROCK for the basal IAS tone at the intracellular level (22, 23, 28) compared with the phasic activities in the RSM and anococcygeus (ASM) smooth muscles. According to those studies, the IAS has characteristically higher levels of p-MYPT1, CPI-17, p-CPI-17, and p-MLC20. Additionally, in contrast with the RSM and ASM, the IAS has lower levels of MYPT1. Furthermore, the ROCK inhibitor Y 27632 caused more potent decrease in the tonic activity of the IAS than the phasic activity in the RSM and ASM. Also, active ROCK II compared with PKC was found to be more potent in causing IAS SMC contraction (23).
The previous studies, however, did not examine the role of RhoA/ROCK in the intact human IAS. Furthermore, none of the earlier studies examined the relative contribution of RhoA/ROCK vs. PKC pathways in the IAS tone.
Among the two major isozymes of ROCK (ROCK I and ROCK II), ROCK II is the most relevant in the sustained smooth muscle contraction (26, 36, 38). Broadly, PKC isozymes have been classified as Ca2+ dependent (α, β1, β2, and γ) and Ca2+ independent (δ, ϵ, ζ, and η) (18, 19). Accordingly, agents like Gö 6850 in the lower concentrations selectively block Ca2+-independent PKC isozymes; however, in micromolar concentration range they block all PKC isozymes with rank order of potency against as α > β1 > ϵ > ζ > η. Calphostin C, on the other hand, is considered to be broad spectrum PKC inhibitor. It is of interest that among different PKC isozymes, PKC-α is most important in the sustained tone in the smooth muscles (1, 12, 19, 34).
The purpose of the present investigation therefore was to determine the molecular control mechanisms for the basal tone in the intact human IAS and to determine the relative contribution of RhoA/ROCK vs. PKC pathways in the basal tone in intact human IAS. In addition, the studies compared the RhoA/ROCK and PKC molecular machinery in the IAS vs. the RSM. We used a multipronged approach to determine the relative expressions of RhoA/ROCK and PKC signal transduction proteins as such and in the active forms, the actual enzymatic activities, and gene expressions, in relation to the basal IAS tone before and after the selective inhibitors.
MATERIALS AND METHODS
Tissue preparation and measurement of isometric tension.
IAS and RSM tissues were obtained as discarded human tissues via the departments of Surgery and Pathology of Thomas Jefferson University. The studies were approved by the institutional review board. By sharp dissection, the smooth muscle strips (∼1 × 7 mm) from the circular smooth muscle layer of the IAS and RSM were prepared for the recording of isometric tension in organ baths containing oxygenated Krebs physiological solution (KPS) at 37°C, as described before (33). The composition of KPS was as follows (in mM): 118.07 NaCl, 4.69 KCl, 2.52 CaCl2, 1.16 MgSO4, 1.01 NaH2PO4, 25 NaHCO3, and 11.10 glucose. The smooth muscle strips prepared above were anchored to the lower end of the 2-ml organ bath and the upper end was tied to the force transducers (FORT10; WPI, Sarasota, FL) for the recording of the isometric tension. The smooth muscle strips were initially stretched to 1 g of tension and allowed to equilibrate in the organ bath containing oxygenated KPS, for at least 1 h for the development of steady-state spontaneous tone. All data were recorded by using the computerized PowerLab/8SP data-acquisition system and Chart 4.1.2 (AD Instruments, Colorado Springs, CO). Responses to electrical field stimulation (EFS; 0.25–10 Hz, 0.5-ms pulse, 10 V, 4-s train) were investigated under nonadrenergic, noncholinergic (NANC) conditions in the presence of atropine and guanethidine (1 × 10⁻⁶ M), before and after neurotoxin tetrodotoxin (TTX; 1 × 10⁻⁶ M). All inhibitory effects in the IAS in response to EFS and ROCK (Y 27632) and PKC (Gö 6850 and calphostin C) inhibitors in the concentration range of 10−8 M to 10−4 M were expressed as percent maximal relaxation with 0 Ca2+ in KPS at the end of each experiment (4, 6).
Western blot studies.
The smooth muscle strips were flash frozen by using Wollenberger's clamp precooled in liquid N2 for the protein lysates preparation to determine the total levels of RhoA, ROCK II, PKC-α, CPI-17, MYPT1, and MLC20 in the unphosphorylated and phosphorylated states, in the basal state, and after the peak responses to the inhibitors. The flash-frozen tissues were cut in small pieces (1-mm cubes) and rapidly homogenized as described before (22) on ice in five volumes of lysis buffer (1% SDS, 1.0 mM sodium orthovanadate, and 50 mM Tris, pH 7.4, 1 mM EDTA); protease and phosphatase inhibitor cocktails (Pierce, Rockford, IL) were added in the buffer before homogenization. The homogenates were centrifuged (16,000 g at 4°C) for 15 min, and protein contents in the resultant supernatant were determined by using a BCA kit from Pierce with bovine serum albumin as the standard. The samples were then mixed with 2× sample buffer (125 mM Tris, pH 6.8, 4% SDS, 10% glycerol, 0.006% bromophenol blue, and 2% β-mercaptoethanol) and placed in a boiling water bath for 3 min. The proteins in an aliquot (20 μl containing 30 μg of protein extract) of each sample were separated by 7.5% SDS-polyacrylamide gel (for PKC-α, ROCK II, pThr696-MYPT1, and total MYPT1) and 12% (RhoA, pThr38-CPI-17 and total CPI-17, pThr18/Ser19-MLC20 and total MLC20). The proteins thus separated were transferred to a polyvinylidene fluoride (PVDF) membrane by using Iblot (Invitrogen, Carlsbad, CA) for 13 min.
To determine the relative distribution of PKC-α, RhoA, ROCK II, pThr696-MYPT1, pThr38-CPI-17, and p-MLC20 in membrane vs. the cytosol, the IAS and RSM tissue strips after the development of steady basal tone were flash frozen as explained above, before and after the maximal effects of the inhibitors. The frozen tissues were homogenized in ice-cold homogenization buffer (10 mM Tris, pH 7.5, 5 mM MgCl2, 2 mM EDTA, 250 mM sucrose, and 1 mM dithiothreitol). The homogenates were centrifuged at 100,000 g for 30 min at 4°C (Beckman L8–70M Ultracentrifuge; Beckman Coulter, Fullerton, CA). The supernatants were then transferred to a fresh tube and used as the cytosolic fraction. The pellets were resuspended and homogenized in buffer containing 1% Triton X-100. The pellet extract was centrifuged at 800 g for 10 min, and the supernatant was collected as the particulate fraction (13). The proteins were run on the polyacrylamide gel and transferred on PVDF membrane as explained above.
The membranes were subjected to antibody staining as follows: To block nonspecific antibody binding, the PVDF membranes were soaked in Odyssey blocking buffer (LI-COR Biotechnology, Lincoln, NE) for 1 h at room temperature. The membranes were then incubated overnight in respective primary antibodies (PKC-α, RhoA, ROCK II, pThr696-MYPT1, pThr38-CPI-17, and pThr18/Ser19-MLC20) at 4°C with continuous shaking, in Odyssey blocking buffer containing 0.2% Tween. The membranes were washed thrice for 10 min each with PBS with 0.2% Tween and incubated with (IRdye) conjugated secondary antibodies for 1 h and the membranes were scanned with an Odyssey infrared scanner. Western blot band intensities of different proteins were calculated as ratios of α-actin, MLC20, or CPI-17, as the case may be, with Image J 1.41o (National Institutes of Health, Bethesda, MD).
Isolation of SMC for effects of ROCK and PKC inhibitors.
The SMCs from the IAS and RSM were isolated by a previously described method (27, 32) using sequential enzymatic digestion, filtration, and centrifugation. Briefly, the smooth muscle tissues cut into 0.2 × 0.2 mm blocks were incubated in filtered (0.22-μm filter) KPS containing 0.1% collagenase and 0.01% trypsin inhibitor. The partly digested strips were washed, and SMCs were allowed to disperse spontaneously for 30 min. SMC were then harvested by filtration through 500 μM Nitex mesh and centrifuged twice at 350 g for 10 min. The cells were cultured in 10 cm plates in DMEM containing 10% fetal bovine serum 5% penicillin-streptomycin, 50 μg/ml gentamicin, and 2 μg/ml amphotericin B until they attained confluence and were then passaged once.
The effects of Gö 6850, calphostin C, or Y 27632 (10−6 and 10−5 M) on cell lengths were measured as described before (28). The reaction was interrupted at 15 min by 1% acrolein. The cell lengths were measured by computerized image microscopy. The average length of cells in control and following the test agents were obtained from 50 cells at random to determine percent increase in cell lengths compared with the controls.
Immunofluorescence.
The cells isolated above were fixed with 4% paraformaldehyde for 15 min and washed with PBS for three times. These cells were kept in blocking buffer (PBS containing 0.5% FBS and 0.2% Triton X-100) for 15 min, followed by their incubation in primary antibodies (1:100 dilution in PBS containing 0.5% FBS and 0.2% Triton) for PKC-α, RhoA, and ROCK II (Santa Cruz Biotechnology, Santa Cruz, CA) for overnight at 4°C in humid chamber. The cells were then stained with Texas red (TR) (for RhoA and ROCK II) and fluorescein isothiocyanate (FITC)-conjugated secondary antibodies (for PKC-α) (1:200 dilution) and with 4′,6-diamidino-2-phenylindole (DAPI) nucleic acid staining as described before (32). The confocal microscopic images were acquired by using a Carl Zeiss LSM 510 UV META inverted confocal microscope (Carl Zeiss Microimaging, Thornwood, NY) with a Plan-Apo ×40 oil immersion lens at room temperature and Zeiss AIM 4.2 SP1 software. The images were analyzed by use of MetaMorph v7.6.5 (Bioimaging Facility of the Kimmel Cancer Center, Thomas Jefferson University). Immunofluorescence intensities of RhoA/ROCK II and PKC-α in the membrane vs. cytosol of the SMCs were calculated as described before (32).
RT-PCR analyses.
Total RNAs were isolated from IAS and RSM tissues frozen in liquid N2 with TRI reagent, and concentrations were measured by using Nanodrop via 260/280 and 260/230 ratios. One microgram of RNA was reverse transcribed by using the Sensiscript RT kit (Qiagen, Valencia, CA) and RhoA, ROCK II, MYPT1, PP1cδ, CPI-17, MLC20, and β-actin, and their cDNAs were amplified by using gene-specific forward and backward primers, respectively, as follows: CAGCAAGGACCAGTTCCCAGA, TGCCATATCTCTGCCTTCTTCAGG; AACGTCAGGATGCAGATGGGCAAATG, GCTCTCTTCAGCTATTTGTGCCTGCA; GCATCCCGTATTGAATCTCTGGAACAA, CCCTAACAGGAGTGAGGTATGATCT; GTGGACAGAGGAAAGCAGTCTTTGG, ATCTTCCACCACCTGATGAGCTCG; TCAAGTATGACCGGCGGGAGCT, CAGCTCCTGGATGAAGTCCTCGA; TTCAAAGAGGCCTTCAACATGATTGATC, CTCATCCACTTCCTCATCCGTAAACT; TGTTTGAGACCTTCAACACCCC, ACGTCACACTTCATGATGGAGTTG.
PCR reactions were carried out with GoTaq Green Master Mix (Promega), using an Eppendorf Mastercycler personal (Fisher, Allentown, PA). The PCR cycle consisted of 94°C for 5 min, 94°C for 30 s (denaturation phase), 60°C for 30 s (annealing phase), and 72°C for 1 min (elongation phase), repeated for 30 cycles. The process was terminated by a final extension at 72°C for 5 min.
ROCK and PKC activity assays.
For ROCK activity assay, tissue lysates were mixed with 30 μM S6 kinase substrate peptide (AKRRRLSSLRA) (Upstate, Lake Placid, NY), followed by the addition of 10 μCi of [γ-32P]ATP (3,000 Ci/mmol) (Amersham Biosciences, Piscataway, NJ) and 100 μM ATP, and incubated for 10 min at 30°C. [32P]substrate peptide was absorbed onto P81 Whatman phosphocellulose discs (Fisher), and free radioactivity was removed by repeated washings with 75 mM phosphoric acid. The amount of radioactivity on the discs was measured and results were expressed in the basal state, and as percentage decrease in activity with the inhibitors as explained before (20, 22). For PKC activity assay, the procedure was basically the same except that in the initial stages it involved the use of 80 μM PKC substrate peptide [QKRPSQRSKYL] (Upstate), 0.1 mg/ml phosphatidyl serine and 0.01 mg/ml diacylglycerol.
Drug responses and statistical analysis.
Concentration-response curves (10−8 to 10−4 M) with Gö 6850 and calphostin C (PKC inhibitors) and Y 27632 (Rho kinase or ROCK inhibitor) were constructed on cumulative basis as described before (28). In some experiments, the maximal decrease in the IAS tone with one of these inhibitors was clamped followed by the determination of the effect of the other inhibitor. Such protocol allowed determining the overlap of the inhibitors' effect, if any, and the relative contribution of RhoA/ROCK and PKC pathways. Responses to these inhibitors were also determined in the isolated SMC of the IAS vs. the RSM, as described before (28). Data were calculated as means ± SE and graphed with GraphPad Prism 5 (La Jolla, CA), and statistical significance between different groups was determined by analysis of variance and by unpaired t-test and were considered significant with a P value smaller than 0.05. Coefficient of correlation r were calculated via GraphPad by linear regression analysis.
Drugs and chemicals.
Sources of different drugs and chemicals were as follows: calphostin C, TTX, NG-nitro-l-arginine, and MLC20 antibody (Sigma Aldrich, St. Louis, MO); Gö 6850 and Y 27632 (Tocris, Ellisville, MO); primary antibodies against PKC-α, RhoA, ROCK II, pThr696-MYPT1, CPI-17, pThr38-CPI-17, and pThr18/Ser19-MLC20 and TR- and FITC-labeled secondary antibodies (Santa Cruz Biotechnology); IRDye800-conjugated secondary antibody (LI-COR Biotechnology); and primers for RT-PCR (Integrated DNA Technologies, Coralville, IA).
RESULTS
Basal tone in IAS vs. RSM, and effect of EFS.
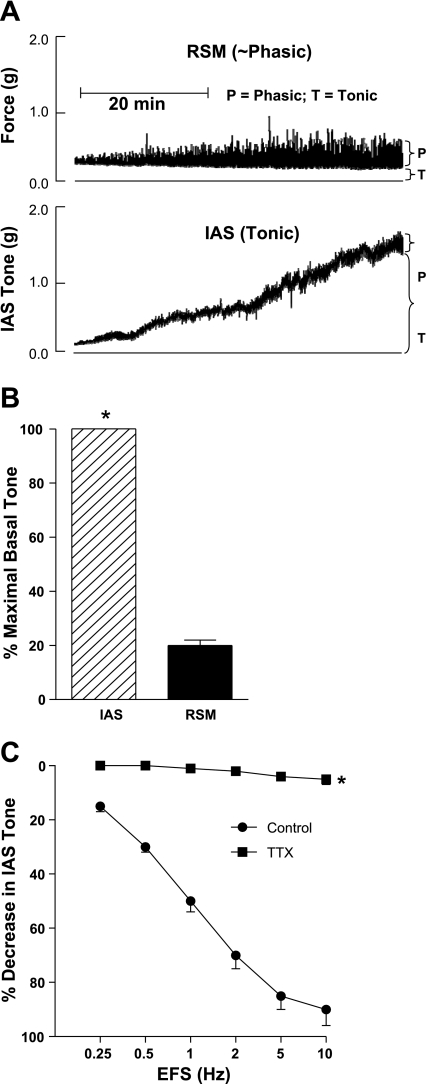
Typical tracings of the force measurements from the smooth muscle strips from the RSM and IAS (Fig. 1A) are quantified in Fig. 1B. Data show that the IAS developed significantly higher level of basal tone than the RSM (1.27 ± 0.32 vs. 0.23 ± 0.05 g, respectively; *P < 0.05; n = 6 to 8; Fig. 1B). EFS caused frequency-dependent (0.25 to 10 Hz; 10 V; 4-s train, each pulse of 0.5 ms; Fig. 1C) relaxation of the IAS, and neurotoxin TTX (10−6 M) obliterated these relaxation responses. However, not shown, the neurotoxin had no significant effect on the basal tone in human IAS. These data suggest that in vitro the basal tone in the IAS is primarily myogenic in nature.
Fig. 1.
A: actual tracings show the development of spontaneous and steady basal tone in the smooth muscles of the human internal anal sphincter (IAS) vs. rectal smooth muscle (RSM); the latter primarily has phasic activity. B: bar graph data show significantly higher basal tone in the IAS vs. the RSM (*P < 0.05; n = 6–8). C: quantitative data show that electrical field stimulation (EFS) causes frequency-dependent relaxation of the IAS that is obliterated by the neurotoxin TTX (10−6 M).
Relative expression of RhoA/ROCK II, PKC-α, and downstream signal transduction proteins in the RSM vs. IAS, in the basal state.
The Western blot data showed that the IAS had significantly higher levels of expression of RhoA, ROCK II and pThr696-MYPT1, pThr38-CPI-17, and p-MLC20 than the RSM (*P < 0.05; n = 4 to 5; Fig. 2). Characteristically, in contrast with the other signal transduction proteins examined here, unphosphorylated MYPT1 levels were significantly lower in the IAS vs. the RSM tissues (*P < 0.05). MYPT1 is the myosin-binding subunit of MLCP responsible for the dephosphorylation of p-MLC20; CPI-17 on the other hand serves as an endogenous inhibitor of MLCP. These factors and higher levels of other molecular proteins examined here may lead to the higher levels of p-MLC20 and thus the sustained basal tone in the IAS. It is of further interest that, although CPI-17 by itself is capable of inhibiting MLCP, it is >1,000 times more potent in the phosphorylated form (16).
Fig. 2.
Western blot data showing higher levels of expression of RhoA/ROCK II (A and B), phosphorylation of regulatory binding subunit of myosin light chain phosphatase (p-MYPT1; D), phosphorylated protein kinase C-potentiated inhibitor or phosphoprotein for myosin phosphatase (p-CPI-17; E), and myosin light chain phosphorylation (p-MLC20; F) and decreased expression of MYPT1 (C) in the smooth muscle tissues of the IAS compared with the RSM (*P < 0.05).
Relative expression of active RhoA/ROCK II and PKC-α and their downstream targets in IAS vs. RSM, in the particulate vs. cytosolic fractions, in the basal state.
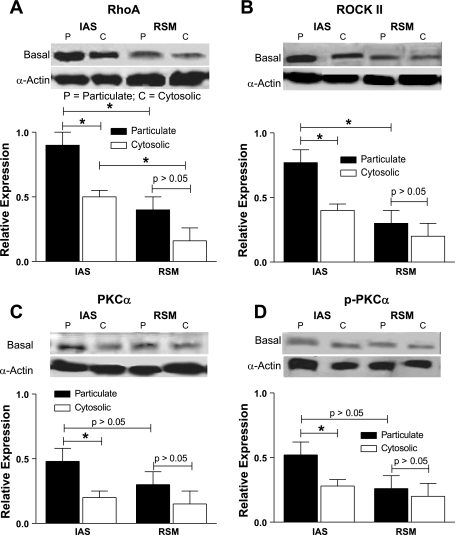
Present data showed significantly higher levels of expression of RhoA/ROCK II in the particulate vs. the cytosolic fractions of the IAS smooth muscles (*P < 0.05; n = 4; Fig. 3, A and B). In addition, RhoA levels were significantly higher in the particulate and cytosolic fractions of the IAS compared with the RSM (*P < 0.05). The expression of PKC-α and p-PKC-α in the particulate fractions of the IAS, although higher, was significantly less pronounced than that of RhoA/ROCK II (Fig. 3, C and D). Data suggest constitutively active nature of RhoA/ROCK II in the IAS that may be responsible for the basal tone. The exact role of higher levels of PKC-α in the membrane, and its possible interaction with RhoA/ROCK, however, remain to be determined.
Fig. 3.
Western blot data showing significantly higher levels of expressions of RhoA/ROCK II, PKC-α, and phosphorylated PKC-α (p-PKC-α) (A–D) in the smooth muscle tissues of the IAS vs. RSM, especially in the particulate fractions, in the basal state (*P < 0.05). In addition, RhoA levels are higher in the cytosolic fractions of the IAS vs. the RSM (*P < 0.05). The significance of the latter observations remains to be determined. The levels of PKC-α (C) and p-PKC-α (D), although higher, are significantly less compared with RhoA/ROCK II. Data show no significant differences between the particulate and cytosolic fractions of the RSM (P > 0.05).
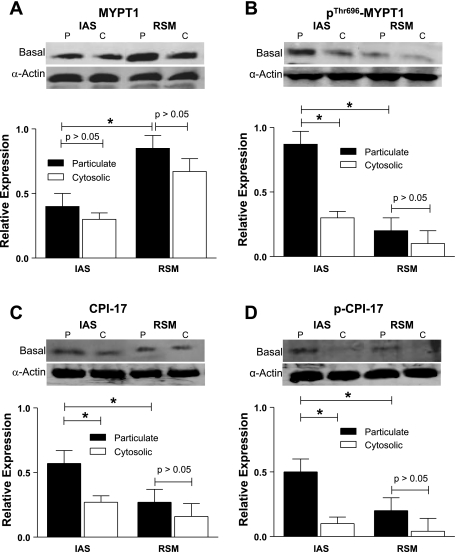
pThr696-MYPT1 CPI-17, and pThr38-CPI-17 had significantly higher levels of expression in the particulate vs. cytosolic fractions in the smooth muscle tissues of the IAS and also when compared with the RSM (*P < 0.05; n = 4 to 5; Fig. 4). In contrast, however, in the basal state of the IAS, the total levels of MYPT1 (combination of membrane and cytosolic expressions) were significantly lower than in the RSM (*P < 0.05; n = 4 to 5). In the RSM, there was no significant difference between the particulate vs. cytosolic fractions for the values of these signal transduction proteins. The significance of the higher levels of pThr696-MYPT1 and pThr38-CPI-17 and whether this reflects a direct consequence of RhoA/ROCK in relation to the higher levels of p-MLC20 and the basal tone remain to be determined. However, a direct and significant correlation between the decreases in the IAS tone and ROCK activity rather than PKC, following the pretreatment of the IAS smooth muscle with the respective inhibitors combined with these observations, suggests that RhoA/ROCK pathway is critical for the basal tone in the IAS (Fig. 8).
Fig. 4.
Western blot data showing significantly lower expression of MYPT1 (A) and higher expressions of p-MYPT1 (B), CPI-17 (C), and p-CPI-17 (D) in the particulate fractions of the smooth muscle tissues of the IAS vs. RSM (*P < 0.05). In addition, the IAS has lower expression of MYPT1 in the cytosolic vs. particulate fractions of the IAS. Also, p-MYPT1, CPI-17, and p-CPI-17 are expressed in higher levels in the particulate vs. cytosolic fractions of the IAS (P < 0.05) but not in the RSM (P > 0.05).
Fig. 8.
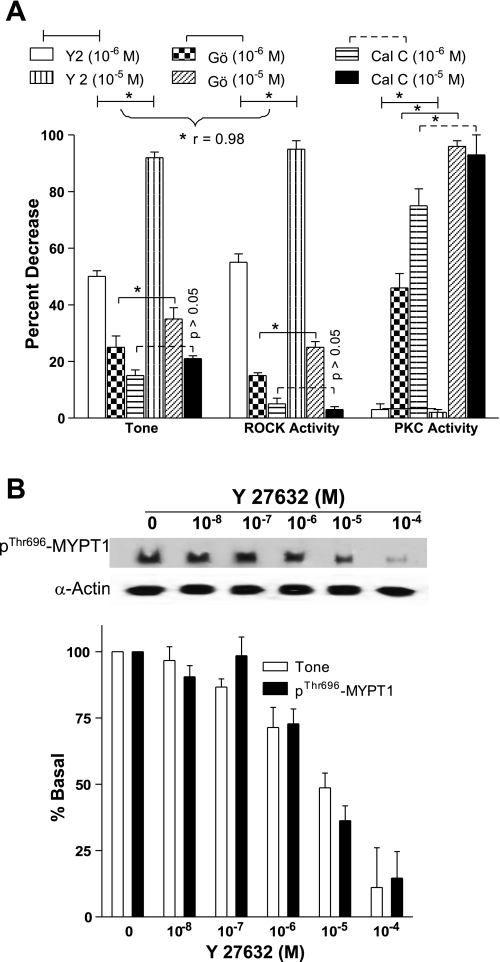
A: predominant role of RhoA/ROCK pathway in the intact human IAS was confirmed by a significant correlation (*P < 0.05; n = 4 to 5) between the decreases in the IAS tone and ROCK activity vs. PKC activity (P > 0.05). In these experiments, Y 27632 and Gö 6850 cause a significant and concentration-dependent decrease in the IAS tone and in the ROCK activity (*P < 005). However, the decreases in the IAS tone and ROCK activity are significantly higher that correlate significantly only in the case of Y 27632 (*P < 0.05). Gö 6850 and calphostin C cause a significant decrease in the PKC activity (*P < 0.05), whereas Y 27632 has no significant effect (P > 0.05). These correlations are further evident in the decreases in the IAS tone and p-MYPT1 (B).
Immunocytochemical localization of PKC-α and RhoA/ROCK II in the IAS vs. RSM SMCs, in the basal state.
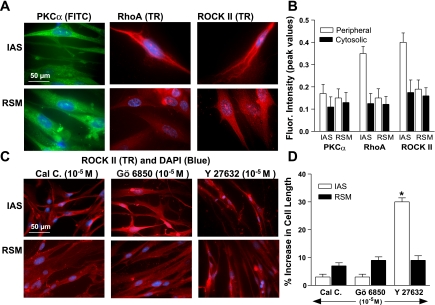
Immunocytochemical studies for the isolated SMC of IAS and RSM in humans support the above Western blot data in the smooth muscle tissues. RhoA and ROCK II (as compared with PKC-α) were present in significantly higher amounts in the IAS SMC membrane vs. the cytosol (*P < 0.05; Fig. 5, A and B). Immunocytochemical studies, however, do not reveal a significant difference for the distribution of PKC-α in the membrane vs. the cytosol; the reason for these differences is not presently known. These distributions appear to be specific since Gö 6850 and calphostin C (10−5 M) selectively caused redistribution of PKC-α and not that of RhoA/ROCK II, and vice versa with Y 27632 (10−5 M) (Fig. 5C). Additionally, Y 27632 caused significantly greater relaxation of the IAS SMCs as shown by the increase in the IAS vs. RSM SMC length (30 ± 1.5% vs. 9.0 ± 1.0; *P < 0.05) than with Gö 6850 and calphostin C (Fig. 5D).
Fig. 5.
A: immunocytochemical images show diffuse distribution of PKC-α throughout the IAS and RSM smooth muscle cells (SMCs). Conversely, data show a discretely higher membranous distribution of RhoA/ROCK II in the IAS vs. the RSM SMCs. B: bar graph data showing higher levels of RhoA/ROCK II vs. PKC-α in the membrane of the IAS SMC vs. RSM (*P < 0.05). C: immunocytochemical images show redistribution of ROCK II by Y 27632, and not by calphostin C (Cal C) and Gö 6850. Such images were also used to determine significantly higher increase in the SMC lengths by Y 27632 compared with calphostin C and Gö 6850 (D).
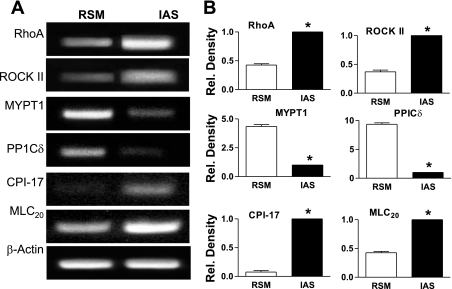
Evidence for higher levels of gene expression of RhoA/ROCK II, CPI-17 and MLC20, and lower levels of MYPT1 and PP1cδ, in the IAS vs. RSM, in the basal state.
RT-PCR analyses revealed significantly higher gene expressions of RhoA, ROCK II, MLC20, and CPI-17 in the IAS vs. RSM. Conversely, expression levels of MYPT1 and PP1cδ were higher in the RSM than IAS (*P < 0.05; n = 3; Fig. 6, A and B). These expression levels in the IAS vs. RSM at the transcriptional level coincide with the translational expressions as shown in Fig. 2.
Fig. 6.
A: RT-PCR showing higher levels of gene expression of RhoA/ROCK II, CPI-17, and MLC20, and lower expression of MYPT1 and PP1cδ in the IAS vs. the RSM. Quantitative data are graphed in B. Rel., relative.
Effects of PKC (Gö 6850 and calphostin C) and ROCK (Y 27632) inhibitors, given individually and in combination, on basal tone in intact human IAS.
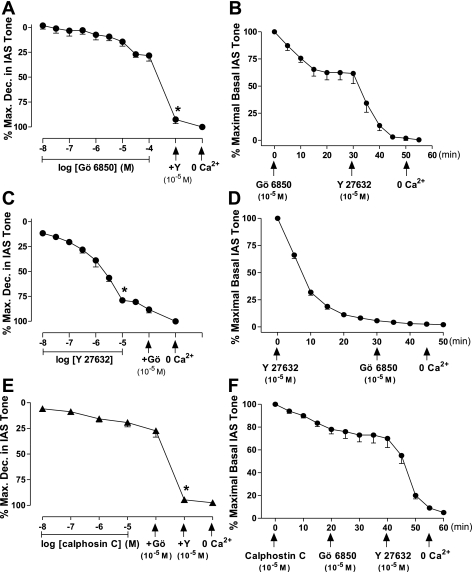
The maximal effective (ECmax) (10−5 M) and supramaximal (10−4 M) concentrations of Gö 6850 produced only 27.1 ± 3.1 and 28.2 ± 5.23% relaxation, respectively (Fig. 7A). However, Y 27632 given after 10−4 M Gö 6850 caused further significant relaxation of the IAS to 92.5 ± 4.1% (*P < 0.5; n = 4 to 6; Fig. 7A). In sharp contrast, when the protocol was reversed, the ECmax of Y 27632 by itself produced precipitous 80.5 ± 2.4% relaxation (*P < 0.05; n = 6 to 8; Fig. 7C) of the IAS, and addition of Gö 6850 produced negligible further relaxation. To decipher the issue further, we repeated studies using another potent, wide-spectrum, yet selective PKC inhibitor: calphostin C. Results substantiated the above data obtained with Gö 6850 showing limited decrease in the IAS tone (19.3 ± 4.3%); Gö 6850 caused no additional effect; and addition of Y 27632 caused further significant decrease in the IAS tone to 94.6 ± 1.0% (*P < 0.05; n = 4 to 6; Fig. 7E). The purpose of adding Gö 6850 after calphostin C was to further assure the complete blockade of the PKC activity.
Fig. 7.
A: concentration-dependent responses of Gö 6850, followed by the administration of Y 27632 on the IAS tone in intact human smooth muscles. Data show that, following the maximal effect of Gö 6850, Y 27632 causes further significantly higher relaxation of the IAS (*P < 0.05). The trend, however, was opposite when the protocol was reversed (C). E: data show response with another potent PKC inhibitor calphostin C to be similar to Gö 6850, and further significantly higher (*P < 0.05) with relaxation of the IAS with Y 27632. The corresponding data of the time course with these inhibitors are shown in B, D, and F, respectively; in these panels the arrows below the x-axis denote the points of administration of the inhibitors and 0 Ca2+.
The corresponding time courses with the ECmax of Gö 6850 alone and combined with Y 27632, Y 27632 alone and combined with Gö 6850, and calphostin C alone and combined with Gö 6850 and Y 27632 are given in Fig. 7, B, D, and F, respectively.
Direct correlation between decreases in PKC and ROCK activities and basal IAS tone, via enzymatic assays and by phospho-MYPT1, CPI-17, and MLC20.
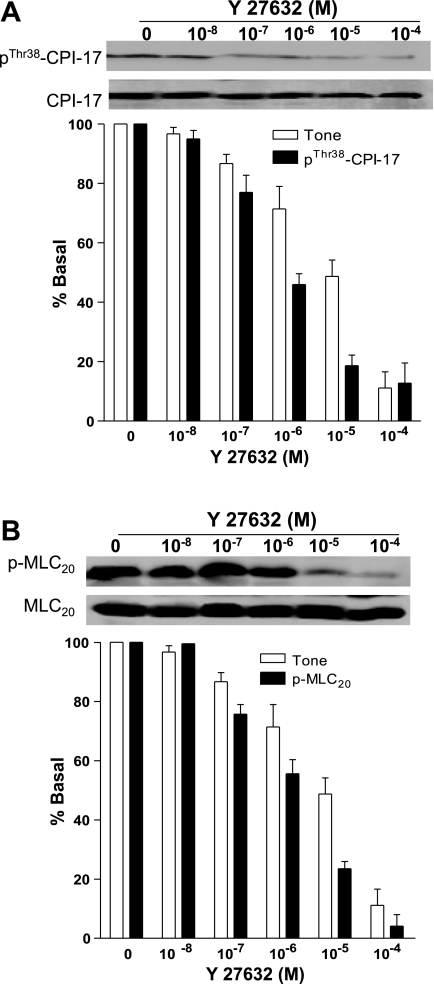
Because of the critical nature of the issue, we further determined the effects of PKC and ROCK inhibitors on IAS tone vs. direct enzymatic activities, and phospho-MYPT1, CPI-17, and MLC20. Data showed clearly that the PKC inhibitors Gö 6850 and calphostin C and the ROCK inhibitor Y 27632 were selective in inhibiting the respective enzymatic activities (Fig. 8A). Only exception was that Gö 6850 besides causing decrease in the PKC activity also caused a partial decrease in the ROCK activity (*P < 0.05). The significance of these observations is not known at the present time. Interestingly, only Y 27632-caused profound and significantly higher decreases in the IAS tone (*P < 0.05) (vs. PKC inhibitors) correlate closely (r = 0.98) with the corresponding decreases in the ROCK activity. To further validate, we observed a close relationship (r = 0.98) between the decreases in the IAS tone and in the p-MYPT1, p-CPI-17, and p-MLC20 following pretreatment with the ROCK inhibitor Y 27632 in a concentration-dependent manner. Data comparing the decreases in the IAS tone and corresponding changes in the levels of p-MYPT1 following Y 27632 are shown in Fig. 8B. Data show that the decreases in the IAS tone with Y 27632 are accompanied with the simultaneous decreases in the basal levels of p-MYPT1 with a close correlation of r = 0.98.
Figure 9, A and B, shows simultaneous changes in the basal IAS tone and in the basal levels of phospho-CPI-17 and MLC20, respectively. Data show that concentration-dependent decreases in the IAS tone are associated with the corresponding decreases in the phospho-CPI-17 and MLC20. In these experiments, there was a tight correlation between the decreases in the IAS tone and p-CPI-17 and p-MLC20 (r = 0.98).
Fig. 9.
Data show a significant correlation (*P < 0.05; n = 4 to 5) between the decreases in the IAS tone and in the expression levels of p-CPI-17 (A), and p-MLC20 (B) following pretreatment with ROCK inhibitor Y 27632.
Comparison of the effects of PKC (calphostin C and Gö 6850) vs. ROCK (Y 27632) inhibitors on the basal IAS tone and phospho-CPI-17.
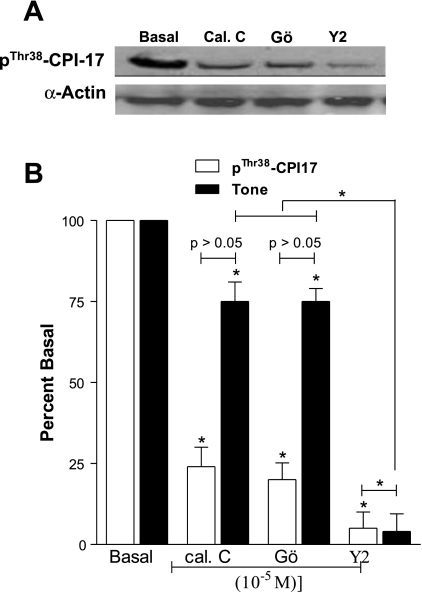
Western blots are shown in Fig. 10A, and their quantitative data along with the decreases in the IAS tone are shown in Fig. 10B. Data show that both PKC and ROCK inhibitors caused significant decreases in the IAS tone as well as in the levels of p-CPI-17 (*P < 0. 05; n = 4). However, Y 27632 caused a significantly greater decrease in the IAS tone that correlated significantly with the corresponding decrease in the levels of p-CPI-17 (*P < 0.05; n = 4). Conversely, a small but significant decrease in the IAS tone with the PKC inhibitors did not correlate with the corresponding decreases in the levels of p-CPI-17.
Fig. 10.
Data show that PKC (calphostin C and Gö 6850) and ROCK [Y 27632 (Y2)] examined in the maximal effective concentrations of 10−5 M cause significant decreases in the IAS tone (*P < 0.05; n = 4). However, only Y 27632 causes a significantly higher decrease in the IAS tone (*P < 0.05) that correlates significantly with the decrease in the expression levels of p-CPI-17 (*P < 0.05).
Collectively, these data suggest that decreases in the ROCK activity (rather than PKC activity) are directly associated with the decreases in the IAS tone of intact human IAS. Relative contribution of CPI-17 in relation to PKC and RhoA/ROCK pathway, however, remains to be determined.
DISCUSSION
The present studies for the first time examine the molecular control mechanisms underlying the basal tone in intact human IAS. The studies were performed using characteristically distinct smooth muscles of the IAS and RSM. The IAS smooth muscles used develop spontaneous basal tone and relax in response to NANC nerve stimulation. Studies using a multidisciplinary approach show that RhoA/ROCK compared with PKC is the major determinant of the basal tone in human IAS.
Several lines of evidence support the predominance of the RhoA/ROCK pathway in the IAS as follows: The maximal decrease in the IAS tone is significantly higher following the ROCK inhibition with Y 27632 (80%) compared with the PKC inhibition with Gö 6850 and calphostin C (27 and 19%, respectively). These data are similar to the previous data in the rat IAS (22, 23, 28) and intact human and cat lower esophageal sphincter smooth muscle (15, 21, 31). Clamping experiments performed in the present studies further show that, following maximal decrease in the IAS tone with ROCK inhibition, PKC inhibition produces a limited effect. Conversely, following maximal PKC inhibition, ROCK inhibition causes further significant decrease in the IAS tone. The significance of the ∼20% decrease in the basal tone following maximal PKC inhibition is not exactly known. Near obliteration of the basal tone with ROCK inhibition alone and limited effect of PKC inhibition given following the ROCK inhibition suggest an overlap of RhoA/ROCK and PKC pathways. It is possible that in part these pathways lie in series, where PKC lies upstream of RhoA/ROCK, and in part these pathways may be in parallel. Apparently, more data are needed to further delineate this.
Western blot studies demonstrate higher levels of expression of RhoA/ROCK II in the IAS vs. RSM and in the downstream signal transduction proteins (p-MYPT1, p-CPI-17, and p-MLC20). In addition, RhoA/ROCK II, p-MYPT1, CPI-17, and p-CPI-17 are present in significantly higher levels in the particulate vs. cytosolic fractions of the IAS compared with the RSM. The exact significance of these observations in relation to the basal tone remains to be determined. [It is well known that, during activation leading to the contraction of the smooth muscles, RhoA/ROCK translocate to the membrane (19)]. It is of interest that, in contrast with other signal transduction proteins, MYPT1 is found in lower levels in the IAS vs. the RSM; and CPI-17 (an endogenous inhibitor of MLCP) is severalfold higher in the IAS than in the RSM, in the basal state. These data suggest that the entire molecular machinery in the IAS is lined up for the higher levels of p-MLC20, leading to the genesis of basal tone in the human IAS. Data show that the basal tone in the intact human IAS is accomplished via constitutively active RhoA/ROCK-mediated inhibition of MLCP by downstream signaling of p-MYPT1 and p-CPI-17. It is worth pointing out that, although p-CPI-17 by itself is capable of inhibiting MLCP for the partial basal tone, p-CPI-17 is several thousand times more potent when phosphorylated by RhoA/ROCK (39). During activation, RhoA/ROCK II, p-MYPT1, and p-CPI-17 are known to translocate to the membrane (19, 30). Therefore, the presence of these signal transduction proteins in higher levels in the IAS SMC membrane is further evidence in favor of constitutively active RhoA/ROCK for the genesis of basal tone in the IAS.
Immunocytochemical studies further corroborate the constitutively active state of RhoA/ROCK by the Western blot data, showing higher levels of expressions of RhoA/ROCK II/p-MYPT1/p-CPI-17 in the particulate than in the cytosolic fractions of the IAS vs. the RSM SMCs. In contrast, there were no clear-cut differences for the membrane vs. cytosolic distribution of PKC-α in the IAS SMCs. Western blot studies further show significantly lower expression of total PKC-α and in the membrane fractions in the IAS and RSM compared with RhoA/ROCK II. However, the significance of higher levels of PKC-α in the particulate fractions of the IAS vs. RSM in relation to the predominant role of RhoA/ROCK in the IAS tone and extent and nature of interaction between the two pathways remain to be determined.
The higher expression of RhoA/ROCK in the IAS vs. RSM was further confirmed by the higher gene expression of RhoA/ROCK mRNAs levels in the IAS. These studies show higher levels not only of RhoA and ROCK II in the IAS but also of the subsequent signal transduction machinery CPI-17 and MLC20 (Fig. 6). It is of interest that, in contrast with the rest of the signal transduction proteins, MYPT and PP1cδ are characteristically present in lower levels in the IAS compared with the RSM, monitored via Western blot, immunocytochemical, and RT-PCR studies. These observations are also in favor of the myogenic tone in the IAS, since lower levels of MYPT1 will limit dephosphorylation of p-MLC20 for the basal tone in the IAS vs. the RSM. Likewise, higher levels of CPI-17 (an endogenous inhibitor of MLCP) will limit dephosphorylation of p-MLC20 in favor of the basal tone in the IAS.
The ROCK inhibitor causes concentration-dependent decrease in the basal tone of human IAS smooth muscles that commensurates directly with the decrease in ROCK activity (not PKC activity) as monitored by the direct enzymatic activity assays and via the levels of p-MYPT1/p-CPI-17/p-MLC20 (Figs. 8 and 9).
A close correlation between the decreases in the p-CPI-17 and the IAS tone following the ROCK inhibitor suggest that in the basal tone of the human IAS CPI-17 is not only the target of PKC but also of RhoA/ROCK. Data show that ROCK inhibition compared with the PKC inhibition was significantly more effective in decreasing p-CPI-17 along with the IAS tone (Fig. 10). This is in general agreement with recent literature on the agonist-induced smooth muscle contraction (29). However, earlier studies did not examine the effects of ROCK vs. PKC inhibition. Therefore, the present studies suggest that in the basal IAS smooth muscle tone CPI-17 may potentially be a preferential target for RhoA/ROCK signaling.
The present data show a predominant role of RhoA/ROCK over PKC, similar to that of intact IAS in other animals (11) and other spontaneously tonic intact smooth muscle of the LES in humans and animals (15, 21, 31). These data are, however, different from the IAS reconstructs from human IAS SMCs (35), suggesting that PKC rather than RhoA/ROCK is the major determinant of the basal tone. The exact reason for the differences between the intact human IAS and the IAS reconstructs is not known. One possibility is the dedifferentiation of the RhoA/ROCK-predominant IAS SMCs to those of PKC-predominant RSM during protracted SMC cultures. Earlier studies in the distal colon smooth muscle of rabbit and rat have shown the predominance of PKC over the RhoA/ROCK pathway (34, 37). Preliminary studies from our laboratory also suggest that, whereas RhoA/ROCK is predominantly responsible for the basal tone in the IAS, PKC plays a major role in the phasic activity of the RSM and colonic smooth muscle (unpublished data). The other possibility is the inherent differences in the composition of the IAS reconstructs (only has SMCs) vs. the intact IAS (that besides the SMCs has other structures such as the myenteric neurons) (25). This possibility was excluded because the neurotoxin TTX has no significant effect on Y 27632-induced IAS relaxation (28) and because ROCK inhibition in human IAS SMCs causes nearly full relaxation that is significantly greater than with the PKC inhibition.
In summary, the present data suggest that the RhoA/ROCK pathway (and not PKC) via MLCP inhibition is the major determinant of the basal tone in intact human IAS. These data have strong implications in the pathophysiology and rational therapeutic RhoA/ROCK targeting for hypotensive and hypertensive IAS, in rectoanal incontinence, and in Hirschsprung's disease, recurrent anal fissures, and hemorrhoids.
AUTHOR CONTRIBUTIONS
S.R. study concept, design, manuscript preparation, and study supervisor; J.S. acquisition of data and data analysis.
GRANTS
The work was supported by National Institutes of Diabetes and Digestive and Kidney Diseases Grant DK-35385 and an institutional grant from Thomas Jefferson University.
REFERENCES
- 1. Ali I, Sarna SK. Selective modulation of PKC isozymes by inflammation in canine colonic circular muscle cells. Gastroenterology 122: 483–494, 2002 [DOI] [PubMed] [Google Scholar]
- 2. Bhardwaj R, Vaizey CJ, Boulos PB, Hoyle CHV. Neuromyogenic properties of the internal anal sphincter: therapeutic rationale for anal fissures. Gut 46: 861–868, 2000 [DOI] [PMC free article] [PubMed] [Google Scholar]
- 3. Bharucha AE. Outcome measures for fecal incontinence: anorectal structure and function. Gastroenterology 126: S90–S98, 2004 [DOI] [PubMed] [Google Scholar]
- 4. Biancani P, Walsh JH, Behar J. Vasoactive intestinal polypeptide: a neurotransmitter for relaxation of the rabbit internal anal sphincter. Gastroenterology 89: 867–874, 1985 [DOI] [PubMed] [Google Scholar]
- 5. Burleigh DE, D'Mello A. Neural and pharmacological factors affecting motility of the internal anal sphincter. Gastroenterology 84: 409–417, 1983 [PubMed] [Google Scholar]
- 6. Cao W, Harnett KM, Behar J, Biancani P. PGF2α-induced contraction of cat esophageal and lower esophageal sphincter circular smooth muscle. Am J Physiol Gastrointest Liver Physiol 283: G282–G291, 2002 [DOI] [PubMed] [Google Scholar]
- 7. Culver PJ, Rattan S. Genesis of anal canal pressures in the opossum. Am J Physiol Gastrointest Liver Physiol 251: G765–G771, 1986 [DOI] [PubMed] [Google Scholar]
- 8. De Godoy MA, Rattan S. Role of rho kinase in the functional and dysfunctional tonic smooth muscles. Trends Pharmacol Sci 32: 384–393, 2011 [DOI] [PMC free article] [PubMed] [Google Scholar]
- 9. De Godoy MAF, Dunn SR, Rattan S. Evidence for the role of angiotensin II biosynthesis in the rat internal anal sphincter tone. Gastroenterology 127: 127–138, 2004 [DOI] [PubMed] [Google Scholar]
- 10. De Godoy MAF, Rattan N, Rattan S. COX1 vs COX-2 as a determinant of the basal tone in the internal anal sphincter. Am J Physiol Gastrointest Liver Physiol 296: G219–G225, 2009 [DOI] [PMC free article] [PubMed] [Google Scholar]
- 11. De Godoy MAF, Rattan S. Role of phospholipase A2 (group I secreted) in the genesis of basal tone in the internal anal sphincter smooth muscle. Am J Physiol Gastrointest Liver Physiol 293: G979–G986, 2007 [DOI] [PubMed] [Google Scholar]
- 12. Eto M, Kitazawa T, Yazawa A, Mukai H, Ono Y, Brautigan DL. Histamine-induced vasoconstriction involves phosphorylation of a specific inhibitor protein for myosin phosphatase by protein kinase C α and δ isoforms. J Biol Chem 276: 29072–29078, 2001 [DOI] [PubMed] [Google Scholar]
- 13. Fujihara H, Walker LA, Gong MC, Lemichez E, Bouquet P, Somlyo AV, Somlyo AP. Inhibition of RhoA translocation and calcium sensitization by in vivo ADP-ribosylation with the chimeric toxin DC3B. Mol Biol Cell 8: 2437–2447, 1997 [DOI] [PMC free article] [PubMed] [Google Scholar]
- 14. Grassie ME, Moffat LD, Walsh MP, MacDonald JA. The myosin phosphatase targeting protein (MYPT) family: a regulated mechanism for achieving substrate specificity of the catalytic subunit of protein phosphatase type 1δ. Arch Biochem Biophys 510: 147–159, 2011 [DOI] [PubMed] [Google Scholar]
- 15. Harnett KM, Cao W, Biancani P. Signal-transduction pathways that regulate smooth muscle function I. Signal transduction in phasic (esophageal) and tonic (gastroesophageal sphincter) smooth muscles. Am J Physiol Gastrointest Liver Physiol 288: G407–G416, 2005 [DOI] [PubMed] [Google Scholar]
- 16. Hartshorne DJ, Ito M, Erdodi F. Role of protein phosphatase type 1 in contractile functions: myosin phosphatase. J Biol Chem 279: 37211–37214, 2004 [DOI] [PubMed] [Google Scholar]
- 17. Madalinski M, Kalinowski L. Novel options for the pharmacological treatment of chronic anal fissure-Role of botulinum toxin. Curr Clin Pharmacol 4: 47–52, 2009 [DOI] [PubMed] [Google Scholar]
- 18. Martiny-Baron G, Kazanietz MG, Mischak H, Blumberg PM, Kochs G, Hug H, Marmé D, Schächtele C. Selective inhibition of protein kinase C isozyme by the indolacarbazole Gö 6976. J Biol Chem 268: 9194–9197, 1993 [PubMed] [Google Scholar]
- 19. Murthy KS. Signaling for contraction and relaxation in smooth muscle of the gut. Annu Rev Physiol 68: 345–374, 2006 [DOI] [PubMed] [Google Scholar]
- 20. Murthy KS, Zhou H, Grider JR, Brautigan DL, Eto M, Makhlouf GM. Differential signalling by muscarinic receptors in smooth muscle: m2-mediated inactivation of myosin light chain kinase via Gi3, Cdc42/Rac1 and p21-activated kinase 1 pathway, and m3-mediated MLC20 (20 kDa regulatory light chain myosin II) phosphorylation via Rho-associated kinase/myosin phosphatase targeting subunit and protein kinase C/CPI-17 pathway. Biochem J 374: 145–155, 2003 [DOI] [PMC free article] [PubMed] [Google Scholar]
- 21. Park SY, Song HJ, Sohn UD. Participation of Rho-associated kinase in electrical stimulated and acetylcholine-induced contraction of feline esophageal smooth muscle. Eur J Pharmacol 607: 220–225, 2009 [DOI] [PubMed] [Google Scholar]
- 22. Patel CA, Rattan S. Spontaneously tonic smooth muscle has characteristically higher levels of RhoA/ROK compared with the phasic smooth muscle. Am J Physiol Gastrointest Liver Physiol 291: G830–G837, 2006 [DOI] [PubMed] [Google Scholar]
- 23. Patel CA, Rattan S. Cellular regulation of basal tone in internal anal sphincter smooth muscle by RhoA/ROCK. Am J Physiol Gastrointest Liver Physiol 292: G1747–G1756, 2007 [DOI] [PubMed] [Google Scholar]
- 24. Rao SS. Pathophysiology of adult fecal incontinence. Gastroenterology 126: S14–S22, 2004 [DOI] [PubMed] [Google Scholar]
- 25. Rattan S. The internal anal sphincter: regulation of smooth muscle tone and relaxation. Neurogastroenterol Motil 17: 50–59, 2005 [DOI] [PubMed] [Google Scholar]
- 26. Rattan S, Benjamin P, Maxwell PJ., IV RhoA/ROCK-kinase: pathophysiologic and therapeutic implications in gastrointestinal smooth muscle tone and relaxation. Gastroenterology 138: 13–18, 2010 [DOI] [PMC free article] [PubMed] [Google Scholar]
- 27. Rattan S, Chakder S. Inhibitory effect of CO on internal anal sphincter: Heme oxygenase inhibitor inhibits NANC relaxation. Am J Physiol Gastrointest Liver Physiol 265: G799–G804, 1993 [DOI] [PubMed] [Google Scholar]
- 28. Rattan S, De Godoy MAF, Patel CA. Rho kinase as a novel molecular therapeutic target for hypertensive internal anal sphincter. Gastroenterology 131: 108–116, 2006 [DOI] [PubMed] [Google Scholar]
- 29. Sakai H, Chiba Y, Misawa M. Role of Rho kinase in endothelin-1-induced phosphorylation of CPI-17 in rat bronchial smooth muscle. Pulm Pharmacol Ther 20: 734–739, 2007 [DOI] [PubMed] [Google Scholar]
- 30. Shin HM, Je HD, Gallant C, Tao TC, Hartshorne DJ, Ito M, Morgan KG. Differential association and localization of myosin phosphatase subunits during agonist-induced signal transduction in smooth muscle. Circ Res 90: 546–553, 2002 [DOI] [PubMed] [Google Scholar]
- 31. Sims SM, Chrones T, Preiksaitis HG. Calcium sensitization in human esophageal muscle: role for RhoA kinase in maintenance of lower esophageal sphincter tone. J Pharmacol Exp Ther 327: 178–186, 2008 [DOI] [PubMed] [Google Scholar]
- 32. Singh J, Maxwell PJ, IV, Rattan S. Immunocytochemical evidence for PDBu-induced activation of RhoA/ROCK in human internal anal sphincter smooth muscle cells. Am J Physiol Gastrointest Liver Physiol 301: G317–G325, 2011 [DOI] [PMC free article] [PubMed] [Google Scholar]
- 33. Singh J, Mehendiratta V, Del Galdo F, Jimenez SA, Cohen S, DiMarino AJ, Rattan S. Immunoglobulins from scleroderma patients inhibit the muscarinic receptor activation in internal anal sphincter smooth muscle cells. Am J Physiol Gastrointest Liver Physiol 297: G1206–G1213, 2009 [DOI] [PMC free article] [PubMed] [Google Scholar]
- 34. Somara S, Bitar KN. Direct association of calponin with specific domains of PKC-α. Am J Physiol Gastrointest Liver Physiol 295: G1246–G1254, 2008 [DOI] [PMC free article] [PubMed] [Google Scholar]
- 35. Somara S, Gilmont RR, Dennis RG, Bitar KN. Bioengineered internal anal sphincter derived from isolated human internal anal sphincter smooth muscle cells. Gastroenterology 137: 53–61, 2009 [DOI] [PubMed] [Google Scholar]
- 36. Somlyo AP, Somlyo AV. Signal transduction by G-proteins, Rho-kinase and protein phosphatase to smooth muscle and non-muscle myosin II. J Physiol 522: 177–185, 2000 [DOI] [PMC free article] [PubMed] [Google Scholar]
- 37. Takeuchi T, Nakajima H, Hata F, Azuma YT. A minor role for Ca2+ sensitization in sustained contraction through activation of muscarinic receptor in circular muscle of rat colon. Pflügers Arch 454: 565–574, 2007 [DOI] [PubMed] [Google Scholar]
- 38. Wang Y, Zheng XR, Riddick N, Bryden M, Bauer W, Zhang X, Surks HK. ROCK isoform regulation of myosin phosphatase and contractility in vascular smooth muscle cells. Circ Res 104: 531–540, 2009 [DOI] [PMC free article] [PubMed] [Google Scholar]
- 39. Woodsome TP, Eto M, Everett A, Brautigan DL, Kitazawa T. Expression of CPI-17 and myosin phosphatase correlates with Ca2+ sensitivity of protein kinase C-induced contraction of rabbit smooth muscle. J Physiol 535: 553–564, 2001 [DOI] [PMC free article] [PubMed] [Google Scholar]


