Protein folding kinetics are often measured by monitoring the change of a single spectroscopic signal, such as the fluorescence of an intrinsic fluorophore or the absorbance at a single frequency within an electronic or vibrational band of the protein backbone. While such an experimental strategy is easy to implement, the use of a single spectroscopic signal can leave important folding events undetected and overlooked. Herein, we demonstrate, using the mini-protein Trp-cage as an example, that the structural resolution of protein folding kinetics can be significantly improved when a multi-probe and multi-frequency approach is used, thus allowing a more complete understanding of the folding mechanism.
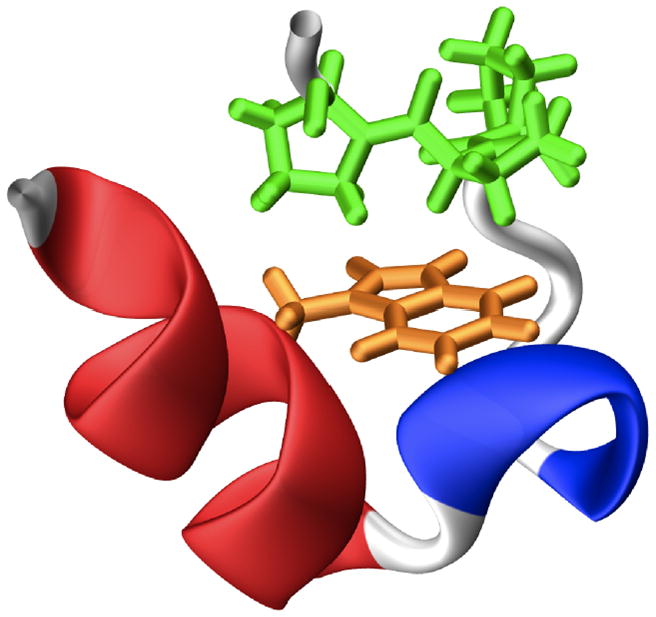
Trp-cage is a 20-residue mini-protein designed by Andersen and coworkers.[1] Among the many Trp-cage variants (the name and sequence of the Trp-cage peptides studied here are listed in Table S1, Supporting Information), TC5b is the most studied, both experimentally and computationally. As shown (Figure 1), the folded structure of Trp-cage consists of three secondary structural elements: an α-helix from residues 2–8, a 310-helix consisting of residues 12–14, and a polyproline region spanning residues 17–19, which together generate a hydrophobic cage housing the peptide’s sole tryptophan residue. Because of its small size and fast folding rate, Trp-cage has been an extremely popular model for computational studies of protein folding dynamics.[2–42] However, experimental investigations of the folding kinetics and mechanism of Trp-cage remain scarce. Using a temperature-jump (T-jump) fluorescence technique, Hagen and coworkers[43] showed that TC5b folds in about 4 μs at room temperature, while an infrared (IR) T-jump study by Bunagan et al. indicated that the P12W mutant of TC5b, or Trp2-cage, folds even faster.[44] In both cases, single-exponential relaxation kinetics were observed, suggesting that folding proceeds in a two-state manner. On the other hand, equilibrium unfolding studies provided evidence suggesting the existence of folding intermediates corresponding to a compact denatured state[45,46] and a partially folded state with maximal thermal stability of 20 °C.[47] Moreover, a large number of different folding pathways have been observed in computer simulations, including, for instance, the formation of an early intermediate where the hydrophobic core is bisected by the D9-R16 salt-bridge,[48] and the concurrent formation of the α-helix and the hydrophobic core,[19,27,28] among others.
Figure 1.

Structure of the Trp-cage (PDB code: 1L2Y), showing the α-helix (red), the 310-helix (blue), the polyproline region (green), and the sole tryptophan (orange).
Generating a conclusive experimental verification of these previous simulation results poses a great challenge to experimentalists, because the kinetic techniques commonly used in protein folding studies offer relatively low structural resolution. To overcome this limitation and to provide new insights into the folding mechanism of Trp-cage, we seek to use a multi-probe approach to dissect the folding kinetics of individual local structural elements of the native fold. To this end, we measure T-jump induced conformation relaxation kinetics[49] at well-chosen frequencies in the amide I′ region of the protein that report the absorbance changes of the α-helix, the 310-helix, the unfolded structural ensemble, as well as the Asp sidechain. Separation of the α-helix IR signal from those arising from other structural motifs is facilitated by using the following Trp-cage sequence: DA*YA*QWLKDGGPSSGRPPPS (here after referred to as 13C-TC10b), where A* represents 13C=O labeled alanine, whose amide I′ frequency is known to red-shift by about 40 cm−1 from that of the unlabeled helical amides.[50,51,52] Andersen and coworkers have shown that this sequence, which is referred to as TC10b in their study, yields a more stable Trp-cage fold and is therefore a better model for both experimental and computational studies.[53] In addition, we employ several well-chosen mutations and φ-value analysis[54] in order to determine the structural elements formed in the folding transition state.
As shown (Figures S1 and S2 and Table S2, Supporting Information), the thermal unfolding properties of the Trp-cage variants studied here, determined via circular dichroism (CD) spectroscopy, are in quantitative agreement with those reported in the literature.[44,53] For example, the thermal melting temperature (i.e., Tm) of 13C-TC10b is determined to be 55.0 ± 1.0 °C, comparing well with 56 °C for TC10b reported by Andersen and coworkers.[53]
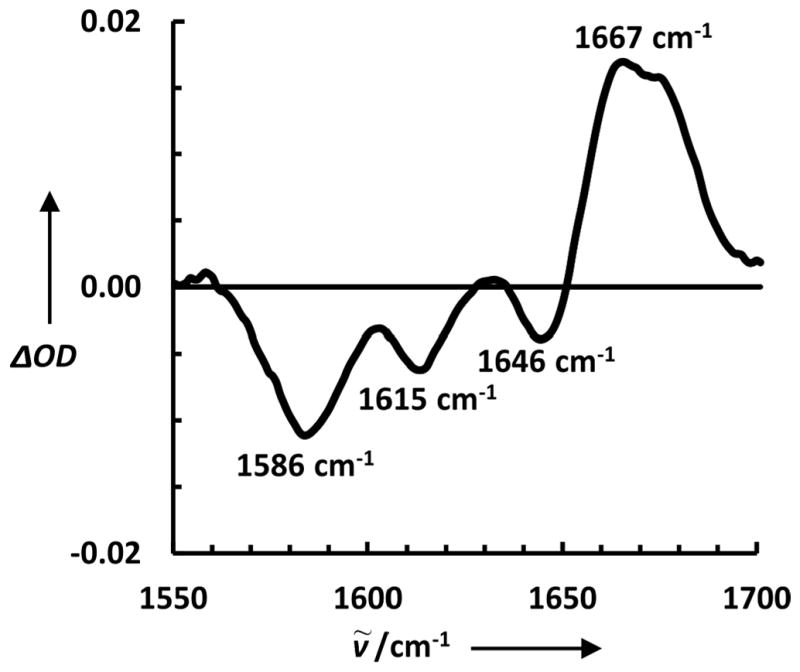
In comparison with that of TC5b (Figure S3, Supporting Information), the FTIR difference spectrum of 13C-TC10b (Figure 2) indicates that the negative spectral feature at ~1615 cm−1 is due to the 13C-labeled Ala residues, thus uniquely reporting the thermal melting of the α-helical segment within the protein. The negative peak at ~1646 cm−1 arises from the loss of unlabeled helical amides. The apparent blue-shift and lower intensity of the unlabeled helical amide I′ band in the difference spectrum, in comparison with that observed for unlabeled Trp-cage, is due to spectral overlapping with the amide I′ band of 13C=Os in the thermally denatured state.[52] On the other hand, the positive spectral feature arises from 12C=Os in the thermally unfolded state of 13C-TC10b. In addition, the negative feature at ~1586 cm−1 is due to the absorbance change of the deprotonated Asp sidechain (i.e., νas(COO−))[55] in response to protein unfolding. Since the salt bridge formed between the sidechains of D9 and R16 is a key structural determinant of the Trp-cage stability and fold,[56] we believe that this spectral feature provides an excellent IR marker for probing the global folding/unfolding kinetics of the cage structure.[57]
Figure 2.

A representative FTIR difference spectrum of 13C-TC10b between 65.0 °C and 25.0 °C.
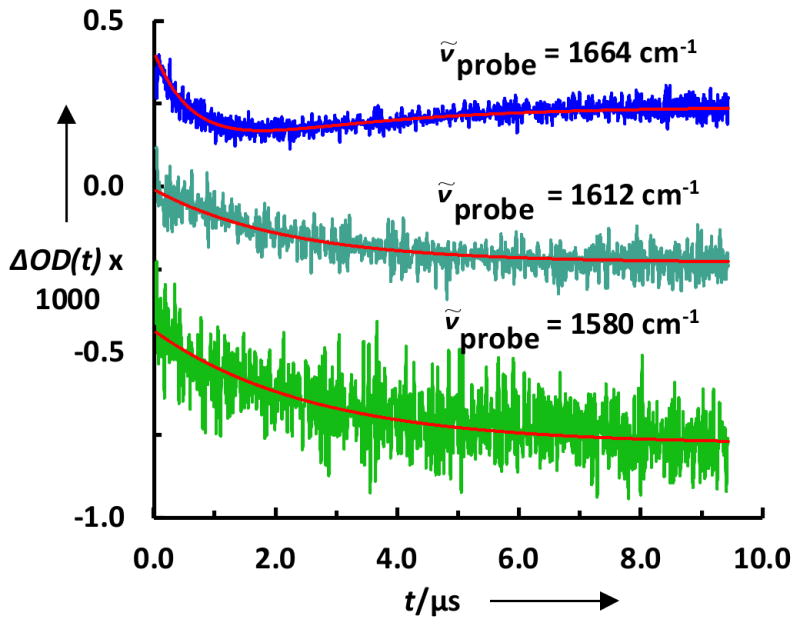
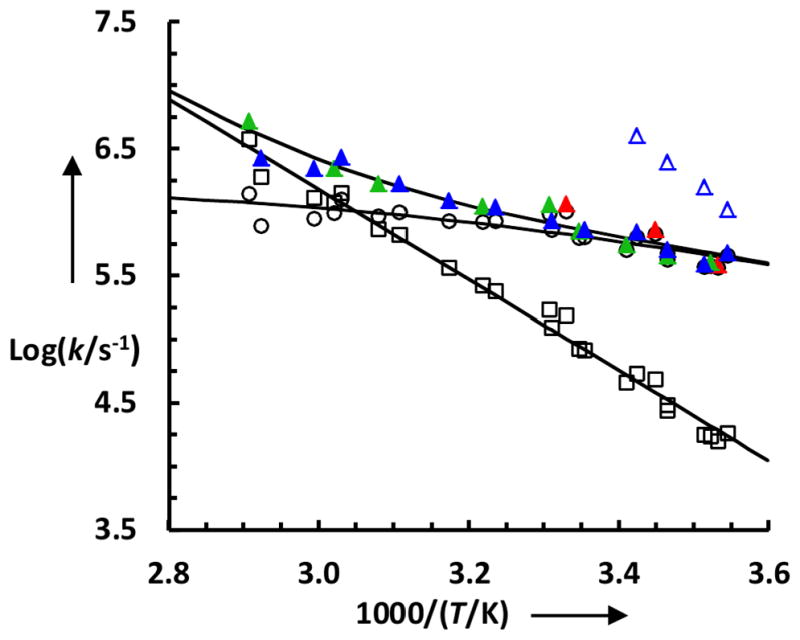
As shown (Figure 3), the T-jump induced conformational relaxation kinetics probed at both 1580 and 1612 cm−1 can be adequately described by a single-exponential function and the corresponding rate constants, as indicated (Figure 4), are indistinguishable from each other within the limit of experimental errors. Interestingly, however, when probed at 1664 cm−1, a frequency where both the 310-helix and disordered conformation are known to absorb,[58] the T-jump induced conformational relaxation kinetics can only be fit by two exponentials with amplitudes of opposite sign(Figure 3). As indicated (Figure 4), the rate constant of the positive (and slower) kinetic phase is also identical, within experimental uncertainty, to those measured at 1580 and 1612 cm−1. Therefore, we attribute this kinetic phase to the global folding-unfolding transition of the Trp-cage structure. Consequently, we assign the fast phase, whose amplitude decreases with time, to the local unfolding of the 310-helix.
Figure 3.

Representative T-jump induced conformational relaxation traces of 13C-TC10b in response to a T-jump from 5 to 10 °C, probed at different frequencies as indicated. The smooth lines are the corresponding fits of these data to either a single-exponential (for 1580 cm−1 and 1612 cm−1) or a double-exponential function (for 1664 cm−1) and the resulting rate constants are given in Figure 4. For easy comparison, these data have been offset.
Figure 4.

Conformational relaxation rate constants (solid symbols) of 13C-TC10b obtained with a probing frequency of 1580 cm−1 (red), 1612 cm−1 (green), and 1664 cm−1 (blue), respectively. The blue open triangles represent the relaxation rates of the fast kinetic phase observed at 1664 cm−1. The black open symbols represent the global folding (circle) and unfolding (square) rates of the protein.
The assignment of the fast kinetic phase observed at 1664 cm−1 to T-jump induced conformational relaxation of the 310-helix is consistent with several lines of evidence. First, it has been shown that 310-helices absorb in the 1660 cm−1 region.[58,59] Second, the full amplitude of this phase decreases with increasing final temperature (for the same T-jump amplitude) and becomes practically undetectable when the final temperature is higher than ~20 °C (Figure 4). This result is consistent with the work of Asher and coworkers[47] as well as Day et al.,[41] both of which showed that the unfolding of a structural element that likely includes the 310-helix occurs at a temperature that is much lower than the thermal melting temperature of the cage structure. Third, the relaxation rate of this kinetic phase is on the order of hundreds of nanoseconds, comparable to that observed for short α-helices.[52,60–62] Fourth, many molecular dynamics simulations carried out at 300 K[4,9,48,63] fail to reproduce the native 310-helix in the NMR structure determined at 285 K,[1] which suggests that this structural element is only stable at low temperatures (<25 °C). Finally, our finding is in accord with the computational study of Bolhuis and coworkers,[64] which showed that every unfolding trajectory in their molecular dynamics simulations begins with unfolding of the 310-helix.
Moreover, the T-jump induced relaxation kinetics of both TC5b[43] and Trp2-cage[44] obtained at 1664 cm−1 also contain this fast kinetic phase (data not shown), indicating that it is not unique to 13C-TC10b but rather reports the conformational relaxation of the 310-helix in each case. What is more interesting, however, is that for TC5b this negative phase is detectable only at final temperatures below ~12 °C, whereas for Trp2-cage the temperature range within which this phase is detectable is similar to that of 13C-TC10b. Since the Tm of Trp2-cage is almost identical to that of 13C-TC10b, but is approximately 15 °C higher than that of TC5b,[44] these results suggest that while the 310-helix can fold/unfold independently, its stability is to some extent affected by the stability of the cage. Similar to the observation that a nearby structural constraint can stabilize the helical structure of very short peptides,[65] the above correlation most likely reflects the constraining effect of the cage on the 310-helix.
The fact that the relaxation rates obtained at 1580 cm−1 and 1612 cm−1 are identical indicate that the α-helix and the cage are formed at the same rate (Figure 4). However, these results alone are insufficient to establish whether the D9-R16 salt bridge is formed early, as suggested by many molecular dynamics simulations,[12,25,27,29,48,63] or on the downhill side of the major folding free energy barrier. To provide additional insights into the folding transition state of Trp-cage, we further conducted φ-value analysis.
Since the stability of the 310-helix is sufficiently low compared to that of the cage structure, the folding rates of the cage are obtained by analyzing the corresponding relaxation rates and CD thermal melting curves using a two-state model.[65] We first compare the folding rates of TC10b and its mutant R16K. As shown (Table S2 and Figure S4, Supporting information), while this mutation decreases the thermal melting temperature of the cage by more than 9 °C, the folding rate of the resultant peptide (i.e., TC10b-R16K) at 25 °C is (1.9 ± 0.4 μs) −1, which, in comparison to the folding rate of (1.6 ± 0.3μs) −1 of the parent at the same temperature (Figure 4), leads to a φ-value of 0.1 ± 0.15. This result indicates that the D9-R16 salt bridge has not been formed when folding reaches the transition state. Similarly, we find that the φ-value of the P19A mutant of TC10b is also essentially 0.0 ± 0.1 at 25 °C (Figure S5, Supporting information), indicating that the folding transition state of Trp-cage is not stabilized by interactions involving P19 and that the hydrophobic cage is formed at a later stage of the folding process. On the other hand, we find that the cage folding rate of TC5b at 25 °C is (3.7 ± 0.3μs) −1 (Figure S6, Supporting information). This leads to a φ-value of 1.16 ± 0.15, indicating that the α-helix is fully formed in the transition state. Thus taken together, our φ-value results depict a Trp-cage folding mechanism wherein the formation of the α-helix directs folding toward the native state. In other words, those interactions that stabilize the cage structure are only fully developed at the native side of the major folding free energy barrier. This folding mechanism is consistent with several simulations[19,27,28] and is further supported by the fact that monomeric α-helices can fold in 1–2 μs.[66,67]
In summary, we demonstrate that much improved structural resolution can be achieved in protein folding kinetics studies using IR T-jump spectroscopy. This method combines several strategies: (a) using isotopically labelled amide groups to assess the conformational relaxation kinetics of a specific secondary structural element, (b) using sidechain absorption to probe the relaxation kinetics of a specific long-range tertiary interaction, and (c) scanning the probing frequencies across the amide I′ band of the protein backbone to reveal relaxation events that occur with different rates. For Trp-cage, we find that the 310-helix unfolds at a temperature much lower than the global unfolding temperature of the cage structure, which is similar to the notion that protein folding occurs via step-wise assembly of structural foldons.[68] Using φ-value analysis, we further show that only the α-helix is formed in the folding transition state, which is in disagreement with most previous simulation studies.
Experimental Section
The Trp-cage peptides were synthesized on a PS3 automated peptide synthesizer (Protein Technologies, MA) using Fmoc-protocols, purified by reverse-phase chromatography, and identified by matrix assisted laser desorption ionization mass spectroscopy. Trifluoroacetic acid (TFA) removal and H-D exchange were achieved by multiple rounds of lyophilization.
CD spectra and thermal melting curves were obtained on an Aviv 62A DS spectropolarimeter (Aviv Associates, NJ) with a 1 mm sample holder. The peptide concentration was in the range of 30–50μM in 50 mM phosphate D2O buffer solution (pH* 7).
Fourier transform infrared (FTIR) spectra were collected on a Magna-IR 860 spectrometer (Nicolet, WI) using a home made, two-compartment CaF2 sample cell of 56 μm.[49] The detail of the T-jump IR setup has been described elsewhere.[49] The only difference is that in the current study a quantum cascade (QC) mid-IR laser (Daylight Solutions, CA) was used to probe the T-jump induced conformational relaxation kinetics, which significantly improved the signal-to-noise ratio of the kinetic data. The peptide samples used in the IR measurements were prepared by directly dissolving lyophilized solids in 50 mM phosphate D2O buffer (pH* 7) and the final peptide concentration was between 1–2.5 mM.
Footnotes
Supporting information for this article is available on the WWW under http://www.angewandte.org.
We thank the National Institutes of Health (GM-065978, RR01348 and GM-008275) for funding. R.M.C. is a Structural Biology Training Grant Fellow.
Contributor Information
Robert M. Culik, Department of Biochemistry and Molecular Biophysics, University of Pennsylvania (United States).
Arnaldo L. Serrano, Department of Chemistry, University of Pennsylvania, 231 S. 34 Street, Philadelphia, PA 19104 (United States).
Prof. Dr. Michelle R. Bunagan, Email: bunagan@tcnj.edu, Department of Chemistry, College of New Jersey, 2000 Pennington Road, Ewing, NJ 08628 (United States), Fax: 609-637-5157.
Prof. Dr. Feng Gai, Email: gai@sas.upenn.edu, Department of Chemistry, University of Pennsylvania, 231 S. 34 Street, Philadelphia, PA 19104 (United States), Fax: 215-573-2112
References
- 1.Neidigh JW, Fesinmeyer RM, Andersen NH. Nat Struct Biol. 2002;9:425–430. doi: 10.1038/nsb798. [DOI] [PubMed] [Google Scholar]
- 2.Snow CD, Zagrovic B, Pande VS. J Am Chem Soc. 2002;124:14548–14549. doi: 10.1021/ja028604l. [DOI] [PubMed] [Google Scholar]
- 3.Simmerling C, Strockbine B, Roitberg AE. J Am Chem Soc. 2002;124:11258–11259. doi: 10.1021/ja0273851. [DOI] [PubMed] [Google Scholar]
- 4.Chowdhury S, Lee MC, Xiong GM, Duan Y. J Mol Biol. 2003;327:711–717. doi: 10.1016/s0022-2836(03)00177-3. [DOI] [PubMed] [Google Scholar]
- 5.Pitera JW, Swope W. Proc Natl Acad Sci USA. 2003;100:7587–7592. doi: 10.1073/pnas.1330954100. [DOI] [PMC free article] [PubMed] [Google Scholar]
- 6.Nikiforovich GV, Andersen NH, Fesinmeyer RM, Frieden C. Proteins. 2003;52:292–302. doi: 10.1002/prot.10409. [DOI] [PubMed] [Google Scholar]
- 7.Schug A, Herges T, Wenzel W. Phys Rev Lett. 2003;91:158102. doi: 10.1103/PhysRevLett.91.158102. [DOI] [PubMed] [Google Scholar]
- 8.Carnevali P, Toth G, Toubassi G, Meshkat SN. J Am Chem Soc. 2003;125:14244–14245. doi: 10.1021/ja036647b. [DOI] [PubMed] [Google Scholar]
- 9.Chowdhury S, Lee MC, Duan Y. J Phys Chem B. 2004;108:13855–13865. [Google Scholar]
- 10.Steinbach PJ. Proteins. 2004;57:665–677. doi: 10.1002/prot.20247. [DOI] [PubMed] [Google Scholar]
- 11.Ota M, Ikeguchi M, Kidera A. Proc Natl Acad Sci USA. 2004;101:17658–17663. doi: 10.1073/pnas.0407015102. [DOI] [PMC free article] [PubMed] [Google Scholar]
- 12.Linhananta A, Boer J, MacKay I. J Chem Phys. 2005;122:114901–114915. doi: 10.1063/1.1874812. [DOI] [PubMed] [Google Scholar]
- 13.Seshasayee ASN. Theor Biol Med Model. 2005;2:7–11. doi: 10.1186/1742-4682-2-7. [DOI] [PMC free article] [PubMed] [Google Scholar]
- 14.Ding F, Buldyrev SV, Dokholyan NV. Biophys J. 2005;88:147–155. doi: 10.1529/biophysj.104.046375. [DOI] [PMC free article] [PubMed] [Google Scholar]
- 15.Irback A, Mohanty S. Biophys J. 2005;88:1560–1569. doi: 10.1529/biophysj.104.050427. [DOI] [PMC free article] [PubMed] [Google Scholar]
- 16.Alonso JL, Echenique P. Biophys Chem. 2005;115:159–168. doi: 10.1016/j.bpc.2004.12.021. [DOI] [PubMed] [Google Scholar]
- 17.Chen J, Im W, Brooks CL. J Am Chem Soc. 2006;128:3728–3736. doi: 10.1021/ja057216r. [DOI] [PMC free article] [PubMed] [Google Scholar]
- 18.Zhan LX, Chen JZY, Liu WK. Proteins. 2007;66:436–443. doi: 10.1002/prot.21157. [DOI] [PubMed] [Google Scholar]
- 19.Paschek D, Nymeyer H, Garcia AE. J Struct Biol. 2007;157:524–533. doi: 10.1016/j.jsb.2006.10.031. [DOI] [PubMed] [Google Scholar]
- 20.Yang L, Grubb MP, Gao YQ. J Chem Phys. 2007;126:125102. doi: 10.1063/1.2709639. [DOI] [PubMed] [Google Scholar]
- 21.Beck DAC, White GWN, Daggett V. J Struct Biol. 2007;157:514–523. doi: 10.1016/j.jsb.2006.10.002. [DOI] [PMC free article] [PubMed] [Google Scholar]
- 22.Piana S, Laio A. J Phys Chem B. 2007;111:4553–4559. doi: 10.1021/jp067873l. [DOI] [PubMed] [Google Scholar]
- 23.Copps J, Murphy RF, Lovas S. Biopolymers. 2007;88:427–437. doi: 10.1002/bip.20709. [DOI] [PubMed] [Google Scholar]
- 24.Kentsis A, Gindin T, Mezei M, Osman R. PLoS ONE. 2007;2:e446. doi: 10.1371/journal.pone.0000446. [DOI] [PMC free article] [PubMed] [Google Scholar]
- 25.Hu ZH, Tang YH, Wang HF, Zhang X, Lei M. Arch Biochem Biophys. 2008;475:140–147. doi: 10.1016/j.abb.2008.04.024. [DOI] [PubMed] [Google Scholar]
- 26.Hudaky P, Straner P, Farkas V, Varadi G, Toth G, Perczel A. Biochemistry. 2008;47:1007–1016. doi: 10.1021/bi701371x. [DOI] [PubMed] [Google Scholar]
- 27.Xu WX, Mu YG. Biophys Chem. 2008;137:116–125. doi: 10.1016/j.bpc.2008.08.002. [DOI] [PubMed] [Google Scholar]
- 28.Paschek D, Hempel S, Garcia AE. Proc Natl Acad Sci USA. 2008;105:17754–17759. doi: 10.1073/pnas.0804775105. [DOI] [PMC free article] [PubMed] [Google Scholar]
- 29.Wu S, Zhuravlev PI, Papoian GA. Biophys J. 2008;95:5524–5532. doi: 10.1529/biophysj.108.136697. [DOI] [PMC free article] [PubMed] [Google Scholar]
- 30.Yao XQ, She ZS. Biochem Biophys Res Commun. 2008;373:64–68. doi: 10.1016/j.bbrc.2008.05.179. [DOI] [PubMed] [Google Scholar]
- 31.Kannan S, Zacharias M. Proteins. 2009;76:448–460. doi: 10.1002/prot.22359. [DOI] [PubMed] [Google Scholar]
- 32.Cerny J, Vondrasek J, Hobza P. J Phys Chem B. 2009;113:5657–5660. doi: 10.1021/jp9004746. [DOI] [PubMed] [Google Scholar]
- 33.Chebaro Y, Dong X, Laghaei R, Derreumaux P, Mousseau N. J Phys Chem B. 2009;113:267–274. doi: 10.1021/jp805309e. [DOI] [PubMed] [Google Scholar]
- 34.Matthes D, de Groot BL. Biophys J. 2009;97:599–608. doi: 10.1016/j.bpj.2009.04.061. [DOI] [PMC free article] [PubMed] [Google Scholar]
- 35.Marinelli F, Pietrucci F, Laio A, Piana S. PLoS Comput Biol. 2009;5:e1000452. doi: 10.1371/journal.pcbi.1000452. [DOI] [PMC free article] [PubMed] [Google Scholar]
- 36.Gattin Z, Riniker S, Hore PJ, Mok KH, van Gunsteren WF. Protein Sci. 2009;18:2090–2099. doi: 10.1002/pro.223. [DOI] [PMC free article] [PubMed] [Google Scholar]
- 37.Gao M, Zhu HQ, Yao XQ, She ZS. Biochem Biophys Res Commun. 2010;392:95–99. doi: 10.1016/j.bbrc.2010.01.003. [DOI] [PubMed] [Google Scholar]
- 38.Velez-Vega C, Borrero EE, Escobedo FA. J Chem Phys. 2010;133:105103. doi: 10.1063/1.3474803. [DOI] [PubMed] [Google Scholar]
- 39.Bruce NJ, Bryce RA. J Chem Theory Comput. 2010;6:1925–1930. doi: 10.1021/ct100060t. [DOI] [PubMed] [Google Scholar]
- 40.Lee MS, Olson MA. J Chem Theory Comput. 2010;6:2477–2487. doi: 10.1021/ct100062b. [DOI] [PubMed] [Google Scholar]
- 41.Day R, Paschek D, Garcia AE. Proteins. 2010;78:1889–1899. doi: 10.1002/prot.22702. [DOI] [PMC free article] [PubMed] [Google Scholar]
- 42.Zheng W, Gallicchio E, Deng N, Andrec M, Levy RM. J Phys Chem B. 2011;115:1512–1523. doi: 10.1021/jp1089596. [DOI] [PMC free article] [PubMed] [Google Scholar]
- 43.Qiu LL, Pabit SA, Roitberg AE, Hagen SJ. J Am Chem Soc. 2002;124:12952–12953. doi: 10.1021/ja0279141. [DOI] [PubMed] [Google Scholar]
- 44.Bunagan MR, Yang X, Saven JG, Gai F. J Phys Chem B. 2006;110:3759–3763. doi: 10.1021/jp055288z. [DOI] [PubMed] [Google Scholar]
- 45.Neuweiler H, Doose S, Sauer M. Proc Natl Acad Sci USA. 2005;102:16650–16655. doi: 10.1073/pnas.0507351102. [DOI] [PMC free article] [PubMed] [Google Scholar]
- 46.Mok KH, Kuhn LT, Goez M, Day IJ, Lin JC, Andersen NH, Hore PJ. Nature. 2007;447:106–109. doi: 10.1038/nature05728. [DOI] [PMC free article] [PubMed] [Google Scholar]
- 47.Ahmed Z, Beta IA, Mikhonin AV, Asher SA. J Am Chem Soc. 2005;127:10943–10950. doi: 10.1021/ja050664e. [DOI] [PubMed] [Google Scholar]
- 48.Zhou RH. Proc Natl Acad Sci USA. 2003;100:13280–13285. doi: 10.1073/pnas.2233312100. [DOI] [PMC free article] [PubMed] [Google Scholar]
- 49.Huang CY, Getahun Z, Zhu YJ, Klemke JW, Degrado WF, Gai F. Proc Natl Acad Sci USA. 2002;99:2788–2793. doi: 10.1073/pnas.052700099. [DOI] [PMC free article] [PubMed] [Google Scholar]
- 50.Tadesse L, Nazarbaghi R, Walters L. J Am Chem Soc. 1991;113:7036–7037. [Google Scholar]
- 51.Decatur SM, Antonic J. J Am Chem Soc. 1999;121:11914–11915. [Google Scholar]
- 52.Huang CY, Getahun Z, Wang T, Degrado WF, Gai F. J Am Chem Soc. 2001;123:12111–12112. doi: 10.1021/ja016631q. [DOI] [PubMed] [Google Scholar]
- 53.Barua B, Lin JC, Williams VD, Kummler P, Neidigh JW, Andersen NH. Protein Eng, Des Sel. 2008;21:171–185. doi: 10.1093/protein/gzm082. [DOI] [PMC free article] [PubMed] [Google Scholar]
- 54.Fersht AR, Matouschek A, Serrano L. J Mol Biol. 1992;224:771–782. doi: 10.1016/0022-2836(92)90561-w. [DOI] [PubMed] [Google Scholar]
- 55.Barth A, Zscherp C. Q Rev Biophys. 2002;35:369–430. doi: 10.1017/s0033583502003815. [DOI] [PubMed] [Google Scholar]
- 56.Williams DV, Byrne A, Stewart J, Andersen NH. Biochemistry. 2011;50:1143–1152. doi: 10.1021/bi101555y. [DOI] [PMC free article] [PubMed] [Google Scholar]
- 57.Bagchi S, Falvo C, Mukamel S, Hochstrasser RM. J Phys Chem B. 2009;113:11260–11273. doi: 10.1021/jp900245s. [DOI] [PMC free article] [PubMed] [Google Scholar]
- 58.Kennedy DF, Crisma M, Toniolo C, Chapman D. Biochemistry. 1991;30:6541–6548. doi: 10.1021/bi00240a026. [DOI] [PubMed] [Google Scholar]
- 59.Silva RAGD, Yasui SC, Kubelka J, Formaggio F, Crisma M, Toniolo C, Keiderling TA. Biopolymers. 2002;65:229–243. doi: 10.1002/bip.10241. [DOI] [PubMed] [Google Scholar]
- 60.Williams S, Causgrove TP, Gilmanshin R, Fang KS, Callender RH, Woodruff WH, Dyer RB. Biochemistry. 1996;35:619–697. doi: 10.1021/bi952217p. [DOI] [PubMed] [Google Scholar]
- 61.Thompson PA, Eaton WA, Hofrichter J. Biochemistry. 1997;36:9200–9210. doi: 10.1021/bi9704764. [DOI] [PubMed] [Google Scholar]
- 62.Huang CY, Klemke JW, Getahun Z, DeGrado WF, Gai F. J Am Chem Soc. 2001;123:9235–9238. doi: 10.1021/ja0158814. [DOI] [PubMed] [Google Scholar]
- 63.Zhou RH. J Mol Graphics Modell. 2004;22:451–463. doi: 10.1016/j.jmgm.2003.12.011. [DOI] [PubMed] [Google Scholar]
- 64.Juraszek J, Bolhuis PG. Proc Natl Acad Sci USA. 2006;103:15859–15864. doi: 10.1073/pnas.0606692103. [DOI] [PMC free article] [PubMed] [Google Scholar]
- 65.Xu Y, Oyola R, Gai F. J Am Chem Soc. 2003;125:15388–15394. doi: 10.1021/ja037053b. [DOI] [PubMed] [Google Scholar]
- 66.Serrano AL, Tucker MJ, Gai F. J Phys Chem B. 2011;115:7472–7478. doi: 10.1021/jp200628b. [DOI] [PMC free article] [PubMed] [Google Scholar]
- 67.Mukherjee S, Chowdhury P, Bunagan MR, Gai F. J Phys Chem B. 2008;112:9146–9150. doi: 10.1021/jp801721p. [DOI] [PubMed] [Google Scholar]
- 68.Maity H, Maity M, Krishna MMG, Mayne L, Englander SW. Proc Natl Acad Sci USA. 2005;102:4741–4746. doi: 10.1073/pnas.0501043102. [DOI] [PMC free article] [PubMed] [Google Scholar]


