

Abstract
Huntington’s Disease (HD) is a neurodegenerative disease caused by a CAG triplet-repeat expansion-mutation in the Huntingtin gene. Subjects at risk for HD can be identified by genetic testing in the prodromal phase. Structural changes of basal-ganglia nuclei such as the caudate nucleus are well-replicated findings observable early in prodromal-HD subjects and may be preceded by distinct functional alterations of cortico-striatal circuits. This study aims to assess functional integrity of the motor system as a cortico-striatal circuit with particular clinical relevance in HD.
Ten subjects in the prodromal phase of HD and ten matched controls were administered blood oxygen level dependent (BOLD) functional magnetic resonance imaging (fMRI) at rest (3 Tesla). Functional connectivity was measured as synchrony of BOLD activity between the caudate nucleus and thirteen cortical brain regions (seeds). Basal-ganglia volumes were assessed as established markers of disease progression in prodromal-HD. Linear regression analysis was performed to test for a relationship between structural changes and group differences in functional connectivity.
Prodromal-HD subjects showed reduced BOLD synchrony between two seeds in the premotor cortex (BA6) and the caudate nucleus. While similar effect sizes could be observed for reduced basal-ganglia volumes and differences in functional connectivity, coefficients of determination indicate a moderate relationship between functional connectivity and striatal atrophy.
Our data show reduced cortico-striatal functional connectivity at rest in prodromal-HD and suggest a relation to early structural brain changes. Additional longitudinal studies are necessary to elucidate the temporal relationship between functional alterations and earliest structural brain changes in prodromal-HD.
Introduction
Huntington’s Disease (HD) is a neurodegenerative disease caused by a CAG repeat length expansion mutation in the Huntingtin Gene [20, 21]. After an initial prodromal phase, HD manifests with a characteristic triad of progressive motor-, cognitive and behavioral symptoms [39]. HD motor-symptoms are characterized early by chorea, incoordination and motor impersistence and later by dystonia, bradykinesia and rigidity [37, 45].
Neuropathological studies show damage of cortico-striatal components with neuronal loss in the cortex and the caudate nucleus in particular [44]. Neuroimaging studies using magnetic resonance imaging (MRI) are consistent with these data, indicating early characteristic structural alterations of striatal and cortical structures already in the prodromal phase [2, 33]. Particularly volume loss of the caudate and putamen have been demonstrated to be valid markers of disease progression [3-5], which is characterized by a general impairment of neural circuits linking basal ganglia and cortex [1, 11, 13]. This may be consistent with functional MRI (fMRI) data, demonstrating significant changes in neuronal activity in prodromal-HD [32, 36] involving distinct alterations of the motor system [25]. Functional connectivity is defined as synchronous blood oxygen level dependent (BOLD) activity of spatially segregated brain regions [19, 42] and distinct patterns of both positive and negative BOLD correlation are active at rest [7, 10, 12, 24]. In this context spontaneous fluctuations in the BOLD signal of resting state fMRI has been suggested to reflect basal neuronal activity within various networks involved in intrinsic brain function [18, 35]. In addition, altered interactions of neuronal populations measurable based on intrinsic functional connectivity may be a physiological correlate of various neuropsychiatric disorders [17, 43]. Altered functional connectivity has been reported for prodromal HD [46] and cortico-striatal BOLD synchrony in particular has been suggested to reflect early HD related pathology [28]. Functional connectivity analysis at rest appears particularly promising in HD, as it remains a central question whether there is independent degeneration in different brain regions or system degeneration due to functional connections [39]. However, at this point most fMRI studies on HD were performed during activation and to our knowledge no resting-state data has been published on functional integrity of cortico-striatal motor circuits.
We hypothesize that measuring functional connectivity at rest will reveal impaired interaction between the caudate nucleus and cortical regions in prodromal-HD versus unaffected healthy controls as a reflection of earliest disease related brain alterations. This study therefore focuses on probing functional integrity of the motor system as a cortico-striatal circuit with particular clinical relevance in HD and will assess its relationship with striatal atrophy.
Methods
Study population
Ten subjects CAG-expansion-positive for HD that were still in the prodromal phase of the disease, were recruited through the Huntington’s Disease Center at Johns Hopkins University School of Medicine. All prodromal-HD subjects received standardized neurological examination, using Quantified Neurological Exam-scores [16]. Estimated time to onset of motor symptoms was calculated based on CAG-repeat length of the mutated HTT allele and age [26], disease burden score (DBS) was calculated as [(CAG-repeat length −35.5) * age] [34]. Additionally ten age- and gender-matched control subjects were recruited through Johns Hopkins University. None of the 20 participants had a history of severe mood-, obsessive compulsive-, or psychotic disorders or substance abuse. Consent was obtained according to the Declaration of Helsinki [47] and approved by the Johns Hopkins University Institutional Review Board.
MRI and fMRI acquisition
MRI data was acquired at the FM Kirby Research Center for Functional Brain Imaging at Kennedy Krieger Institute on a Philips Intera 3T scanner (Philips Medical Systems, Best, the Netherlands) equipped with a SENSE head coil (eight elements radially positioned around the head).
Whole-brain anatomy was assessed using T1-weighted, three-dimensional Magnetization Prepared Rapid Gradient Echo (MP-RAGE) using the following parameters: TR=8.2ms; TE=3.8ms; flip angle=8°; 150 slices (no gap); FOV=256mm; nominal resolution=1×1×1mm; no gap; SENSE factor=2.0; total acquisition time=278 seconds.
Functional acquisitions were performed at 440 seconds open eye resting state using partially parallel accelerated gradient-echo (GE) echo planar imaging (EPI). They consisted of 37 slices in the axial plane, aligned parallel to the line from the anterior commisure to the posterior commisure using the following parameters: TR=2000ms; TE=30ms; flip angle=75°; FOV=240mm; nominal resolution = 3mm; no gap; SENSE factor = 2.0.
Post image acquisition analysis
Analysis of T1 MPRAGE images was performed using TOpology-preserving, Anatomy-Driven Segmentation (TOADS) with desired topology and relationships as given by a template (http://medic.rad.jhmi.edu/download/public/index.shtml) [6]. Resulting volumes of main cerebral structures were used for subsequent group comparisons of regional brain morphology.
Individual fMRI data were preprocessed by an initial correction for timing differences between slices, realignment, spatial normalization to Montreal Neurological Institute (MNI) template space. To minimize nuisance and partial volume bias, nuisance masks reflecting white matter (WM), cerebro spinal fluid (CSF) signal and motion were calculated. Residual volumes were generated by performing regression based on these masks and then smoothed with a 6mm3 full width half-maximum Gaussian kernel. A bandpass-filter (0.1-0.01Hz) was applied as a final step of preprocessing. Preprocessing was performed using the Statistical Parametric Mapping (SPM5) software package (http://www.fil.ion.ucl.ac.uk/spm/) and the MatLab with signal processing toolbox (Version 7.12, MathWorks Inc., Natick, Massachusetts, United States). The concept of measuring functional connectivity between regions of interest using anatomically defined seeds has been reviewed recently [24]. A total of thirteen 6mm diameter spherical gray matter regions of interest (referred to as “seeds” to test for connectivity with other regions) were generated based on anatomical information in talairach space [40] including eleven cortical and subcortical-regions in the motor-system (Caudate Nucleus, Globus Pallidus (G.P.), Thalamus (Pulvinar), premotor area (Brodmann Area (BA) 6 (1,2) and anterior cingulate cortex (BA 32), supplementary motor area (BA 6 (3-5), primary motor cortex (BA 4 (1-2)). As negative controls, two additional tests were performed with seeds located in brain regions not primarily involved in motor control and not expected to be mainly affected in early HD [4] (Cuneus, BA 18 and parahippocampal gyrus, BA 35). These regions of interest (seeds) were used to test for BOLD-synchrony with the Caudate Nucleus (26,45) (Figure 1). All included cortical regions are well known to connect to the striatum [1, 14].
Figure 1.
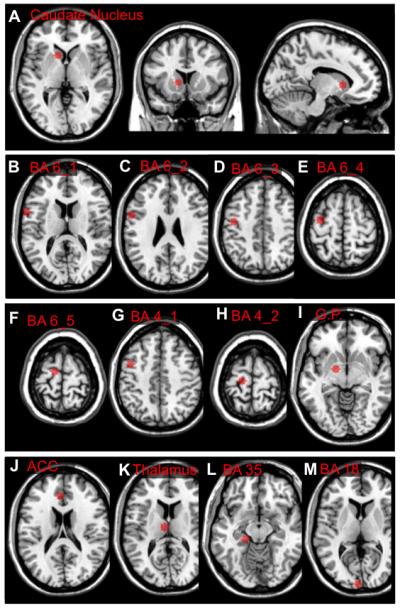
Overview of the brain regions included by the seeds used for analysis of BOLD synchrony (talairach coordinates: x;y;z): A) Caudate Nucleus, body (−12;10;16), B) BA 6_1, Lateral Premotor Area (−57;3;16), C) BA 6_2, Lateral Premotor Area (−57;2;28), D) BA 6_3, Premotor Area (−42;−15;44), E) BA 6_4, Supplementary Motor Area (−33;−14;63), F) BA 6_5, Supplementary Motor Area (−12;−17;65), G) BA 4_1, Primary Motor Cortex (−42;−15;44), H) BA 4_2, Primary Motor Cortex (−18;−26;65), I) Globus Pallidus (−15;−4;−2), J) BA 32, Anterior Cingulate (−5, 29, 25), K) Thalamus (−7;−15;14), L) BA 35, Parahippocampal Gyrus (−20;−27;−11), M) BA 18, Cuneus (−5; −100; 8).
Statistics
Statistical analyses were performed using SPSS for Windows (version 17.0, SPSS Inc, Chicago, IL, USA). Group differences of BOLD-synchrony were assessed using Fisher r to z transformation of the individuals correlation coefficients to normal distribution [15], followed by independent sample t-tests (MatLab 7.12, statistics toolbox). Effect sizes were estimated as Cohen’s d. We predicted that BOLD-synchrony would be lower between components of the motor system and compared BOLD synchrony between seeds in the caudate nucleus and motor system, adjusting alpha (5%) by applying Bonferroni correction for performing twelve tests [22]. Linear regression analysis was performed to estimate coefficients of determination (r2) for striatal atrophy (putamen and caudate-volumes) and significantly differing BOLD correlation coefficients of HD-subjects, using z-scores in reference to the mean values of the healthy control group. Age and sex were used as covariates and did not affect measures of correlation significantly.
Results
Subject characteristics
Group demographics for the 20 individuals included in this study (ten unaffected controls, ten expansion positive individuals in the prodromal phase of HD) are displayed in table 1. The mean total QNE and also chorea subscore reflect only non-HD specific neurological symptoms, subjects with manifest HD usually have total QNE scores significantly above 20 [9, 16].
Table 1.
a ) Demographics of the study populations and b) volumes (ml) of brain tissues and regions (group averages, standard deviations).
| Controls | Prodromal HD | T-test (p) | |
|---|---|---|---|
| a) Demographics | |||
| N | 10 | 10 | - |
| Females; Males | 6; 4 | 4; 6 | - |
| Age | 42.3 (11) | 44 (9.2) | 0.71 |
| CAG repeat length | - | 42.8 (1.5) | - |
| Estimated Years to onset (YTO) | - | 10.4 (6.3) | - |
| Disease Burden Score (DBS) | - | 316.6 (71.7) | - |
| QNE, total score | - | 4 (8.7) | - |
| QNE, chorea subscore | - | 0.9 (2.5) | - |
| b) Volumes | |||
| Sulcal CSF | 281 (40) | 274 (27) | 0.64 |
| Ventricles | 22 (11) | 22 (12) | 0.93 |
| Cerebellar GM | 84 (8.7) | 83 (8.4) | 0.79 |
| Cerebral GM | 524 (53) | 510 (44) | 0.53 |
| Caudate | 9.5 (0.6) | 7.5 (1.4) | * 0.01 |
| Thalamus | 19 (1.3) | 19 (1.1) | 0.59 |
| Putamen | 12 (1) | 10 (1.1) | * 0.03 |
| Brainstem | 21 (2.5) | 21 (2.8) | 0.91 |
| Cerebellar WM | 31 (5.1) | 30 (3.9) | 0.48 |
| Cerebral WM | 467 (71) | 450 (25) | 0.48 |
Group comparisons of brain morphology between controls and HD subjects
Measures of brain morphology as assessed by cortical and subcortical segmentation indicate significantly reduced caudate (p=0.01, effect size=1.9) and putaminal volumes (p=0.03, effect size=1.9) in prodromal-HD subjects compared to controls. While cerebral gray- and white matter volumes tend to be lower in prodromal-HD, differences are not significant. None of the other measured cerebral structures and brain tissue components differed significantly between prodromal-HD and controls (Table 1).
Reduced cortico-striatal BOLD synchrony in prodromal-HD subjects
Seed based BOLD synchrony with the Caudate Nucleus was assessed for a total of twelve brain regions (figure 1), correlation coefficients were converted to z-values using Fisher r to z transformation [15]. Independent samples t-tests of the converted z-values of all twelve regions revealed significantly lower BOLD synchrony in prodromal-HD between the caudate nucleus and seeds in BA6, which remained significant after correction for multiple testing and indicate reduced cortico-striatal functional connectivity compared to controls, with a moderate degree of variance explained by caudate atrophy (BA 6_2: controls 0.28 (SE:0.05), prodromal-HD −0.08 (SE:0.08), p=0.001, effect size=1.8, caudate r2=0.3, p=0.09, putamen r2=0.13, p=0.30; BA 6_3: controls 0.21 (SE:0.04), prodromal-HD 0.02 (SE:0.04), p=0.004, effect size=1.6, caudate r2=0.4, p=0.04, putamen r2=0.2, p=0.25) (figure 2). Seeds in adjacent regions showed trends of lower BOLD synchrony in prodromal-HD subjects (BA 6_1: controls 0.21 (SE:0.06), prodromal-HD 0.01 (SE:0.08), p=0.054, effect size=0.9; BA 4_1: controls 0.12 (SE:0.06), prodromal-HD −0.09 (SE:0.08), p=0.051, effect size=1.0). Also correlation analysis between the caudate and the globus pallidus showed a trend of reduced BOLD synchrony in prodromal-HD subjects (G.P.: controls 0.11 (SE:0.06), prodromal-HD −0.09 (SE:0.09), p=0.07, effect size=0.9). This trend of reduced BOLD synchrony between cortico-striatal structures of the motor system in prodromal-HD subjects could not be observed for seeds in parahippocampal gyrus (BA 35), Anterior Cingulate (BA 32) and Cuneus (BA18) (BA 35: controls −0.19 (SE:0.08), prodromal-HD −0.13 (SE:0.05), p=0.57, effect size=−0.3; BA 32: controls 0.12 (SE:0.08), prodromal-HD 0.18 (SE:0.06), p=0.53, effect size=−0.3; BA 18: controls −0.12 (SE:0.08), prodromal-HD −0.10 (SE:0.06), p=0.82, effect size=−0.1).
Figure 2.

Correlation coefficients (pearson r) for 11 brain regions (B-M) reflecting group averages of BOLD synchrony at rest with the Caudate Nucleus.
Discussion
Our data show significantly reduced BOLD synchrony between seeds representing the caudate nucleus and lateral premotor area, indicating impaired cortico-striatal functional connectivity as a correlate of brain changes in prodromal-HD.
To our knowledge this is the first study reporting impaired functional connectivity at rest between motor cortex and the caudate nucleus in prodromal-HD subjects. Relevance for motor circuits is indicated by the fact that functional connectivity between the caudate and cortical regions not involved in motor control (parahippocampal gyrus and cuneus) did not differ significantly between controls and prodromal-HD subjects. Our data is consistent with earlier reports on brain network alterations in early HD that involve impaired cortico-striatal circuit integrity at early disease stages both in humans and also genetic mice models [8, 11, 14, 23]. Functional connectivity analysis appears to be particularly suited to address the question of HD related alterations of brain networks at rest [7, 12]. We have used a seed based approach, allowing us to address the specific hypothesis of altered cortico-striatal interaction in prodromal-HD, reflected in particular by reduced BOLD synchrony between cortical and striatal components of the motor system.
While there are significant conceptual differences to multivariate approaches of measuring functional connectivity such as independent component analysis (ICA), results from seed-based and ICA methodologies are generally similar [24]. While there is consistent evidence for characteristic structural changes developing early in prodromal-HD [2, 4, 33, 38], functional markers of disease progression have been speculated to reflect even earlier pathological processes [32, 36]. In our sample both functional alterations and the earlier reported characteristic structural changes involving reduced volumes of the caudate nucleus and putamen were observable with similar effect sizes in prodromal-HD. As striatal atrophy explained only a moderate degree of the differences in functional connectivity, this might reflect different pathological processes active in parallel. However, the temporal relationship between functional and structural brain alterations observable in our data remains unclear due to the cross-sectional design of this study. While the biological underpinnings of reduced BOLD synchrony between spatially distinct brain regions in prodromal HD still remain largely unclear, it may reflect disease related biochemical processes affecting cellular viability such as decreased transport and release of brain derived neurotrophic factor (BDNF) but also excitotoxic effects in cortico-striatal neurons in a context of dysregulated glutamate metabolism [11, 39]. Impaired function of affected neuronal populations may go along with reduced BOLD synchrony [48] within cortico-striatal loops of the motor-system, progressing to sensorimotor striatal degeneration at later disease stages [8]. On a systems level this may result in clinical symptoms such as cognitive and behavioral deficits, which are observable in the prodromal phase of HD and have been demonstrated to be associated with cortico-striatal dysfunction, which may be consistent with the lower degree of spontaneous BOLD synchrony observable in our data [27, 29, 31, 39].
A limitation of our study is the small sample size, which limited power for secondary regression analysis of relevant clinical parameters. Furthermore the fact, that beyond the standardized neurologic examination no neuropsychological and behavioral assessment was performed. This may be a promising approach of expanding the here presented study on earliest functional alterations in prodromal HD, as dysfunction of loops involving cortical regions and the caudate have been shown to relate to behavioral manifestations of brain pathology in HD [29, 30, 41].
Conclusion
By measuring BOLD-synchrony between the caudate nucleus and the motor cortex, we find evidence for impaired cortico-striatal functional connectivity in prodromal-HD subjects which shows similar effect size as striatal atrophy. Further longitudinal studies may help to elucidate temporal aspects of the relationship between functional and structural brain alterations in prodromal-HD.
Highlights.
Dysfunction of cortico-striatal circuits may precede structural changes in prodromal HD
This is the first report on dysfunctional cortico-striatal connectivity at rest in HD
Particularly the caudate nucleus and the premotor cortex appear affected
These measures may serve as response markers for neuroprotective treatment approaches
Acknowledgements
This study was made possible by grant support from NINDS NS16375, NIH-NCRR P41-RR015241 and P50AG005146. Dr. Paul G. Unschuld is supported by NIH-T32MH015330. We thank Nadine Yoritomo and Morgan Writhenour of the Baltimore Huntington’s Disease Center (BHDC) at Johns Hopkins Hospital for support in study organization. We thank Terri Brawner, Ivana Kusevic and Kathleen Kahl of the F.M.Kirby Research Center and Guillermo Verduzco of the Division of Psychiatric Neuroimaging for their technical assistance. The National Center for Research Resources (NCRR) is a component of the National Institutes of Health (NIH). The contents of the paper are solely the responsibility of the authors and do not necessarily represent the official view of NCRR or NIH. Equipment used in the study is manufactured by Philips. Dr. van Zijl is a paid lecturer for Philips Medical Systems and the inventor of technology that is licensed to Philips.
Footnotes
Disclosure This arrangement has been approved by Johns Hopkins University in accordance with its conflict of interest policies. All authors have approved the final version of this article and have participated in the research and preparation of the article: 1. Research Project: A) Conception: PGU, CAR; B) Organisation: PGU, MS, GR, CAR; C) Execution: PGU, SEJ, XL, RLM; 2. Statistical Analysis: A) Design: PGU, CAR; B) Execution: PGU, SEJ, AC, XL, XW; C) Review and Critique: PGU, SEJ, AC, XL, MS, XW, DJS, KMB, SSB, GR, RLM, PCMvZ, JJP, CAR; 3. Manuscript: A) Writing of the first draft: PGU; B) Review and Critique: SEJ, AC, XL, MS, XW, DJS, KMB, SSB, GR, RLM, PCMvZ, JJP, CAR.
Publisher's Disclaimer: This is a PDF file of an unedited manuscript that has been accepted for publication. As a service to our customers we are providing this early version of the manuscript. The manuscript will undergo copyediting, typesetting, and review of the resulting proof before it is published in its final citable form. Please note that during the production process errors may be discovered which could affect the content, and all legal disclaimers that apply to the journal pertain.
References
- [1].Alexander GE, DeLong MR, Strick PL. Parallel organization of functionally segregated circuits linking basal ganglia and cortex. Annu Rev Neurosci. 1986;9:357–381. doi: 10.1146/annurev.ne.09.030186.002041. [DOI] [PubMed] [Google Scholar]
- [2].Aylward EH. Change in MRI striatal volumes as a biomarker in preclinical Huntington’s disease. Brain Res Bull. 2007;72:152–158. doi: 10.1016/j.brainresbull.2006.10.028. [DOI] [PubMed] [Google Scholar]
- [3].Aylward EH, Li Q, Stine OC, Ranen N, Sherr M, Barta PE, Bylsma FW, Pearlson GD, Ross CA. Longitudinal change in basal ganglia volume in patients with Huntington’s disease. Neurology. 1997;48:394–399. doi: 10.1212/wnl.48.2.394. [DOI] [PubMed] [Google Scholar]
- [4].Aylward EH, Nopoulos PC, Ross CA, Langbehn DR, Pierson RK, Mills JA, Johnson HJ, Magnotta VA, Juhl AR, Paulsen JS. Longitudinal change in regional brain volumes in prodromal Huntington disease. J Neurol Neurosurg Psychiatry. 2010 doi: 10.1136/jnnp.2010.208264. [DOI] [PMC free article] [PubMed] [Google Scholar]
- [5].Aylward EH, Rosenblatt A, Field K, Yallapragada V, Kieburtz K, McDermott M, Raymond LA, Almqvist EW, Hayden M, Ross CA. Caudate volume as an outcome measure in clinical trials for Huntington’s disease: a pilot study. Brain Res Bull. 2003;62:137–141. doi: 10.1016/j.brainresbull.2003.09.005. [DOI] [PubMed] [Google Scholar]
- [6].Bazin PL, Pham DL. Topology-preserving tissue classification of magnetic resonance brain images. IEEE Trans Med Imaging. 2007;26:487–496. doi: 10.1109/TMI.2007.893283. [DOI] [PubMed] [Google Scholar]
- [7].Biswal B, Yetkin FZ, Haughton VM, Hyde JS. Functional connectivity in the motor cortex of resting human brain using echo-planar MRI. Magn Reson Med. 1995;34:537–541. doi: 10.1002/mrm.1910340409. [DOI] [PubMed] [Google Scholar]
- [8].Bohanna I, Georgiou-Karistianis N, Egan GF. Connectivity-based segmentation of the striatum in Huntington’s disease: vulnerability of motor pathways. Neurobiol Dis. 2011;42:475–481. doi: 10.1016/j.nbd.2011.02.010. [DOI] [PubMed] [Google Scholar]
- [9].Brandt J, Bylsma FW, Gross R, Stine OC, Ranen N, Ross CA. Trinucleotide repeat length and clinical progression in Huntington’s disease. Neurology. 1996;46:527–531. doi: 10.1212/wnl.46.2.527. [DOI] [PubMed] [Google Scholar]
- [10].Buckner RL, Sepulcre J, Talukdar T, Krienen FM, Liu H, Hedden T, Andrews-Hanna JR, Sperling RA, Johnson KA. Cortical hubs revealed by intrinsic functional connectivity: mapping, assessment of stability, and relation to Alzheimer’s disease. J Neurosci. 2009;29:1860–1873. doi: 10.1523/JNEUROSCI.5062-08.2009. [DOI] [PMC free article] [PubMed] [Google Scholar]
- [11].Cepeda C, Wu N, Andre VM, Cummings DM, Levine MS. The corticostriatal pathway in Huntington’s disease. Prog Neurobiol. 2007;81:253–271. doi: 10.1016/j.pneurobio.2006.11.001. [DOI] [PMC free article] [PubMed] [Google Scholar]
- [12].Damoiseaux JS, Rombouts SA, Barkhof F, Scheltens P, Stam CJ, Smith SM, Beckmann CF. Consistent resting-state networks across healthy subjects. Proc Natl Acad Sci U S A. 2006;103:13848–13853. doi: 10.1073/pnas.0601417103. [DOI] [PMC free article] [PubMed] [Google Scholar]
- [13].Dumas EM, van den Bogaard SJ, Ruber ME, Reilman RR, Stout JC, Craufurd D, Hicks SL, Kennard C, Tabrizi SJ, van Buchem MA, van der Grond J, Roos RA. Early changes in white matter pathways of the sensorimotor-cortex in premanifest Huntington’s disease. Hum Brain Mapp. 2011 doi: 10.1002/hbm.21205. [DOI] [PMC free article] [PubMed] [Google Scholar]
- [14].Eidelberg D, Surmeier DJ. Brain networks in Huntington disease. J Clin Invest. 2011;121:484–492. doi: 10.1172/JCI45646. [DOI] [PMC free article] [PubMed] [Google Scholar]
- [15].Fisher AO. Frequency Distribution of the Values of the Correlation Coefficient in Samples from an Indefinitely Large Population. Biometrika. 1915;10:522–529. [Google Scholar]
- [16].Folstein SE, Jensen B, Leigh RJ, Folstein MF. The measurement of abnormal movement: methods developed for Huntington’s disease. Neurobehav Toxicol Teratol. 1983;5:605–609. [PubMed] [Google Scholar]
- [17].Fox MD, Raichle ME. Spontaneous fluctuations in brain activity observed with functional magnetic resonance imaging. Nat Rev Neurosci. 2007;8:700–711. doi: 10.1038/nrn2201. [DOI] [PubMed] [Google Scholar]
- [18].Fox MD, Snyder AZ, Vincent JL, Corbetta M, Van Essen DC, Raichle ME. The human brain is intrinsically organized into dynamic, anticorrelated functional networks. Proc Natl Acad Sci U S A. 2005;102:9673–9678. doi: 10.1073/pnas.0504136102. [DOI] [PMC free article] [PubMed] [Google Scholar]
- [19].Friston KJ, Frith CD, Liddle PF, Frackowiak RS. Functional connectivity: the principal-component analysis of large (PET) data sets. J Cereb Blood Flow Metab. 1993;13:5–14. doi: 10.1038/jcbfm.1993.4. [DOI] [PubMed] [Google Scholar]
- [20].Gusella JF, McNeil S, Persichetti F, Srinidhi J, Novelletto A, Bird E, Faber P, Vonsattel JP, Myers RH, MacDonald ME. Huntington’s disease. Cold Spring Harb Symp Quant Biol. 1996;61:615–626. [PubMed] [Google Scholar]
- [21].HD_Collaborative_Research_Group A novel gene containing a trinucleotide-repeat that is expanded and unstable on Huntington’s disease chromosomes. The Huntington’s Disease Collaborative Research Group. Cell. 1993;72:971–983. doi: 10.1016/0092-8674(93)90585-e. [DOI] [PubMed] [Google Scholar]
- [22].Holm S. A Simple Sequentially Rejective Bonferroni Test Procedure. Scandinavian Journal of Statistics. 1979;6:65–70. [Google Scholar]
- [23].Joel D. Open interconnected model of basal ganglia-thalamocortical circuitry and its relevance to the clinical syndrome of Huntington’s disease. Mov Disord. 2001;16:407–423. doi: 10.1002/mds.1096. [DOI] [PubMed] [Google Scholar]
- [24].Joel SE, Caffo BS, van Zijl PC, Pekar JJ. On the relationship between seed-based and ICA-based measures of functional connectivity. Magn Reson Med. 2011 doi: 10.1002/mrm.22818. [DOI] [PMC free article] [PubMed] [Google Scholar]
- [25].Klöppel S, Draganski B, Siebner HR, Tabrizi SJ, Weiller C, Frackowiak RS. Functional compensation of motor function in pre-symptomatic Huntington’s disease. Brain. 2009;132:1624–1632. doi: 10.1093/brain/awp081. [DOI] [PMC free article] [PubMed] [Google Scholar]
- [26].Langbehn DR, Brinkman RR, Falush D, Paulsen JS, Hayden MR. A new model for prediction of the age-of-onset and penetrance for Huntington’s disease based on CAG length. Clin Genet. 2004;65:267–277. doi: 10.1111/j.1399-0004.2004.00241.x. [DOI] [PubMed] [Google Scholar]
- [27].Marder K, Zhao H, Myers RH, Cudkowicz M, Kayson E, Kieburtz K, Orme C, Paulsen J, Penney JB, Jr., Siemers E, Shoulson I. Rate of functional decline in Huntington’s disease. Huntington Study Group. Neurology. 2000;54:452–458. doi: 10.1212/wnl.54.2.452. [DOI] [PubMed] [Google Scholar]
- [28].Marrakchi-Kacem L, Delmaire C, Tucholka A, Roca P, Guevara P, Poupon F, Yelnik J, Durr A, Mangin JF, Lehericy S, Poupon C. Analysis of the striato-thalamo-cortical connectivity on the cortical surface to infer biomarkers of Huntington’s disease. Med Image Comput Comput Assist Interv. 2010;13:217–224. doi: 10.1007/978-3-642-15745-5_27. [DOI] [PubMed] [Google Scholar]
- [29].Mayberg HS. Limbic-cortical dysregulation: a proposed model of depression. J Neuropsychiatry Clin Neurosci. 1997;9:471–481. doi: 10.1176/jnp.9.3.471. [DOI] [PubMed] [Google Scholar]
- [30].Mayberg HS. Modulating dysfunctional limbic-cortical circuits in depression: towards development of brain-based algorithms for diagnosis and optimised treatment. Br Med Bull. 2003;65:193–207. doi: 10.1093/bmb/65.1.193. [DOI] [PubMed] [Google Scholar]
- [31].Mayberg HS, Starkstein SE, Peyser CE, Brandt J, Dannals RF, Folstein SE. Paralimbic frontal lobe hypometabolism in depression associated with Huntington’s disease. Neurology. 1992;42:1791–1797. doi: 10.1212/wnl.42.9.1791. [DOI] [PubMed] [Google Scholar]
- [32].Paulsen JS. Functional imaging in Huntington’s disease. Exp Neurol. 2009;216:272–277. doi: 10.1016/j.expneurol.2008.12.015. [DOI] [PMC free article] [PubMed] [Google Scholar]
- [33].Paulsen JS, Magnotta VA, Mikos AE, Paulson HL, Penziner E, Andreasen NC, Nopoulos PC. Brain structure in preclinical Huntington’s disease. Biol Psychiatry. 2006;59:57–63. doi: 10.1016/j.biopsych.2005.06.003. [DOI] [PubMed] [Google Scholar]
- [34].Penney JB, Jr., Vonsattel JP, MacDonald ME, Gusella JF, Myers RH. CAG repeat number governs the development rate of pathology in Huntington’s disease. Ann Neurol. 1997;41:689–692. doi: 10.1002/ana.410410521. [DOI] [PubMed] [Google Scholar]
- [35].Raichle ME. Two views of brain function. Trends Cogn Sci. 2010;14:180–190. doi: 10.1016/j.tics.2010.01.008. [DOI] [PubMed] [Google Scholar]
- [36].Reading SA, Dziorny AC, Peroutka LA, Schreiber M, Gourley LM, Yallapragada V, Rosenblatt A, Margolis RL, Pekar JJ, Pearlson GD, Aylward E, Brandt J, Bassett SS, Ross CA. Functional brain changes in presymptomatic Huntington’s disease. Ann Neurol. 2004;55:879–883. doi: 10.1002/ana.20121. [DOI] [PubMed] [Google Scholar]
- [37].Reilmann R, Bohlen S, Klopstock T, Bender A, Weindl A, Saemann P, Auer DP, Ringelstein EB, Lange HW. Tongue force analysis assesses motor phenotype in premanifest and symptomatic Huntington’s disease. Mov Disord. 2010;25:2195–2202. doi: 10.1002/mds.23243. [DOI] [PubMed] [Google Scholar]
- [38].Rosas HD, Salat DH, Lee SY, Zaleta AK, Pappu V, Fischl B, Greve D, Hevelone N, Hersch SM. Cerebral cortex and the clinical expression of Huntington’s disease: complexity and heterogeneity. Brain. 2008;131:1057–1068. doi: 10.1093/brain/awn025. [DOI] [PMC free article] [PubMed] [Google Scholar]
- [39].Ross CA, Tabrizi SJ. Huntington’s disease: from molecular pathogenesis to clinical treatment. Lancet Neurol. 2011;10:83–98. doi: 10.1016/S1474-4422(10)70245-3. [DOI] [PubMed] [Google Scholar]
- [40].Talairach J, Tournoux P. A Co-Planar Stereotaxic Atlas of a Human Brain. Georg Thieme Verlag, Thieme; Stuttgart: 1988. [Google Scholar]
- [41].Thu DC, Oorschot DE, Tippett LJ, Nana AL, Hogg VM, Synek BJ, Luthi-Carter R, Waldvogel HJ, Faull RL. Cell loss in the motor and cingulate cortex correlates with symptomatology in Huntington’s disease. Brain. 2010;133:1094–1110. doi: 10.1093/brain/awq047. [DOI] [PubMed] [Google Scholar]
- [42].van de Ven VG, Formisano E, Prvulovic D, Roeder CH, Linden DE. Functional connectivity as revealed by spatial independent-component-analysis of fMRI measurements during rest. Hum Brain Mapp. 2004;22:165–178. doi: 10.1002/hbm.20022. [DOI] [PMC free article] [PubMed] [Google Scholar]
- [43].Van Dijk KR, Hedden T, Venkataraman A, Evans KC, Lazar SW, Buckner RL. Intrinsic functional connectivity as a tool for human connectomics: theory, properties, and optimization. J Neurophysiol. 2010;103:297–321. doi: 10.1152/jn.00783.2009. [DOI] [PMC free article] [PubMed] [Google Scholar]
- [44].Vonsattel JP, DiFiglia M. Huntington disease. J Neuropathol Exp Neurol. 1998;57:369–384. doi: 10.1097/00005072-199805000-00001. [DOI] [PubMed] [Google Scholar]
- [45].Walker FO. Huntington’s disease. Lancet. 2007;369:218–228. doi: 10.1016/S0140-6736(07)60111-1. [DOI] [PubMed] [Google Scholar]
- [46].Wolf RC, Sambataro F, Vasic N, Schonfeldt-Lecuona C, Ecker D, Landwehrmeyer B. Aberrant connectivity of lateral prefrontal networks in presymptomatic Huntington’s disease. Exp Neurol. 2008;213:137–144. doi: 10.1016/j.expneurol.2008.05.017. [DOI] [PubMed] [Google Scholar]
- [47].World_Medical_Association Declaration of Helsinki. Law Med Health Care. 1991;19:264–265. [PubMed] [Google Scholar]
- [48].Zhang D, Raichle ME. Disease and the brain’s dark energy. Nat Rev Neurol. 2010;6:15–28. doi: 10.1038/nrneurol.2009.198. [DOI] [PubMed] [Google Scholar]