Abstract
Novel biomarkers of disease progression after type 1 diabetes onset are needed. We profiled peripheral blood (PB) monocyte gene expression in six healthy subjects and 16 children with type 1 diabetes diagnosed ∼3 months previously and analyzed clinical features from diagnosis to 1 year. Monocyte expression profiles clustered into two distinct subgroups, representing mild and severe deviation from healthy control subjects, along the same continuum. Patients with strongly divergent monocyte gene expression had significantly higher insulin dose–adjusted HbA1c levels during the first year, compared with patients with mild deviation. The diabetes-associated expression signature identified multiple perturbations in pathways controlling cellular metabolism and survival, including endoplasmic reticulum and oxidative stress (e.g., induction of HIF1A, DDIT3, DDIT4, and GRP78). Quantitative PCR (qPCR) of a 9-gene panel correlated with glycemic control in 12 additional recent-onset patients. The qPCR signature was also detected in PB from healthy first-degree relatives. A PB gene expression signature correlates with glycemic control in the first year after diabetes diagnosis and is present in at-risk subjects. These findings implicate monocyte phenotype as a candidate biomarker for disease progression pre- and postonset and systemic stresses as contributors to innate immune function in type 1 diabetes.
The most promising stage for therapeutic intervention in type 1 diabetes is presently at diagnosis, with the goal of prolonging remission and preserving residual β-cell mass. However, the rate of type 1 diabetes progression is heterogeneous and unpredictable. The quality of glycemic control in early disease has far-reaching implications for disease progression and the development of diabetes complications (1). Younger age, presentation with diabetic ketoacidosis, a history of viral infection, or low adiponectin (a marker of insulin resistance) have been associated with a low frequency of remission (2–4), but no biomarkers offering insight into the immunological basis of disease progression have so far been identified. Such biomarkers would also assist trial design. For example, immunotherapies in recent trials temporarily delayed disease progression, but treated patients eventually deteriorated on a similar trajectory to control subjects (5).
The versatile cells of the innate immune system, including peripheral blood (PB) monocytes and their differentiated tissue progeny, macrophages, and dendritic cells (DCs), are powerful sensors of stress and danger and mediators of tissue repair. In their role as antigen presenting cells, they orchestrate adaptive immune responses to both endogenous and pathogen-mediated host damage. Paradoxically, innate immune activation may play both pathological and protective roles in type 1 diabetes, depending on disease stage and context (6). At a molecular level, there is substantial evidence for dysregulated innate immunity in type 1 diabetes (7–10), both before and after disease onset. Activated macrophages and DCs are observed in rodent pancreatic islets before lymphocyte recruitment and are thought to be the primary source of the proinflammatory cytokines tumor necrosis factor (TNF), interleukin (IL)-6, and IL-1β that are implicated in type 1 diabetes pathogenesis (11). Macrophages are also found in islets from recent-onset type 1 diabetic patients (12). In contrast with their proinflammatory roles, macrophages also have immunoregulatory and tissue repair roles, which may be critical in restraining β-cell destruction. Diabetes was exacerbated in mice that lack colony stimulating factor (CSF)-1–dependent pancreatic macrophages, whereas macrophages promoted β-cell survival and function in a CSF-1–dependent manner (13,14).
We hypothesized that PB monocyte phenotype and function constitute sensitive indicators of the prodiabetes microenvironment, making them ideal biomarkers of innate immune status in type 1 diabetes. Previous PB screening approaches identified proinflammatory signatures, although these studies were in mixed cell populations and were frequently complicated by the proinflammatory effects of hyperglycemia (8,9). We characterized monocyte gene expression in insulin-treated type 1 diabetic patients 3 months after disease onset and analyzed clinical features from diagnosis to 1 year. We report a PB monocyte expression profile, which clinically stratifies glycemic control within the first year after type 1 diabetes diagnosis.
RESEARCH DESIGN AND METHODS
Study population.
Sixteen children with recently diagnosed type 1 diabetes (∼3 months postdiagnosis; Table 1) were recruited at the Mater Children’s Hospital during 2009 and 2010. Informed consent was obtained from all participants, and the studies were approved by the Mater Health Services and Princess Alexandra Hospital Human Research Ethics Committees. Consenting adult blood donors were used as healthy control subjects for the microarray study (33% female, mean [SD] age 32 years (8.2 years), BMI 24.5 [1.2]), whereas age-matched children without a family history of autoimmune disease recruited from operation list patients awaiting nonurgent surgery served as control subjects for flow cytometry and peripheral blood mononuclear cell (PBMC) quantitative PCR (qPCR) (mean age [SD] 10 years [4.2 years]). Blood samples were obtained from first-degree relatives (FDR) of type 1 diabetic patients with informed consent (mean age [SD] 9 years (3.9 years). Insulin dose–adjusted glycosylated hemoglobin (HbA1c) (IDAA1c) was calculated as %HbA1c + 4 × (insulin dose [units/kg/day]) (15). Diabetic ketoacidosis (DKA) at presentation was defined as <22 mmol/L plasma bicarbonate.
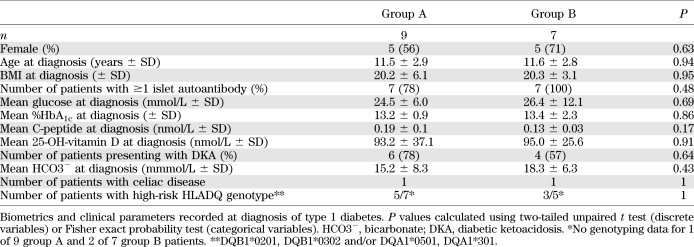
TABLE 1.
Characteristics of group A and group B type 1 diabetic patients at diagnosis
Monocyte purification, expression profiling, and qPCR.
CD14+ monocytes were purified from Ficoll-purified PBMC by positive selection (MACS, Miltenyi). Total RNA was purified from CD14+ monocytes using RNeasy Mini columns, with on-column DNase digestion (Qiagen). RNA from the donors selected for microarray (500 ng; Agilent Bioanalyzer RNA Integrity Score >8) was amplified using the Totalprep RNA amplification kit (Ambion). Amplified RNA was hybridized to Illumina HT-12 v3.0 whole genome beadarrays, according to the manufacturer’s instructions. Beadarrays were scanned on an Illumina iScan, and raw data were exported from BeadStudio (Illumina) for further analysis. Gene expression data have been deposited in the gene expression omnibus (GEO) database (GSE33440, Reviewer Access: http://www.ncbi.nlm.nih.gov/geo/query/acc.cgi?token=dvezxukmesmsohe&acc=GSE33440). Data were variance stabilized and quantile normalized using the Lumi package in R (Bioconductor, http://www.bioconductor.org/packages/2.0/bioc/html/lumi.html), followed by clustering and differential expression analysis in GenespringGX (Agilent). Probes that did not achieve an Illumina Detection P value = 0 in ≥1 sample were omitted from the analysis. Genes whose expression was significantly correlated with plasma glucose or %HbA1c were identified by quantitative trait analysis in BRB-ArrayTools, developed by Dr. Richard Simon and the BRB-ArrayTools Development Team (Pearson correlation, P < 0.001). Probes identified as significantly up- or downregulated in T1D-B monocytes were analyzed for ontology enrichment using Database for Annotation, Visualization and Integrated Discovery (DAVID; http://david.abcc.ncifcrf.gov/). Functional Annotation Charts generated using Level 4 Bioprocess Gene Ontology terms, with the Illumina HT-12 genome as background, were manually curated to remove redundant annotations. OligodT-primed cDNA was synthesized from 1 μg RNA (Quantace). qPCR was performed using Sensimix SYBR mastermix (Quantace) on an Agilent HT-7900. Gene expression relative to hypoxanthine-guanine phosphoribosyltransferase was calculated using the ΔCt method. Median-normalized qPCR data were clustered in GenespringGX. qPCR primer sequences used in this study appear in Supplementary Table 1.
Flow cytometry.
Whole blood (50 μL) was stained with anti–CD14-FITC, anti–CD16-PacificBlue, anti–CX3CR1-Alexa647, or corresponding isotype controls (Biolegend or Becton Dickinson) and Aqua live/dead discriminator (Invitrogen) for 20 min. Erythrocytes were lysed with the addition of 450 μL FACS Lysing Solution (Becton Dickinson) for 5 min, followed by sample fixation with 100 μL of 1% formalin immediately before analysis on a Gallios flow cytometer (Beckman Coulter). Live, CD14+ cells were analyzed for CD14, CD16, and CX3CR1 expression, with gates set according to negative controls, which contained the isotype control for each antibody, as well as the rest of the antibodies in the staining panel. Kaluza (Beckman Coulter) was used for flow cytometry compensation and analysis.
Statistical analysis.
Except for microarray analysis, all statistical tests were calculated in GraphPad Prism. Comparisons between groups were made with unpaired t test or ANOVA; F test was used to check whether variances were equal, and appropriate tests were used: unpaired t test if variances were equal, with Welch’s correction if variances were unequal. Categorical variables were compared using the Fisher exact probability test.
RESULTS
Stratification of type 1 diabetic patients by monocyte expression profile at diagnosis.
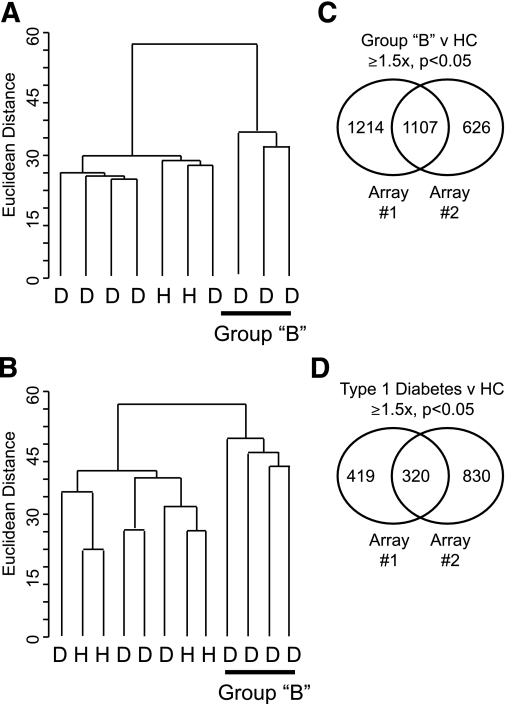
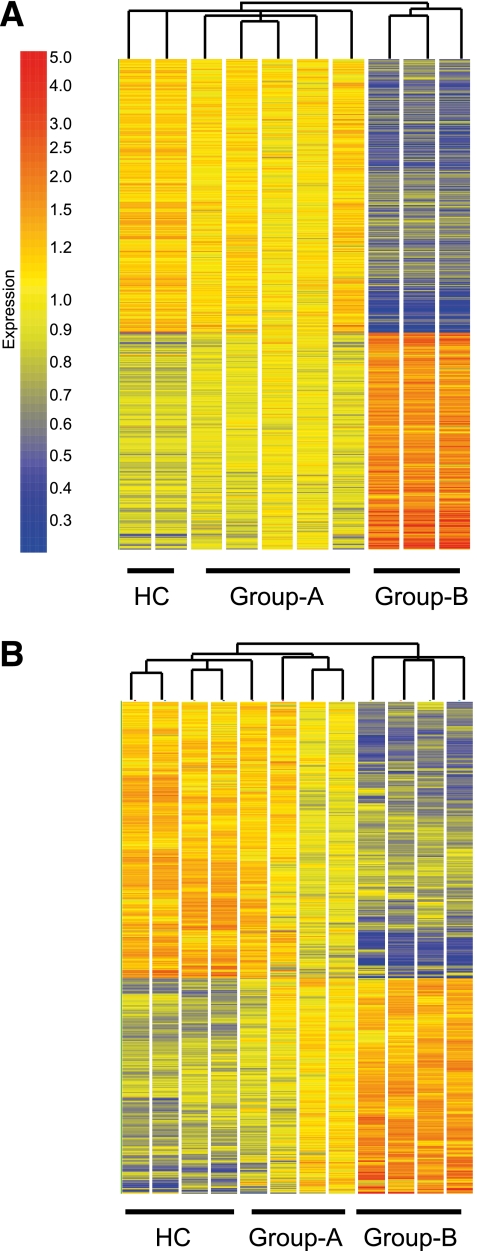
Purified PB CD14+ monocytes from a total of 16 recent-onset type 1 diabetic patients and six healthy control subjects were expression profiled using whole genome microarrays (Illumina HT-12), in two separate, independent experiments. Because of the volume of blood required to study purified monocytes, the healthy control subjects comprised young adults. Blood samples for microarray analysis were taken from insulin-treated patients ∼3 months after type 1 diabetes diagnosis, to avoid the acute metabolic disturbance associated with disease onset. A strikingly similar pattern was observed in both experiments, whereby a subset of monocyte expression profiles clustered apart from the remaining patients and healthy control subjects (group B, Fig. 1A and B). Because of this stark segregation, group B profiles were analyzed separately to identify differentially expressed genes. In group B monocytes compared with healthy control subjects in both microarrays (Fig. 1C and Supplementary Table 2), 1,107 probes (1,015 genes) were at least 1.5-fold differentially expressed (Benjamini Hochberg-corrected P value <0.05). Between the entire diabetes cohort and healthy control subjects in both microarrays (Fig. 1D), 320 probes were differentially expressed. Only 38 probes were reproducibly differentially expressed between group A patients and healthy control subjects. Hierarchical clustering of group B–regulated probes revealed that the two putative type 1 diabetes subgroups represent a spectrum of deviation from healthy control subjects, along the same continuum (Fig. 2A and B).
FIG. 1.
Unsupervised clustering of monocyte gene expression profiles identifies a subgroup of recent-onset type 1 diabetic patients. Purified PB monocytes from patients (D) or healthy control subjects (HC) (H) were expression-profiled by Illumina whole genome microarray, in two independent experiments (A, B). For each microarray, all genes detected in ≥1 sample were clustered using the Euclidean Distance correlation. Monocyte expression profiles from all patients, or the subset of patients designated “B”, were used to identify genes that were significantly differentially expressed (≥1.5-fold differential expression, Benjamini Hochberg corrected P < 0.05) between patients and control subjects (C, D).
FIG. 2.
Extremely divergent monocyte expression profile in a subgroup of recent-onset type 1 diabetic patients. Genes that were differentially expressed between group B monocytes and healthy control subjects (HC) (n = 1,107) in two independent microarrays were clustered using the Euclidean Distance correlation, as were the experimental samples (A, B).
Extreme divergence from healthy monocyte gene expression correlates with early type 1 diabetes progression.
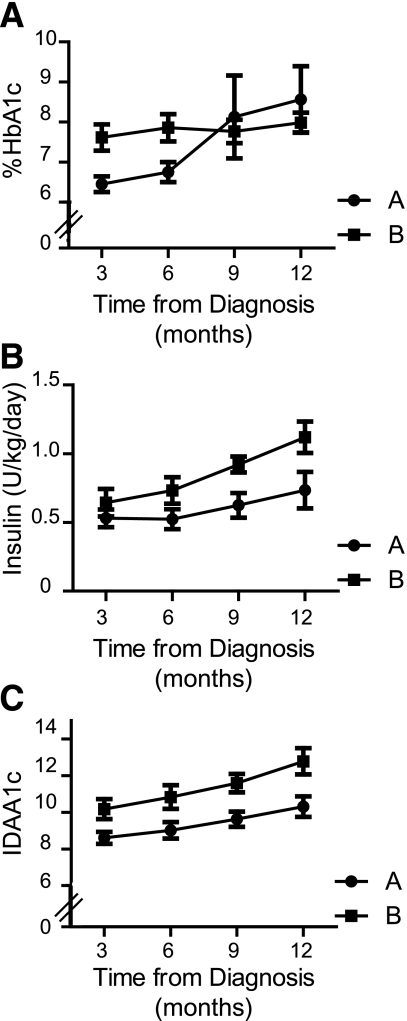
At diagnosis, group A and group B patients were clinically indistinguishable in terms of HLA genotype, family history, clinical presentation at diagnosis (including symptom duration, ketoacidosis, blood glucose, 25-hydroxy-vitamin D, diabetes-associated autoantibodies, or the presence of celiac or thyroid disease; Table 1 and data not shown). Group B patients had higher levels of HbA1c 3 and 6 months after diagnosis (Fig. 3A) and required significantly higher insulin doses to maintain glycemic control in the first 12 months after diagnosis (Fig. 3B, P = 0.0004, 2-way ANOVA). Approximately 30% of children diagnosed with type 1 diabetes experience a partial remission phase (honeymoon), during which their HbA1c levels and insulin requirements (used as a proxy for endogenous insulin production from residual β-cells) (15) are relatively low. An insulin dose–adjusted HbA1c metric (IDAA1c) ≤9 correlated with the definition of C-peptide responders in the Diabetes Control and Complications Trial (16) and was proposed as a definition for partial remission. Group A and group B IDAA1c diverged around 9 at 3–6 months postdiagnosis, and group B patients exhibited significantly higher IDAA1c during the first year of disease (Fig. 3C, P < 0.0001, 2-way ANOVA).
FIG. 3.
Diabetes progression in recent-onset type 1 diabetic patient subgroups. Plasma levels of %HbA1c (A) and total daily insulin dose (units/kg) (B) were recorded at 3 monthly intervals following diabetes diagnosis, from which IDAA1c (C) was calculated. Mean %HbA1c, daily insulin dose, and IDAA1c (± SD) are shown for patients subgrouped according to monocyte expression profile (group A, ●; group B, ■). Group sizes: HbA1c data: n = 8, 7, 7, and 7 for group A and n = 7, 7, 6, and 7 for group B at 3, 6, 9, and 12 months. TDD data: n = 8, 7, 6, and 4 for group A and n = 6, 6, 5, and 4 for group B at 3, 6, 9, and 12 months. Missing data arose when patients missed a clinic visit or commenced a basal/bolus or insulin pump regimen.
To examine whether the monocyte gene expression profiles observed were directly related to hyperglycemia, we identified probes whose expression was significantly correlated (Pearson P < 0.001) with plasma glucose concentration (n = 25), or %HbA1c (n = 70), at the time blood was sampled for profiling. No glucose-correlated probes and 9 of 70 HbA1c-correlated probes were differentially expressed between group B and healthy control subject monocytes (Supplementary Fig. 1). These analyses suggest the innate immune status of group B monocytes is not solely driven by hyperglycemia.
The group B monocyte profile is a signature of disturbed metabolic homeostasis.
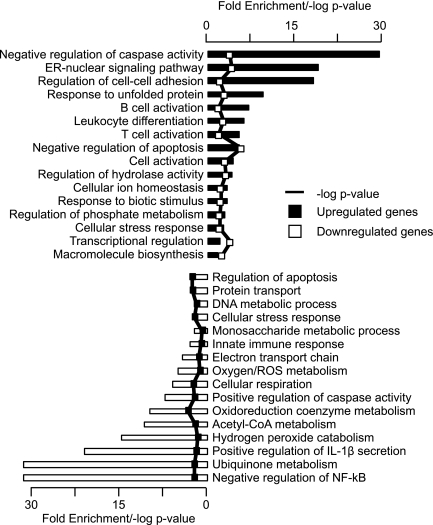
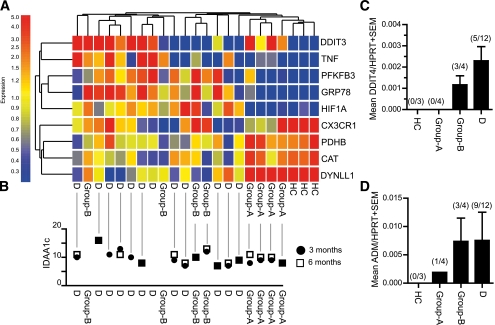
The correlation between monocyte gene expression close to type 1 diabetes onset and early clinical trajectory may imply a role for monocyte function in disease progression. Alternatively, or additionally, because PB monocytes are professional stress-sensing cells that circulate throughout the body, they may provide a window on systemic stresses, i.e., reflecting islet damage. We analyzed the set of 1,107 probes that were ≥1.5× up- or downregulated in group B patients compared with healthy control subjects in both arrays for significantly enriched gene ontology terms. Terms were manually curated to remove redundant categories comprising overlapping gene sets. Overexpressed genes were enriched for cellular stress and activation pathway genes, especially oxidative and endoplasmic reticulum (ER) stress (Fig. 4). We did not observe upregulation of classical inflammatory mediators, with the exception of tumor necrosis factor (TNF), interleukin (IL)-10, and PTGES2 (which encodes the enzyme catalyzing prostaglandin E2 production), and the prostaglandin E2 receptor, PTGER (Supplementary Table 2 and Fig. 5), whereas multiple genes involved in regulation of immune responses were downregulated in group B monocytes (Fig. 4). These included sensors such as TLR4, TLR5, IFI16, NLRX1, and NLRC4/IPAF and effectors such as CASP1 (Supplementary Table 2). Ten genes in key pathways differentially expressed by group B monocytes were selected for qPCR validation. Their expression was quantified in eight patients profiled previously by microarray and 12 additional recent-onset type 1 diabetic patients. Hierarchical clustering of 9 robustly detected genes segregated group B patients from group A and healthy control subjects, whereas unclassified patients’ monocytes (D) revealed a spectrum of gene expression, similar to the microarray analysis (Fig. 5A). IDAA1c tended to increase with increasing distance from the healthy control subjects expression profile (Fig. 5B; 3 or 6 month linear regression: slope = −0.225/−0.176, P = 0.017/0.091). Two genes selected for validation, DDIT4 and adrenomedullin (ADM), were not incorporated in the cluster analysis since they were only detected in monocytes from a subset of type 1 diabetic patients, including group B (Fig. 5C and D).
FIG. 4.
Biological processes associated with group B differentially expressed genes. Gray bars indicate ontology enrichment within upregulated genes; white bars indicate ontology enrichment within downregulated genes. Associated P values are indicated by the line. NF-κB, nuclear factor-κB.
FIG. 5.
Quantitative PCR (qPCR) validation of monocyte gene expression profiles in recent-onset type 1 diabetes. The expression of 9 group B–regulated genes was quantified by real time qPCR in CD14+ monocytes, relative to hypoxanthine-guanine phosphoribosyltransferase expression. Relative expression values for each gene were normalized to the gene’s median expression across all samples. Genes and samples were clustered by Spearman correlation (A). Group A and group B patients were classified previously by microarray. D denotes recent-onset patients who were followed from diagnosis with monocyte sampling at 3 months, but not profiled by microarray. IDAA1c corresponding to each patient profile in A recorded 3 (circles) and 6 (squares) months postdiagnosis (B) is shown. Missing data arose when patients missed a clinic visit or commenced a basal/bolus or insulin pump regimen. Relative expression of DDIT4 (C) and ADM (D) in the patient cohort depicted in A and B is shown. Transcript detection rates appear in parentheses. HC, healthy control subjects.
The group B monocyte expression profile strongly suggested stress-induced metabolic disturbance, with upregulation of ER and oxidative stress responsive genes, and downregulation of genes involved in cellular energy and metabolite production, especially mitochondrial oxidative phosphorylation (e.g., PDHB, MDH1, IDH1, SDHC, ACLY) (Fig. 5 and Supplementary Table 1). Mitochondrion was the most significantly enriched cellular component ontology among group B downregulated genes (P = 2.6e-05). It is well established that activation of myeloid and other immune cells is accompanied by a switch in glucose metabolism and cellular energy production, from oxidative phosphorylation to anaerobic fermentation through glycolysis (17). PFKFB3, which encodes the rate-limiting enzyme in the glycolytic pathway, was upregulated in group B monocytes (Fig. 5), but glycolytic pathway genes were not generally induced. PDHB and PFKFB3 expression was strongly inversely correlated in the microarray (r = −0.86, P < 0.0001), which may imply a reduction in oxidative phosphorylation and increased glycolysis (17). In addition to perturbations in core metabolic pathways, there was also evidence of cellular activation through stress, including the unfolded protein response that is a consequence of ER stress (e.g., IRE1, GRP78, DDIT3, XBP1) (Fig. 5 and Supplementary Table 2). HIF1A, a key mediator of oxidative stress, was upregulated in group B monocytes, as were multiple HIF1A target genes, including DDIT4, PFKFB3, and ADM (17,18) (Fig. 5 and Supplementary Table 2). Thus, the striking group B monocyte expression profile is a mixed signature consistent with the existence of multiple pathological processes and/or adaptive responses to stress and inflammation.
Monocyte subset balance is altered in PB of type 1 diabetic patients and a subset of FDR.
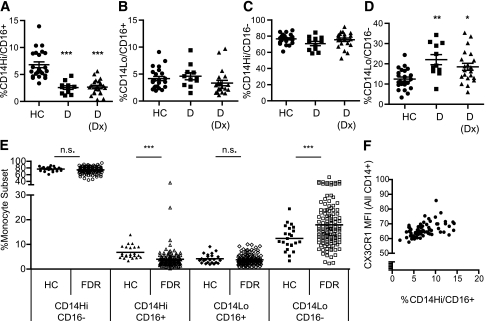
The mRNA encoding CX3CR1, a marker of CD16+ monocytes (19), was underexpressed in type 1 diabetic patients compared with healthy control subjects (Fig. 5), suggesting this dysregulation could derive from a perturbation in PB monocyte subset balance. PB monocytes from children with recent-onset or established type 1 diabetic and healthy children were phenotyped in whole blood according to surface expression of CD14 and CD16 (see Supplementary Fig. 2 for representative flow cytometric profiles). We observed a reduction in the total proportion of CD16+ monocytes in PB of type 1 diabetic patients (not shown), which was as a result of a selective reduction in the proportion of CD14Hi/CD16+ monocytes (Fig. 6A). The proportions of CD14Low/CD16+ and CD14Hi/CD16− populations were unaltered (Fig. 6B and C), whereas the proportion of CD14Low/CD16− cells was significantly increased in recent-onset type 1 diabetic patients (Fig. 6D). We observed a significant reduction of CD14Hi/CD16+ monocytes and an increase in CD14Low/CD16− monocytes in FDR of children with type 1 diabetes, relative to healthy children (Fig. 6E), suggesting that this finding is not associated with hyperglycemia. This phenotype may be monocyte-intrinsic, or may arise because of external sources of stress, which could affect β-cell reserve and PB monocyte subsets in both recent-onset patients and in FDR. The proportion of CD16+ monocytes in PB positively correlated with monocyte surface CX3CR1 expression by all CD14+ monocytes (Fig. 6F, Pearson’s r = 0.4648, P < 0.0001), whereas CX3CR1 surface expression by individual monocyte populations was not altered (data not shown). Thus, the distinctive monocyte signature in recent-onset diabetes, which includes CX3CR1 repression, may partially derive from a relative deficiency in CD14Hi/CD16+ monocytes and enrichment in CD14Low/CD16− monocytes.
FIG. 6.
Peripheral blood monocyte subset distribution in type 1 diabetic patients and their at-risk relatives. The percentage of monocytes in each of the 4 monocyte subsets was determined by flow cytometry analysis of surface CD14 and CD16 expression in whole PB. A–D: PB monocyte subset distribution was determined for healthy control subjects (HC) (circles), long-standing type 1 diabetic patients (D, squares, >12 months after diagnosis), recent-onset type 1 diabetic patients within 3 months of diagnosis (D[Dx], triangles). PB monocyte subset distribution in healthy control subjects (filled shapes) and FDR (unfilled shapes) (E) is shown. Correlation between %CD14+/CD16+ monocytes and monocyte CX3CR1 surface expression (F) is shown. ***P < 0.0001; **P < 0.01; *P < 0.05.
Subtle changes in cellular composition could underpin differential gene expression in a mixed cell population. We thus investigated whether group B–regulated genes typically exhibited monocyte subset-specific expression patterns. In a meta-analysis of all 16 monocyte microarrays, 98 genes were significantly correlated with CX3CR1 expression (Pearson, P < 0.001). Of the 1,109 genes that were significantly differentially expressed in group B monocytes (≥1.5×, P < 0.05), 64 were also correlated with CX3CR1 expression (Supplementary Fig. 3). Given the strong correlation between total monocyte CX3CR1 surface expression and %CD16+ monocytes in PB, these represent candidate subset-specific genes. We also analyzed two public microarray datasets that compared CD14Hi/CD16−, CD14Hi/CD16+, and CD14Low/CD16+ monocyte gene expression (20,21). There was negligible overlap between the group B monocyte signature and the genes that were differentially expressed between monocyte subsets (data not shown).
ER and oxidative stress markers are upregulated in FDR PBMC.
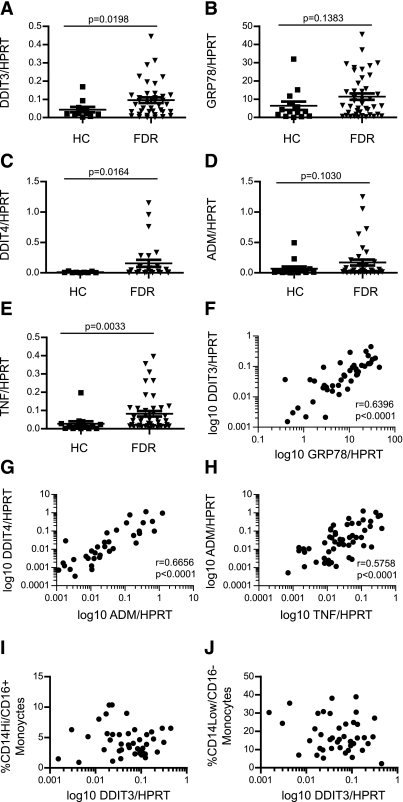
To investigate whether elements of the group B monocyte signature are evident in children at risk of developing type 1 diabetes, we assayed gene expression in PBMC from FDR, including 14 of 43 with at least one islet autoantibody, compared with healthy children. Purified monocytes were not studied since blood sample volumes were limiting. Broadly expressed genes such as CX3CR1 and HIF1A were not differentially expressed between FDR and healthy control subjects (data not shown). By contrast, increased expression of the inducible ER stress (DDIT3, GRP78) and oxidative stress genes (DDIT4, ADM), and the proinflammatory cytokine TNF, was evident in a subset of FDR (Fig. 7A–E). Expression levels of several of these genes were highly correlated to each other (P < 0.0001, Fig. 7F–H and data not shown), but their expression did not differ between autoantibody positive and negative FDR (not shown). Stress marker expression did not correlate with monocyte subset distribution (Fig. 7I and J and data not shown), confirming our conclusion from the meta-analysis that the stress signature is coincident with, but distinct from, altered monocyte subset distribution in type 1 diabetic patients and FDR.
FIG. 7.
Elements of the type 1 diabetes group B expression signature detected in healthy FDR PBMC. Expression of DDIT3 (A), GRP78 (B), DDIT4 (C), ADM (D), and TNF (E) in PBMCs from type 1 diabetic FDR or healthy children (HC) was quantitated by PCR. Correlation between DDIT3 and GRP78 expression levels (F) is shown. Correlation between DDIT4 and ADM expression levels (G) is shown. Correlation between TNF and ADM expression levels (H) is shown. Correlation between DDIT3 expression and %CD14Hi/CD16+ (I) and %CD14Low/CD16− (J) monocytes in PB is shown. P values for group comparisons (A–D) were generated by Student t test (with Welch's correction where variances were significantly different, as determined by F test). Pearson’s correlation coefficient (r) and associated P values are shown in E–G.
DISCUSSION
There is considerable interest in developing therapies to protect and regenerate residual β-cell function, to arrest or slow the course of disease, and to mitigate the development of type 1 diabetes complications (5). This should be achievable, since 80% juvenile diabetic patients had significant residual β-cell function during the first year after diagnosis (22). However, disappointing results in several recent Phase III immunotherapy trials in recent-onset type 1 diabetes have invited speculation that factors, such as β-cell stress, contribute to continuing β-cell destruction after disease onset and may require treatments other than immune intervention (23).
We report here that PB of children with type 1 diabetes is characterized by a relative deficiency of CD14Hi/CD16+ monocytes, an enrichment in CD14Low/CD16− monocytes, and a striking, coordinated monocyte gene expression reflecting altered metabolism associated with stress. Recent-onset patients could be reproducibly stratified on the basis of their monocyte gene expression profile. Severe deviation from a healthy monocyte expression profile, which we observed in ∼50% of patients, independently identified a clinical subset with reduced glycemic control, as evidenced by higher %HbA1c and higher insulin requirement. We hypothesize that the two ends of the spectrum at type 1 diabetes onset represent different disease trajectories, whose differences in glycemic control may affect future development of diabetes complications (1). Identification of individuals on a severe trajectory may provide opportunities for better clinical management or targeted therapies for these patients. The reason for the early clinical divergence in these patients is not clear, but could be explained by two testable hypotheses: 1) pathological processes are intrinsically more aggressive, or regulation less effective, in group B patients than group A patients or 2) group A patients possess the greater β-cell reserve at diagnosis, and insulin treatment enables at least transient restoration of function in these cells.
Type 1 diabetes progression is most commonly assessed using metabolic parameters, including %HbA1c, insulin requirement, and C-peptide levels. C-peptide is the most common surrogate marker for declining β-cell function, and thus rate of disease progression. Higher %HbA1c and insulin requirements were associated with rapid disease progression in several prospective studies, along with risk factors such as younger age, presentation with ketoacidosis, and GAD autoantibody status (4,24,25). Percent HbA1c levels also predict the development of microvascular complications of type 1 diabetes (26). Type 1 diabetes progression and remission have rarely been studied from an immunological perspective, although increased numbers of regulatory T cells were associated with remission in one small cohort study (27). It remains to be determined whether monocyte phenotype represents an independent biomarker for disease progression or whether monocytes are simply stress-prone cells that reflect pancreatic dysfunction. Notably, the mRNA encoding ADM, a vasoactive hormone involved in protection against oxidative stress associated with diabetes complications and dysglycemia (25,28), was upregulated in group B patients and FDR.
Reactive oxygen species (ROS), the causative agents of oxidative stress, are produced in response to environmental stimuli and as by-products of cellular metabolism. The distinct oxidative and ER stress signature we observed in group B patients suggests these patients’ monocytes are intrinsically vulnerable to stress, or that they exist in a stressful environment. Stress pathway activation has implications for monocyte differentiation and function. In addition to the elevated expression of oxidative stress responsive genes, such as HIF1A and HIF1A targets, multiple genes involved in cellular antioxidant pathways were downregulated in group B monocytes (e.g., CAT, G6PD, OXR1, PRDX1, and PRDX3), suggesting protective mechanisms may be impaired. Oxidative stress is strongly implicated in type 1 diabetes progression, particularly in the development of complications, in both humans and animal models (29,30). Oxidative stress is directly associated with β-cell toxicity and decreased insulin secretion, since β-cells have intrinsically low antioxidant defenses (29), but systemic oxidative stress may also play a role in promoting hyperglycemia and diabetes progression. Monocytes and neutrophils from type 1 diabetic subjects generated more ROS (31), and macrophage-derived ROS were found to be critical for the induction of autoreactive T cells and diabetes development in NOD mice (32).
Oxidative and ER stress are closely linked. Correct ER-dependent protein folding is essential for the localization and function of secreted and membrane-bound proteins. The UPR is a transcriptional program activated in response to a variety of stressors that disturb ER homeostasis, including ROS, infection, lipotoxicity, and impaired calcium homeostasis (33). Although first characterized as a physiological response regulating cell survival under stressful conditions, emerging data demonstrate extensive, bidirectional cross-talk between the UPR, inflammatory, and metabolic pathways (33). For example, ER stress reduced proinflammatory responses in monocytes from type 2 diabetic patients (34) and nonimmune cells (35). By contrast, ER stress has been shown to synergise with inflammatory stimuli in macrophages, specifically enhancing IL-23, IL-8, and IL-6 production, but not affecting IL-12 or IL-1β (36,37). The duration and context of ER stress may thus influence the balance of monocyte inflammatory mediators. Notably, TNF was upregulated in group B monocytes, whereas other inflammatory mediators and signaling molecules were downregulated, including several components of the IL-1β processing pathway that have previously been positively associated with type 1 and type 2 diabetes (38).
Persistent ER stress leads to apoptosis and inflammation, in the event the UPR fails to restore ER homeostasis. The induction of DDIT3, a key UPR proapoptotic effector, in group B monocytes suggests extreme or prolonged ER stress. Because mitochondria are necessary for stress adaptation in the early phase of the UPR, mitochondrial defects should render cells more vulnerable to ER stress–induced death (39). The striking downregulation of mitochondrial component and pathway genes in group B monocytes may affect susceptibility to stress, immune function (40,41), and cellular energy metabolism (42). Genes regulating apoptosis were also enriched in group B monocytes, which may be evidence of a stress-induced challenge to survival in these cells. The detection of stress elements of the group B monocyte signature in unfractionated PBMC from FDR confirms these gene expression changes are not simply a result of hyperglycemia and raises the possibility that oxidative and ER stress also contribute to disease development. Future studies will determine whether the PBMC stress gene expression signature derives solely from monocytes or is common to multiple cell types and will clarify the relationship between monocyte perturbation, diabetes risk status, and disease development.
Monocytes and their differentiated progeny, macrophages and DCs, play both proinflammatory and anti-inflammatory, tissue protective roles. Type 1 diabetic patients and their FDR exhibited a reduced proportion of CD14Hi/CD16+ intermediate monocytes in PB and an apparently concomitant increase in the CD14Low/CD16− monocyte subset. Intriguingly, perturbations in PB monocyte subsets did not correlate with the induction of oxidative and ER stress genes in FDR PBMC, suggesting the two phenotypes are independent. Expansion of the CD16+ population has been observed in many inflammatory diseases, from infection to autoimmunity (19). A decrease in CD14Hi/CD16+ monocytes was associated with cardiovascular events in patients with kidney disease (43,44) and with asthma severity (45). By contrast, increased CD14Hi/CD16+ monocyte counts correlated with good clinical outcomes after stroke, potentially because of their roles in tissue repair and angiogenesis (46). CD16+ monocytes have also been implicated in promoting immune tolerance (47,48). These two key monocyte functions may be mechanistically linked in type 1 diabetes, since defective clearance of dying cells is also hypothesized to promote inflammation and autoimmunity (49). Wound healing is defective in humans and mice with diabetes, due in part to an inability to efficiently clear apoptotic cells (50). Thus, a relative deficiency in CD16+ monocytes may compromise tissue repair and/or autoimmune regulation at sites of inflammation, including the pancreas, which would likely promote disease progression and complications.
In conclusion, we demonstrate that monocyte gene expression distinguishes type 1 diabetic patients at disease onset. This stratification correlates with early disease trajectory, which we hypothesize has implications for the rate of disease progression and the development of complications. The coordinated expression signature in rapidly progressing type 1 diabetes suggests an underlying high-level susceptibility or exposure to physiological stress. Further studies will clarify the impact of the group B monocytes phenotype on antigen-presenting cell function, and thus T cell responses in autoimmune diabetes.
Supplementary Material
ACKNOWLEDGMENTS
This work was supported by NHMRC Grants 351439 and 569938 and JDRF Grants 1-2006-149 and 25-2010-646. R.T. is supported by Arthritis Queensland and an ARC Future Fellowship.
No potential conflicts of interest relevant to this article were reported.
K.M.I., P.G., M.H., A.C., and R.T. devised the study. K.M.I. analyzed the data, with help from P.G., X.A., M.H., and A.C. K.M.I. wrote the manuscript with input from M.H., A.C., and R.T. K.M.I., X.A., and S.E.B. performed experiments with help from G.T. and C.W. P.G., M.H., and A.C. orchestrated patient recruitment and oversaw clinical analyses and interpretation. A.C. and R.T. provided financial support. R.T. is the guarantor of this work and, as such, had full access to all the data in the study and takes responsibility for the integrity of the data and the accuracy of the data analysis.
The authors thank Tracey Baskerville and Sherrell Cardinal of Mater Health Services for recruiting patients and collecting blood samples.
Footnotes
This article contains Supplementary Data online at http://diabetes.diabetesjournals.org/lookup/suppl/doi:10.2337/db11-1549/-/DC1.
REFERENCES
- 1.Writing Team for the Diabetes Control and Complications Trial/Epidemiology of Diabetes Interventions and Complications Research Group. Sustained effect of intensive treatment of type 1 diabetes mellitus on development and progression of diabetic nephropathy: the Epidemiology of Diabetes Interventions and Complications (EDIC) study. JAMA 2003;290:2159–2167 [DOI] [PMC free article] [PubMed] [Google Scholar]
- 2.Böber E, Dündar B, Büyükgebiz A. Partial remission phase and metabolic control in type 1 diabetes mellitus in children and adolescents. J Pediatr Endocrinol Metab 2001;14:435–441 [DOI] [PubMed] [Google Scholar]
- 3.Bowden SA, Duck MM, Hoffman RP. Young children (<5 yr) and adolescents (>12 yr) with type 1 diabetes mellitus have low rate of partial remission: diabetic ketoacidosis is an important risk factor. Pediatr Diabetes 2008;9:197–201 [DOI] [PubMed] [Google Scholar]
- 4.Kaas A, Pfleger C, Hansen L, et al. Hvidøre Study Group on Childhood Diabetes Association of adiponectin, interleukin (IL)-1ra, inducible protein 10, IL-6 and number of islet autoantibodies with progression patterns of type 1 diabetes the first year after diagnosis. Clin Exp Immunol 2010;161:444–452 [DOI] [PMC free article] [PubMed] [Google Scholar]
- 5.Phillips B, Trucco M, Giannoukakis N. Current state of type 1 diabetes immunotherapy: incremental advances, huge leaps, or more of the same? Clin Dev Immunol 2011;2011:432016 [DOI] [PMC free article] [PubMed]
- 6.Goldberg E, Krause I. Infection and type 1 diabetes mellitus–a two edged sword? Autoimmun Rev 2009;8:682–686 [DOI] [PubMed] [Google Scholar]
- 7.Devaraj S, Cheung AT, Jialal I, et al. Evidence of increased inflammation and microcirculatory abnormalities in patients with type 1 diabetes and their role in microvascular complications. Diabetes 2007;56:2790–2796 [DOI] [PMC free article] [PubMed] [Google Scholar]
- 8.Kaizer EC, Glaser CL, Chaussabel D, Banchereau J, Pascual V, White PC. Gene expression in peripheral blood mononuclear cells from children with diabetes. J Clin Endocrinol Metab 2007;92:3705–3711 [DOI] [PubMed] [Google Scholar]
- 9.Wang X, Jia S, Geoffrey R, Alemzadeh R, Ghosh S, Hessner MJ. Identification of a molecular signature in human type 1 diabetes mellitus using serum and functional genomics. J Immunol 2008;180:1929–1937 [DOI] [PubMed] [Google Scholar]
- 10.Bradshaw EM, Raddassi K, Elyaman W, et al. Monocytes from patients with type 1 diabetes spontaneously secrete proinflammatory cytokines inducing Th17 cells. J Immunol 2009;183:4432–4439 [DOI] [PMC free article] [PubMed] [Google Scholar]
- 11.Dahlén E, Dawe K, Ohlsson L, Hedlund G. Dendritic cells and macrophages are the first and major producers of TNF-alpha in pancreatic islets in the nonobese diabetic mouse. J Immunol 1998;160:3585–3593 [PubMed] [Google Scholar]
- 12.Uno S, Imagawa A, Okita K, et al. Macrophages and dendritic cells infiltrating islets with or without beta cells produce tumour necrosis factor-alpha in patients with recent-onset type 1 diabetes. Diabetologia 2007;50:596–601 [DOI] [PubMed] [Google Scholar]
- 13.Banaei-Bouchareb L, Gouon-Evans V, Samara-Boustani D, et al. Insulin cell mass is altered in Csf1op/Csf1op macrophage-deficient mice. J Leukoc Biol 2004;76:359–367 [DOI] [PubMed] [Google Scholar]
- 14.Tessem JS, Jensen JN, Pelli H, et al. Critical roles for macrophages in islet angiogenesis and maintenance during pancreatic degeneration. Diabetes 2008;57:1605–1617 [DOI] [PMC free article] [PubMed] [Google Scholar]
- 15.Mortensen HB, Hougaard P, Swift P, et al. Hvidoere Study Group on Childhood Diabetes New definition for the partial remission period in children and adolescents with type 1 diabetes. Diabetes Care 2009;32:1384–1390 [DOI] [PMC free article] [PubMed] [Google Scholar]
- 16.The Diabetes Control and Complications Trial Research Group Effect of intensive therapy on residual beta-cell function in patients with type 1 diabetes in the diabetes control and complications trial. A randomized, controlled trial. Ann Intern Med 1998;128:517–523 [DOI] [PubMed] [Google Scholar]
- 17.Ruiz-García A, Monsalve E, Novellasdemunt L, et al. Cooperation of adenosine with macrophage Toll-4 receptor agonists leads to increased glycolytic flux through the enhanced expression of PFKFB3 gene. J Biol Chem 2011;286:19247–19258 [DOI] [PMC free article] [PubMed] [Google Scholar]
- 18.Geiger K, Leiherer A, Muendlein A, et al. Identification of hypoxia-induced genes in human SGBS adipocytes by microarray analysis. PLoS ONE 2011;6:e26465. [DOI] [PMC free article] [PubMed] [Google Scholar]
- 19.Ziegler-Heitbrock L. The CD14+ CD16+ blood monocytes: their role in infection and inflammation. J Leukoc Biol 2007;81:584–592 [DOI] [PubMed] [Google Scholar]
- 20.Cros J, Cagnard N, Woollard K, et al. Human CD14dim monocytes patrol and sense nucleic acids and viruses via TLR7 and TLR8 receptors. Immunity 2010;33:375–386 [DOI] [PMC free article] [PubMed] [Google Scholar]
- 21.Wong KL, Tai JJ, Wong WC, et al. Gene expression profiling reveals the defining features of the classical, intermediate, and nonclassical human monocyte subsets. Blood 2011;118:e16–e31 [DOI] [PubMed] [Google Scholar]
- 22.Greenbaum CJ, Anderson AM, Dolan LM, et al. SEARCH Study Group Preservation of β-cell function in autoantibody-positive youth with diabetes. Diabetes Care 2009;32:1839–1844 [DOI] [PMC free article] [PubMed] [Google Scholar]
- 23.Roep BO. New hope for immune intervention therapy in type 1 diabetes. Lancet 2011;378:376–378 [DOI] [PubMed] [Google Scholar]
- 24.Bonfanti R, Bazzigaluppi E, Calori G, et al. Parameters associated with residual insulin secretion during the first year of disease in children and adolescents with Type 1 diabetes mellitus. Diabet Med 1998;15:844–850 [DOI] [PubMed] [Google Scholar]
- 25.Mortensen HB, Swift PGF, Holl RW, et al. Hvidoere Study Group on Childhood Diabetes Multinational study in children and adolescents with newly diagnosed type 1 diabetes: association of age, ketoacidosis, HLA status, and autoantibodies on residual beta-cell function and glycemic control 12 months after diagnosis. Pediatr Diabetes 2010;11:218–226 [DOI] [PubMed] [Google Scholar]
- 26.Giordano C, Amato MC, Ciresi A, et al. Predictors of microvascular complications in type 1 diabetic patients at onset: the role of metabolic memory. Eur J Intern Med 2011;22:266–274 [DOI] [PubMed] [Google Scholar]
- 27.Sanda S, Roep BO, von Herrath M. Islet antigen specific IL-10+ immune responses but not CD4+CD25+FoxP3+ cells at diagnosis predict glycemic control in type 1 diabetes. Clin Immunol 2008;127:138–143 [DOI] [PubMed] [Google Scholar]
- 28.El-Habashy SA, Matter RM, El-Hadidi ES, Afifi HR. Plasma adrenomedullin level in Egyptian children and adolescents with type 1 diabetes mellitus: relationship to microvascular complications. Diabetol Metab Syndr 2010;2:12. [DOI] [PMC free article] [PubMed] [Google Scholar]
- 29.Delmastro MM, Piganelli JD. Oxidative stress and redox modulation potential in type 1 diabetes. Clin Dev Immunol 2011;2011:593863 [DOI] [PMC free article] [PubMed]
- 30.Oresic M, Simell S, Sysi-Aho M, et al. Dysregulation of lipid and amino acid metabolism precedes islet autoimmunity in children who later progress to type 1 diabetes. J Exp Med 2008;205:2975–2984 [DOI] [PMC free article] [PubMed] [Google Scholar]
- 31.Dandona P, Thusu K, Cook S, et al. Oxidative damage to DNA in diabetes mellitus. Lancet 1996;347:444–445 [DOI] [PubMed] [Google Scholar]
- 32.Thayer TC, Delano M, Liu C, et al. Superoxide production by macrophages and T cells is critical for the induction of autoreactivity and type 1 diabetes. Diabetes 2011;60:2144–2151 [DOI] [PMC free article] [PubMed] [Google Scholar]
- 33.Martinon F, Glimcher LH. Regulation of innate immunity by signaling pathways emerging from the endoplasmic reticulum. Curr Opin Immunol 2010;23:35–40 [DOI] [PMC free article] [PubMed] [Google Scholar]
- 34.Komura T, Sakai Y, Honda M, Takamura T, Matsushima K, Kaneko S. CD14+ monocytes are vulnerable and functionally impaired under endoplasmic reticulum stress in patients with type 2 diabetes. Diabetes 2010;59:634–643 [DOI] [PMC free article] [PubMed] [Google Scholar]
- 35.Hayakawa K, Hiramatsu N, Okamura M, et al. Acquisition of anergy to proinflammatory cytokines in nonimmune cells through endoplasmic reticulum stress response: a mechanism for subsidence of inflammation. J Immunol 2009;182:1182–1191 [DOI] [PubMed] [Google Scholar]
- 36.Martinon F, Chen X, Lee AH, Glimcher LH. TLR activation of the transcription factor XBP1 regulates innate immune responses in macrophages. Nat Immunol 2010;11:411–418 [DOI] [PMC free article] [PubMed] [Google Scholar]
- 37.Goodall JC, Wu C, Zhang Y, et al. Endoplasmic reticulum stress-induced transcription factor, CHOP, is crucial for dendritic cell IL-23 expression. Proc Natl Acad Sci USA 2010;107:17698–17703 [DOI] [PMC free article] [PubMed] [Google Scholar]
- 38.Mandrup-Poulsen T, Pickersgill L, Donath MY. Blockade of interleukin 1 in type 1 diabetes mellitus. Nat Rev Endocrinol 2010;6:158–166 [DOI] [PubMed] [Google Scholar]
- 39.Bravo R, Vicencio JM, Parra V, et al. Increased ER-mitochondrial coupling promotes mitochondrial respiration and bioenergetics during early phases of ER stress. J Cell Sci 2011;124:2143–2152 [DOI] [PMC free article] [PubMed] [Google Scholar]
- 40.Castera L, Hatzfeld-Charbonnier AS, Ballot C, et al. Apoptosis-related mitochondrial dysfunction defines human monocyte-derived dendritic cells with impaired immuno-stimulatory capacities. J Cell Mol Med 2009;13:1321–1335 [DOI] [PMC free article] [PubMed] [Google Scholar]
- 41.Park D, Han CZ, Elliott MR, et al. Continued clearance of apoptotic cells critically depends on the phagocyte Ucp2 protein. Nature 2011;477:220–224 [DOI] [PMC free article] [PubMed] [Google Scholar]
- 42.Tannahill GM, O’Neill LA. The emerging role of metabolic regulation in the functioning of Toll-like receptors and the NOD-like receptor Nlrp3. FEBS Lett 2011;585:1568–1572 [DOI] [PubMed] [Google Scholar]
- 43.Rogacev KS, Seiler S, Zawada AM, et al. CD14++CD16+ monocytes and cardiovascular outcome in patients with chronic kidney disease. Eur Heart J 2011;32:84–92 [DOI] [PubMed] [Google Scholar]
- 44.Heine GH, Ulrich C, Seibert E, et al. CD14++CD16+ monocytes but not total monocyte numbers predict cardiovascular events in dialysis patients. Kidney Int 2008;73:622–629 [DOI] [PubMed] [Google Scholar]
- 45.Moniuszko M, Bodzenta-Lukaszyk A, Kowal K, Lenczewska D, Dabrowska M. Enhanced frequencies of CD14++CD16+, but not CD14+CD16+, peripheral blood monocytes in severe asthmatic patients. Clin Immunol 2009;130:338–346 [DOI] [PubMed] [Google Scholar]
- 46.Urra X, Villamor N, Amaro S, et al. Monocyte subtypes predict clinical course and prognosis in human stroke. J Cereb Blood Flow Metab 2009;29:994–1002 [DOI] [PubMed] [Google Scholar]
- 47.MacDonald KP, Palmer JS, Cronau S, et al. An antibody against the colony-stimulating factor 1 receptor depletes the resident subset of monocytes and tissue- and tumor-associated macrophages but does not inhibit inflammation. Blood 2010;116:3955–3963 [DOI] [PubMed] [Google Scholar]
- 48.Gregori S, Tomasoni D, Pacciani V, et al. Differentiation of type 1 T regulatory cells (Tr1) by tolerogenic DC-10 requires the IL-10-dependent ILT4/HLA-G pathway. Blood 2010;116:935–944 [DOI] [PubMed] [Google Scholar]
- 49.Muñoz LE, Lauber K, Schiller M, Manfredi AA, Herrmann M. The role of defective clearance of apoptotic cells in systemic autoimmunity. Nat Rev Rheumatol 2010;6:280–289 [DOI] [PubMed] [Google Scholar]
- 50.Khanna S, Biswas S, Shang Y, et al. Macrophage dysfunction impairs resolution of inflammation in the wounds of diabetic mice. PLoS ONE 2010;5:e9539. [DOI] [PMC free article] [PubMed] [Google Scholar]
Associated Data
This section collects any data citations, data availability statements, or supplementary materials included in this article.


