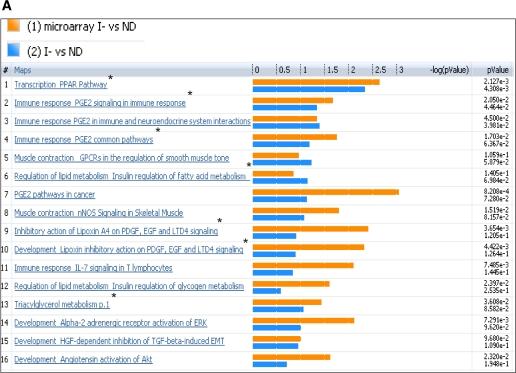
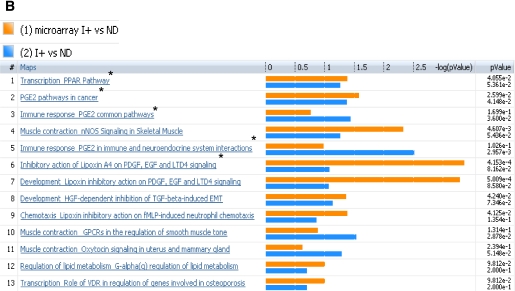
FIG. 3.
Comparison of plasma metabolome with transcriptome of I− versus ND (A) and I+ versus ND (B). The coclustering between the metabolomic changes and the transcripts of the corresponding muscle genes showed similar directional changes on the canonical pathways, although the statistical significance was different. The microarray/transcriptome data and the metabolome data are marked with an orange bar and blue bar, respectively. *Pathways used to build metabolic networks, as shown in Fig 4. EGF, epidermal growth factor; ERK, extracellular signal–related kinase; nNOS, neuronal nitric oxide synthase; PDGF, platelet-derived growth factor; TGF, transforming growth factor; GPCR, G protein-coupled receptor; LTD4, leukotriene receptor D4; HGF, hepatocyte growth factor; EMT, epithelial mesenchymal transition; VDR, vitamin D3 receptor; fMLP, N-formylated peptides like fMLP.


