Abstract
Starting from a coarse grained representation of the building units of the minute virus of mice and a flexible polyelectrolyte molecule, we have explored the mechanism of assembly into icosahedral structures with the help of Langevin dynamics simulations and the parallel tempering technique. Regular icosahedra with appropriate symmetry form only in a narrow range of temperature and polymer length. Within this region of parameters where successful assembly would proceed, we have systematically investigated the growth kinetics. The assembly of icosahedra is found to follow the classical nucleation and growth mechanism in the absence of the polymer, with the three regimes of nucleation, linear growth, and slowing down in the later stage. The calculated average nucleation time obeys the laws expected from the classical nucleation theory. The linear growth rate is found to obey the laws of secondary nucleation as in the case of lamellar growth in polymer crystallization. The same mechanism is seen in the simulations of the assembly of icosahedra in the presence of the polymer as well. The polymer reduces the nucleation barrier significantly by enhancing the local concentration of subunits via adsorbing them on their backbone. The details of growth in the presence of the polymer are also found to be consistent with the classical nucleation theory, despite the smallness of the assembled structures.
INTRODUCTION
An understanding of the required forces and kinetic pathways in the packaging of single electrically charged macromolecules by other complementary macromolecules remains as a challenge and holds good prospects for developing delivery protocols in the context of biology and biotechnology. The simplest and the most beautiful example of macromolecular packaging is the virus assembly. Although there have been overwhelming amount of experimentally determined information on a large number of viruses,1 only recently there have been substantial activity on the theoretical and modeling front.2 Most of the modeling research on virus assembly have focused on specific viruses and a few have focused on the generic features of the virus assembly. The present modeling work falls in the latter category in an effort to elucidate the gross features of the assembly mechanism without taking the burden to be specific to particular viruses.
Since all of the previous publications pertinent to the present work are couched in the context of real viruses, we give a brief description of the context and then we build our model inspired by this context. Among the plethora of viruses, there are several classes of viruses where the constituting protein molecules and polynucleotides assemble rather spontaneously, under suitable experimental conditions, into precise closed icosahedral structures. In particular, ssRNA/DNA viruses are examples of spontaneous assembly,3, 4, 5 where the genome is a flexible polyelectrolyte. For these viruses, the assembly is directed by weak non-covalent interactions such as the hydrophobic interactions, hydrogen-bonding, and salt bridges.6, 7 This is in contrast to the case of bacteriophages where the confinement of the stiffer double stranded DNA genome is an active process requiring motors.8, 9, 10, 11 The generic morphological feature of the ssRNA/DNA viruses is that a certain number of essentially identical protein molecules (called capsomers) form the wall of the virus (called capsid) and the interior of the virus contains the single-stranded polynucleotide genome. The many facets of the basic mechanism of assembly of ssRNA/DNA viruses have been addressed in the literature over the past decades for specific viruses, with differing conclusions.1, 2, 12, 13, 14, 15, 16, 17, 18
The various investigations on the physical aspects of viruses have focused on two major aspects. One is the structural relationship between the capsid proteins and the polynucleotide.2, 7, 19, 20, 21, 22, 23, 24, 25, 26, 27 The other aspect is the kinetics of the evolution of the final structures of the viruses.28, 29, 30, 31, 32, 33 Significant progress has recently been made in identifying the dominant forces resulting in the eventual structural relationship between the polynucleotide and the capsid proteins in ssRNA/DNA viruses. There is a growing body of evidence for the thesis that nonspecific electrostatic interactions among the negatively charged ssRNA/DNA molecule and the positive-charge-carrying tail-like domains of the capsid proteins dominate the organization of the genome inside the capsid, irrespective of the particular sequences of the polynucleotide and the charged part of the capsid proteins.2, 12, 27, 34, 35 In tandem, there has also been an emphasis on the role of secondary structures of the polynucleotide in the final structures of the genome inside the capsid.17 The present work does not address this issue; instead, we focus on the kinetics of assembly of capsomers and the flexible polymers into virus-like structures.
There have been several theoretical and modeling studies of viruses and virus assembly, as reviewed in Ref. 2. One of the early theoretical attempts is to formulate the assembly as a series of chemical reactions and solve the corresponding kinetic equations with several parameters.28, 29, 30 With reasonable assumptions on the kinetic coefficients, this kinetic model is able to capture many features of the assembly kinetics. However, the templating effects from the polymer cannot be explicitly considered here except for assigning different values of the parameters. In another attempt at theory, the assembly has been mapped to the micellization process.31, 32 This model also predicts the qualitative features observed in the experiments. Regarding the effect of capsomer concentration on the assembly kinetics, the nucleation-growth model has also been introduced and was found to be consistent with experimental findings.33 In these theoretical attempts, polymer conformations are not addressed. In an effort to consider the role of the polymer, there have been suggestions that the genome binds along the edges of the capsomers and brings them together to form the complete virus and that the genome-capsid complexation provides a faster route for the assembly.14, 36
The modeling efforts have been based on atomistic molecular dynamics37 and coarse-grained modeling.38, 39, 40, 41, 42, 43, 44, 45, 46, 47 In the coarse-grained modeling, several different choices were made to represent the building units. It was essential to recognize that the coarse-grained building unit must possess an asymmetric shape and the choice was the trapezoidal shape.39, 40 In Refs. 43, 44, 45, 46, hard sphere models were used to represent the building units but several different choices were made for the anisotropic interactions between the building units. The simulations by Nguyen et al.42 led to free energy landscape for the assembly of virus-like particles. The calculated landscape did not show any nucleation barrier in contradiction with the previously mentioned theoretical assumptions and the continuum kinetic model of Zlotnik.28 Although some of the previous simulations considered the interaction between the polynucleotide and the capsomers, only qualitative conclusions could be drawn.
In the present work, we seek the generic physical aspects of the role played by genome-like polyelectrolyte molecules in assembling virus-like particles in as much quantitative details as possible. We are not focusing on a particular virus in terms of modeling its stability and biological functions. Nevertheless, in the realm of virus-like structures of interest here, we fashion our generic model after the parovirus minute virus of mice for the capsid and a flexible polyelectrolyte chain of variable lengths for the genome. We address the kinetic process of assembly of the virus-like particle without the polymer and how this process is affected by the presence of the polymer. The main conclusion is that the assembly of the virus-like particle, both in the absence and the presence of the polymer, proceeds by the nucleation and growth mechanism. The nucleation time can be adequately explained by the classical nucleation theory in terms of quench depth in temperature and the supersaturation in the protein concentration. The growth is found to take place by another nucleation process, namely the secondary nucleation, as commonly observed in two-dimensional growth of lamellae. In the presence of the polymer, the nucleation barrier is reduced and as a result the assembly becomes faster. The role of the polymer is found to enhance the local concentration of the building units by binding them, which in turn leads to faster kinetics of co-assembly. The dependence of the nucleation time and growth rate on the polymer length are consistent with the classical nucleation theory.
COARSE-GRAINED MODEL AND SIMULATION METHOD
We adopt coarse-grained models for the capsid proteins and the genome-like polymer. Although our coarse grained models are only generic, the models presented below are developed in the context of parovirus minute virus of mice (MVM), due to the experimentally available rich details.7 Using these building blocks representing the proteins and the genome, we monitor how they interact to form the assemblies with Langevin dynamics simulation. We also construct the free energy landscape for the self-assembly of the emerging virus-like particles by the parallel tempering method. The interaction potentials, computational procedures, and methods of data analyses are briefly given below.
Subunit of capsid
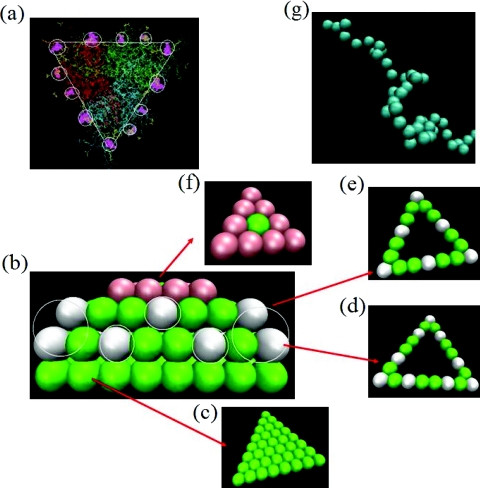
The extensive investigations by Reguera et al.7 have shown that the significant intermediate in the assembly of MVM is a trimer of the capsid proteins which geometrically resembles a thick equilateral triangle, as shown in Fig. 1a. With the help of mutagenesis methods, they have established that there are a set of residues lying regularly on a thin equatorial belt around the trimer, which are critically responsible for the self-assembly and stability of the virus. These residues are capable of forming multiple hydrophobic contacts and/or hydrogen bonds and/or salt bridges with the same set of residues on the other trimers. The major conclusion derived by Reguera et al.7 is that these sticky residues provide the glue between the trimers in the assembly process and the other residues being responsible for conformational changes, infectivity and other functionalities of the virus. This major advance by Reguera et al.7 constitutes our beginning step of modeling.
Figure 1.
(a) Wireframe representation of the trimer subunit of MVM with purple patches denoting the sticky subdomains as established by Reguera et al.7 (b) Side-view of the truncated prism used as a coarse-grained model in our simulations. (c)–(f) Top-views of the first, second, third, and the fourth layers in (b). The white, green, and red colored beads denote the sticky hydrophobic, repulsive excluded volume, and positively charged subdomains, respectively. (g) Coarse-grained united atom model of the flexible polyelectrolyte chain.
Based on the realistic description of the trimer by Reguera et al.7 in Fig. 1a, we built a coarse-grained model as depicted in Fig. 1b. In composing our model, we took into consideration several aspects of virus assembly. First, there are a few sticky groups regularly placed on the perimeter of a triangular frame. Next, there must be asymmetric excluded volume interactions to allow curved assembly towards the interior of the virus. Finally, there must be positively charged domains on the interior side of the trimer. In view of this consideration, our coarse-grained model consists of four layers. The first layer is exposed to the exterior of the capsid. The first layer consists of 36 united atoms (beads) arranged uniformly on a triangular lattice with each edge made of 8 united atoms. The edge length of the equilateral triangle is roughly the same as the real protein trimer (∼10 nm). The 8 united atoms, each of diameter (1 nm, corresponding approximately to 3 residues) are regularly spaced along the edge of the triangle. All of the 36 united atoms offer only purely repulsive excluded volume interactions to any other interacting unit in the exterior direction. The second layer is constructed as only a triangular frame sitting exactly on top of the first layer, with the inside of this layer being empty. There are 21 united atoms constituting the frame in the second layer, with 8 united atoms on each edge. The sticky hydrophobic groups are assumed to be present on this frame. The sticky regions of Fig. 1a are now represented by the white beads in Fig. 1b. There are overall 9 sticky united atoms along the perimeter of the second layer. The third layer is placed on top of the second layer. In order to bring about the required wedge from the trimer building blocks in the formation of final icosahedral structure, the frame of the third layer is placed at an angle of 69° uniformly from all edges of the second layer. In fact, the third layer is a cut from a tetrahedron with the second layer being the base. As in the second layer, the interior of the third layer is empty, with all of 18 united atoms placed on the perimeter of the frame of the third layer. Out of these, 6 united atoms are sticky (white beads). The positions of the white beads on the second layer are chosen to closely resemble the experimentally observed locations of the critical residues required for self-assembly. The arrangement of these three layers is then capped by a fourth layer of space-filling triangular lattice made of 10 united atoms. The 9 united atoms making the perimeter of the fourth layer are each assigned a charge +1e, with e being the magnitude of an electronic charge. The middle united atom in the fourth layer is assumed to offer only excluded volume interaction to the interior. Thus, our coarse-grained model of the trimer consists of four layers with the shape of an asymmetric truncated triangular prism. The white beads in the second and third layers offer stickiness to the neighboring trimers. The first layer constitutes the exterior side of the capsid preventing any association in that direction. The third layer provides the asymmetry to facilitate the formation of a wedge of ∼138° between the neighboring trimers. The fourth layer offers electrostatic attraction to negatively charged polymers approaching from the inside of the capsid. The whole construction is then taken as a rigid body in the simulations.
It must be remarked that the composition of the above coarse-graining procedure is motivated by the need to explore the physical phenomena associated with the co-assembly kinetics of interacting proteins and polyelectrolytes and not to focus on the specific details on individual viruses. In fact, the crucial entropic roles12 played by the cationic loops and tails emanating from the interior wall of capsids in real viruses are suppressed and simply represented by a certain net positive charge on the interior surface. Similarly all conformational fluctuations of various units in the virus are ignored. As a result, explicit accounting of angular and bond potentials are unnecessary facilitating the monitoring of assembly kinetics at very long times pertinent to experiments.
Polymer
Since single-stranded RNA or DNA involved in viruses and synthetic polymers used in forming virus-like particles can be modeled as flexible polyelectrolyte chains, we follow the standard united atom prescription for modeling the polymer. As the bead diameter for the trimer of the capsid proteins is taken as about 1 nm, we assume that the united atoms of the polymer are also of diameter 1 nm. This is also comparable to the average persistence length of single-stranded polynucleic acids at physiological conditions and that of synthetic polymers such as sodium(polystyrene sulfonate). As a result, the burden of having to track the angular and dihedral potential is relieved as in our model of the capsid. Reflecting on the genome of MVM, we assume that each bead of the polymer represents roughly three bases with a net charge of −3e. In reality this charge could be much lower due to counterion adsorption. Furthermore, the RNA could readily assume secondary structures17 which in turn might affect the assembly kinetics. In our model, this feature is not included. Our results are perhaps more relevant to simpler polymers such as sodium (polystyrene sulfonate). The interactions between the united atoms and the forces for their connectivity into a chain are given below.
Simulation details
We have modeled the dynamics of the various beads in the system with Langevin dynamics, the computational procedure of which is well documented in the literature.48, 49 Briefly, the trajectory of the ith bead in the system is computed by using the Langevin equation for the j component of the position vector of the ith bead (rij),
| (1) |
where t is the time. mi and ζi are, respectively, the mass and friction coefficient of the ith bead. Ui is the net potential acting on the ith bead, as given below. fij is the j component of the random force acting on the ith bead obeying the fluctuation-dissipation theorem with its magnitude given by (kBT being the Boltzmann constant times the absolute temperature).
There are three kinds of non-bonded potentials acting on each bead, namely the repulsive excluded volume potential, short-ranged Lennard-Jones-like potential, and the screened electrostatic interaction potential. In addition, for the polymer chain, a harmonic bead-spring potential is used to account for the chain connectivity. Both the excluded volume and short-ranged attractive interaction potentials are modeled as
| (2) |
where
| (3) |
The range σ and strength ε are parameters. We have chosen the cut-off rc to be σ for the repulsive excluded volume potential, and rc = 2.5σ for the short-ranged attractive hydrophobic interactions. The pairwise electrostatic interaction potential between the ith bead of charge qi and the jth bead of charge qj separated by a distance r is assumed to be the Debye-Hückel potential,
| (4) |
where ε0 is the permittivity of the vacuum, εr is the dielectric constant of the solution, and κ is the inverse Debye length. The connectivity of any two adjacent beads of the polymer is taken to be Hookean,
| (5) |
where r′ is the bond length, r0 is the equilibrium bond length, and K is the force constant for the bond.
In solving the above equation, we have used the methodology of LAMMPS.49, 50 The velocities and positions of the beads belonging to the trimers of the capsid protein are updated by the Richardson iterations.49 In this technique, the force and torque on individual beads are computed at every time step. Based on these inputs, the net force and torque acting on the trimer subunit are computed. The centers of mass of individual subunits are then translated and the beads belonging to individual subunits are rotated in the new coordinate frames of the respective subunits. Hence the subunits move as single units keeping their shape intact at every time step. Due to this rigid-body motion, it is unnecessary to compute the interaction between the beads within a subunit. The velocities and positions of the polymer beads are updated by the velocity Verlet algorithm.48
All variables in our simulations are expressed in dimensionless Lennard-Jones (LJ) units, fully consistent with LAMMPS. The LJ units of length, mass, time, energy, charge, and temperature are, respectively, σ (taken to be 1 nm), m0 (taken to be 1 kg/mole corresponding roughly to one united atom for a polynucleotide-like polymer), , ε, , and ε/kB. The dielectric constant εr is taken as 80 and 1e = 7.5 LJ units. The Debye length κ−1 is 1 LJ unit, corresponding roughly to 100 mM monovalent strong electrolyte solution at room temperature. The force constant K is given the value of 40 LJ units which is sufficient to keep the bond length within 5% of the equilibrium value of r0 = 1 LJ unit. The ratio of mi to the friction coefficient ζi is taken as 100 LJ time units. ε is taken as unity for the excluded volume interaction and ε is taken in the range from 1 to 5 for hydrophobic interactions. The reduced temperature in our simulations is T* = kBT/ε. We have monitored the effect of temperature on the assembly, by changing ε. As will be discussed below, successful assembly occurs only in the range of 1.8 ⩽ ε ⩽ 2.1, and our choice of ε within this range enables a reliable exploration of the assembly kinetics. The time step in our simulations of proteins is 0.05 LJ units in the absence of the polymer and the time step is 0.02 LJ units in the presence of the polymer.
The simulation box is a cube of side L with periodic boundary conditions. Each simulation is carried out with multiples of 20 subunits (with and without the polymer) and the box length L is chosen to reflect the protein concentration. L is varied from 40 to 100 LJ units. In the beginning of the simulation, the capsid subunits are placed in randomly chosen locations with random orientations inside the box. For the system containing the polymer, the polymer chain is first equilibrated inside the box before inserting the capsid subunits randomly with random orientations. The coordinates of the beads and thermodynamic quantities such as the total potential energy are collected at regular intervals of the simulation for further analysis.
We have monitored the size of the assembly and the orientation of the subunits with respect to each other in the assembled structures. The size of the assembly is determined by monitoring the distance between the centers of mass of the subunits. If the distance between the centers of mass is within 4.5 and 6.0 LJ units then the subunits are considered to be attached. This choice of the cut-off distances is motivated by the economy of the computation time and by the requirement for a successfully assembled structure that there should be an acute angle between the neighboring subunits. The magnitude of the range allows fluctuations in the angle between the inward normals from the subunits. We take the inward normal as the normal from the face of the subunits towards the charged side of the subunit. If the subunits are attached to each other, then the orientation of the subunits with respect to each other is computed by evaluating the dot product of the inward normals of all the adjacent pairs of subunits. Although the angle between the normals in an ideal icosahedron is close to 36°, we have set an upper bound of 60° to allow sufficient fluctuations due to thermal forces. Only if the angle between the neighboring normals is within 60°, the configuration is accepted as a part of the assembling structure. Defining an orientation parameter for each pair of adjacent subunits, we assign a value of unity if the members of the pair have normals within 60°. If the sum of the orientation parameter values for all pairs of subunits in the assembled structure is less than the total number of adjacent pairs in the structure, then the structure is labeled as incorrectly assembled. In a properly assembling structure, the total value of the orientation parameter is identical to the number of adjacent pairs. We have used the orientation parameter to assess the suitable conditions for the formation of proper capsids.
At an intermediate time during the simulation, the trimers constitute a population of partially assembled structures. Let k be the number of the trimers assembled into a correctly assembled structure as outlined above. k = 1 represents individual subunits. We then count the number of such k-mers in the population as nk. The average size of the aggregate is defined as
| (6) |
where the angular brackets denote the average over 200 independent simulations.
In addition to the kinetic pathways of assembly of the virus-like particles, we have used the parallel tempering method51, 52 to calculate the free energy landscape for the assembly process, both in the presence and absence of the polymer. In the parallel tempering method, there are a certain number of replicas of the system. Each replica is in a canonical ensemble with a prescribed temperature. First, the system is allowed to evolve in one replica usually with a higher temperature. Then the information on the configurational details in the first replica is exchanged into another replica with an acceptance probability and the system would evolve in the new replica at the new temperature. After an elapse of certain time, the swapping of configurational information is performed into another replica, and this process is continued. The acceptance probability Pα → β in going from the αth replica to the βth replica is
| (7) |
where Uα and Tα are, respectively, the total potential energy and the temperature of the system in the αth replica. In order to ensure that the average kinetic energy of the system per particle remains as (3/2)kBT, the momentum of the ith particle is scaled to a new value during the swapping between replicas according to
| (8) |
For the case of capsid assembly in the absence of the polymer, the highest temperature at which the system stays predominantly in the free subunit state is kBT = 1.3. In the free energy calculations, the reduced temperature is obtained by fixing ε to be 1.9 and changing the temperature. In order to make sure that the energy histograms of the replicas overlap sufficiently to allow the use of Eq. 7, we have used four replicas at temperatures kBT = 1.0, 1.1, 1.2, and 1.3 in constructing the free energy landscape. In the presence of the polymer, the temperatures of the four replicas are kBT = 1.0, 1.2, 1.4, and 1.6. Instead of equal spacing between successive temperatures, other optimal strategies may be adopted to improve the rate of convergence. Since convergence was attained with the present choice for the current problem, we did not explore other procedures to improve the rate of convergence. The total number of simulation steps (in LJ units) were 5 × 10⁸ and 9 × 10⁸ for the system without and with the polymer, respectively. In the absence of the polymer, the swapping interval and the time step were, respectively, 1 × 10⁷ and 0.04 in LJ units. In the presence of the polymer, the swapping time and the time step were, respectively, 8 × 10⁶ and 0.01 in LJ units. The free energy of the k-mer F(k) is obtained from
| (9) |
with the reference state of F(1) = 0. The average and standard deviation values of free energy were computed from three independent replica exchange simulations.
RESULTS AND DISCUSSION
Polymer-free assembly
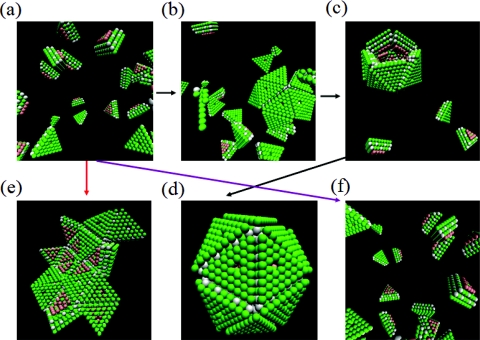
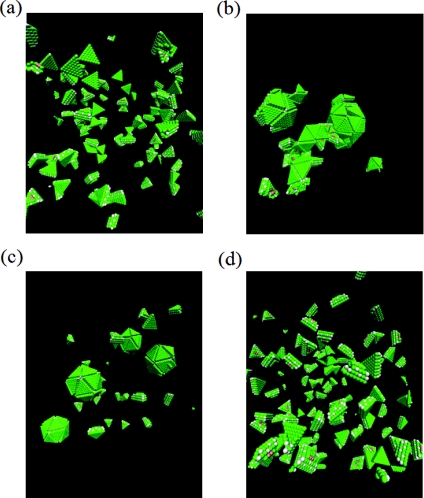
The successful formation of icosahedral shape and the growth kinetics depend delicately on the energetics of the association of the trimeric subunits, which appear through the reduced temperature T* in our simulations. There emerges a narrow temperature range (0.476 < T* < 0.581) in which successful assembly occurs. No assembly is observed at higher temperatures and monster-like particles without the icosahedral symmetry form at lower temperatures. This is illustrated in Fig. 2. Starting from the initial condition (Fig. 2a) of 20 randomly distributed subunits with random orientations inside a cubic box of length 40 LJ units (corresponding to the subunit concentration of c = 0.5188 mM), Figs. 2b, 2c, 2d are the snapshots at t = 105, 5 × 10⁵, and 1.75 × 10⁶, respectively, at T* = 0.5. At this temperature, the final assembled structure is the virus-like particle with full icosahedral symmetry. On the other hand, for the same elapse of time (t = 1.75 × 10⁶), monster-like structures form at T* = 0.45 (Fig. 2e) and no assembly occurs at T* = 0.6 (Fig. 2f). It is thus clear that for the formation of virus-like particles with correct morphological symmetry to occur, the interactions between the subunits need to be sufficiently weak to enable correction of errors during assembly and at the same time sufficiently strong for the assembly to proceed. This scenario is also observed when multiple virus-like particles assemble simultaneously. As an example, the starting configuration (Fig. 3a), with 100 subunits at the subunit concentration of c = 0.5188 mM, leads to monster-like particles (Fig. 3b) at T* = 0.45, multiple virus-like-particles (Fig. 3c) at T* = 0.5, and no assembly (Fig. 3d) at T* = 0.6. Based on such simulations, it is in principle possible to determine the ranges of the reduced temperature for different subunit concentrations, which would allow the formation of correct icosahedral morphology. The determination of such ranges must inevitably depend on the cut-off time set in the simulations to monitor whether or not correct structures formed. This time-consuming exercise might not be that useful in itself as we do not address the specificities of particular viruses in our coarse-grained modeling. Instead, we are satisfied by observing that there is a narrow range of parameters where successful assembly would proceed and then focus on the general mechanisms of assembly in this range of parameters.
Figure 2.
Stable assembly of the icosahedron occurs only at intermediate reduced temperatures. (a) Starting configuration with 20 subunits; (b)–(d) snapshots at t = 105, 5 × 10⁵, and 1.75 × 10⁶, respectively, at T* = 0.5; (e) monster-like particle at t = 1.75 × 10⁶ and T* = 0.45; and (f) no assembly at t = 1.75 × 10⁶ and T* = 0.6.
Figure 3.
(a) Starting configuration with 100 subunits (c = 0.5188 mM) and (b)–(d) final structures at T* = 0.45, 0.5, and 0.6, respectively, at t = 1.75 × 10⁶.
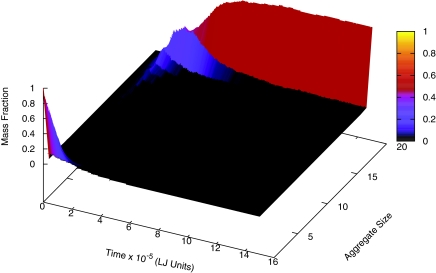
The time-evolution of the population of the k-mers in the system shows that the initial population of unassociated subunits progressively generates larger and larger k-mers until all subunits are incorporated in the final icosahedron. The distribution functions of the mass fraction of k-mers in the entire system are given in Fig. 4 as functions of time. These distribution functions are constructed from 200 independent simulations at T* = 0.5266 and c = 0.5188 mM. As expected, there is a cascade whereby smaller ones feed into bigger ones which in turn feed into even bigger ones. The height, width, and the characteristic time for the peak height increase as the size of the k-mer increases. Similar time evolution has been observed also in the presence of the polymer.
Figure 4.
Time-evolution of the distribution functions of mass fraction of k-mers in the population.
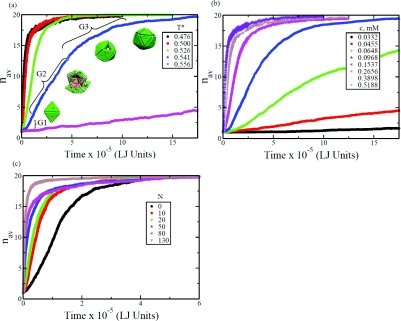
In addition, we have monitored the averaged growth kinetics of individual assemblies by monitoring the average number of subunits, at a given time, that are participants of partially assembled structures but with the correct orientation parameter. The time dependence of the average size of the assembling structure is given in Fig. 5a at different temperatures (c = 0.5188 mM). The representative structures are also included in the figure for T* = 0.526. The effect of subunit concentration on the growth kinetics is illustrated in Fig. 5b at T* = 0.476. The role of polymer in the assembly kinetics is shown in Fig. 5c at T* = 0.5266 and c = 0.5188 mM. It is evident from Fig. 5 that there are generically three regimes: a slower kinetics in the very early stage, a linear growth rate in the intermediate stage, and a slowing down of growth in the final stage. These three features are typical of the phenomenon of crystallization,53, 54 where the general mechanism of crystallization is nucleation and growth. It is not readily obvious from Fig. 5 that there indeed exists a well-marked time range for nucleation to occur. This difficulty arises mainly from the smallness of the assembled structures and the fluctuations that are averaged out in constructing Fig. 5.
Figure 5.
Growth kinetics of average aggregate size nav. (a) Effect of temperature with c = 0.5188 mM (no polymer). (b) Effect of subunit concentration at T* = 0.476 (no polymer). (c) Effect of the polymer length at T* = 0.526 and c = 0.5188 mM.
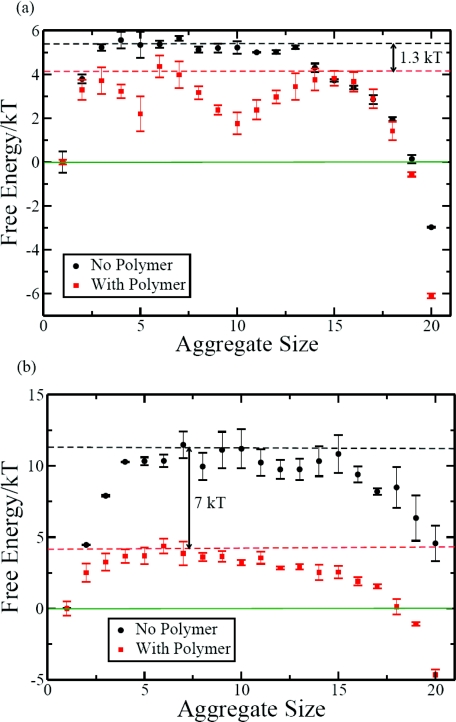
In view of this we computed the free energy landscape to assess the possible existence of nucleation barriers for assembly. In addition, we analyzed the simulation data for individual events during the assembly process (as described below). As discussed in Sec. 2, we computed the free energy landscape by using the parallel tempering method. By taking the free energy of the free unassociated subunits as zero, the free energy landscape for the formation of k-mers is given in Fig. 6. The temperatures are T* = 0.5266 and T* = 0.631 in Figs. 6a, 6b, respectively. The corresponding free energy landscapes in the presence of the polymer are included in these figures for further discussion below. These figures clearly show that there is a free energy barrier for assembly. At T* = 0.5266, the barrier is about 5kBT occurring at about k = 3. It is thus necessary for the formation of trimers of subunits to occur first before the subsequent growth into the fully assembled structure would occur. Also, at this temperature, the final assembled structure is more stable than the unassociated subunits by about 3kBT. In contrast, at the higher temperature of T* = 0.631, the barrier is much larger (about 11kBT) and the assembly is an unfavorable process by about 4kBT. As will be discussed below, the presence of polymer has a profound effect on the free energy landscape and the nucleation barrier.
Figure 6.
Free energy as a function of aggregate size. (a) T* = 0.5266 and (b) T* = 0.631.
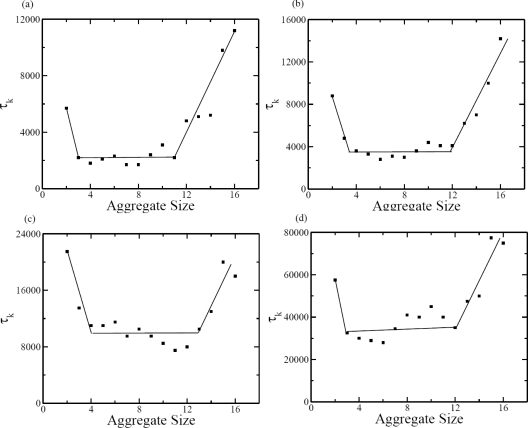
The existence of the barrier for the formation of three associated subunits allows us to delineate the initial nucleation regime with a lag time and the growth regime. These are marked as G1 and G2 in Fig. 5a. The third regime of G3 is the usual slowing down stage in any growth process with continuous depletion of building units in the reservoir. Based on the free energy landscape, the nucleation time is associated with the average time required for the formation of 3-mer. To lend additional support for identifying the size of the critical nucleus, we have monitored the time τk taken by a (k − 1)-mer to form k-mer, as given in Fig. 7 at different temperatures. The time for the formation of 2-mer from the 1-mer is significantly larger than the subsequent steps. The time for addition of one more unit beyond the 2-mer is roughly the same, except at later stages beyond 11-mers. The τk values for k = 12 onwards keep increasing with k. Therefore, these data indicate that G1 phase corresponds to the nucleation of 2-mers, G2 phase corresponds to the linear growth rate for k = 3 − 11, and G3 corresponds to the last slowing down stage. The same features are also seen when we analyzed the data at different subunit concentrations (not shown). It is to be noted that the free energy calculations suggest that the critical nucleus size is three whereas the kinetics data suggest that it is two. Therefore we have computed the average times taken in the formation 3-mers and 2-mers and analyzed the data within the framework of classical nucleation theory.
Figure 7.
Average time τk for the formation of k-mer from (k − 1)-mer at c = 0.5188 mM. The reduced temperatures are (a) 0.476, (b) 0.5, (c) 0.526, and (d) 0.541.
According to the classical nucleation theory,53, 54 the nucleation time depends exponentially on the inverse of the quench depth in temperature Tm − T, where Tm is the melting temperature. By taking the disassembly temperature as and the temperature at which the assembly proceeds as T*, the well known result for the nucleation time τnucl is
| (10) |
where the prefactor A mainly depends on the collision frequency of the subunits and B is a constant depending on the thermodynamic quantities of the assembling system. Similarly, when the subunit concentration is the variable, the nucleation time depends on the supersaturation which is the excess subunit concentration above the minimum concentration cm required for assembly. The result from the classical nucleation theory is
| (11) |
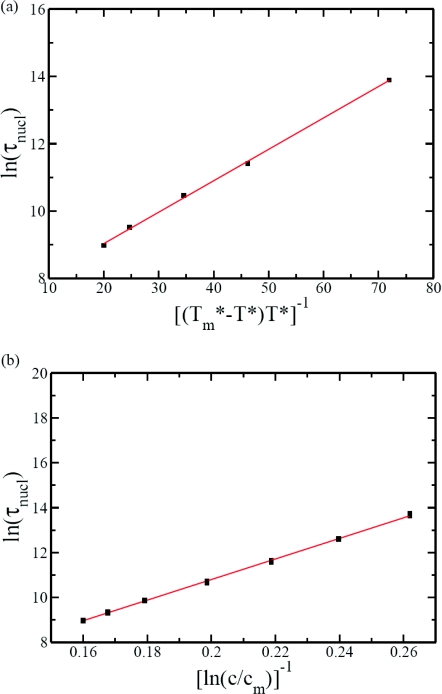
where A′ and B′ are constants. According to Eqs. 10, 11, plots of ln τnucl versus and 1/ln(c/cm) should be linear. These expectations based on the classical nucleation theory turn out to be valid as shown in Fig. 8a (at c = 0.5188 M) and Fig. 8b (at T* = 0.476). In fitting the data in Fig. 8a, the disassembly temperature is taken as the fitting parameter. The fit is indeed good. The value of the fitted disassembly temperature (obtained by assuming that the critical size is a 3-mer) is consistent with simulation results where assembly did not proceed at temperatures higher than this in the absence of the polymer. If we choose the critical nucleus size as a 2-mer, then the fitted value for the disassembly temperature is (the fit not shown). Thus the choice between 2-mer and 3-mer for the critical size does not make any significant difference in . Similarly, the fit shown in Fig. 8b for the dependence of the nucleation time on the supersaturation is good with the fitted minimum assembly concentration being 0.001 mM. Again, the choice of either the 2-mer or the 3-mer as the critical nucleus size does not affect this value of the minimum subunit concentration for assembly. It must be emphasized that the actual values of and cm ought to be dependent on the specificities of the system. Our primary focus here is to find whether the assembly process of virus-like particles proceeds by the nucleation mechanism or not.
Figure 8.
Nucleation time follows classical nucleation theory. (a) Plot of ln τnucl against is linear with the best fit value (and regression coefficient R2 = 0.9989). (b) Plot of ln τnucl against 1/ln (c/cm) is linear with the best fit value cm = 0.001 mM (and regression coefficient R2 = 0.9982).
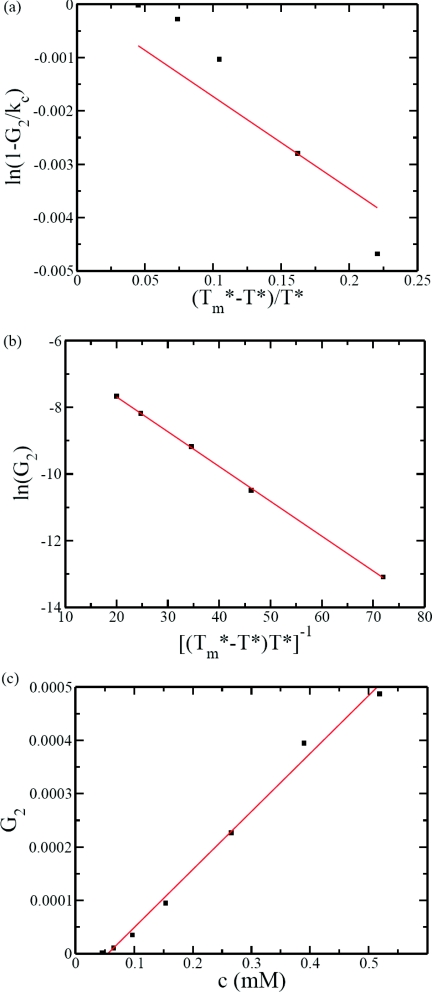
The linear growth rate in the G2 phase of crystallization phenomenon is broadly interpreted as an adsorption/desorption process for small molecular systems and as secondary nucleation process for polymeric systems.55 The theoretical expressions for the growth rate are different for these two mechanisms. For the adsorption/desorption mechanism, the growth rate in the G2 phase is
| (12) |
where B3 is a thermodynamic factor and kc is a concentration dependent factor. For the secondary nucleation mechanism, the growth rate is given by
| (13) |
where A′′ and B′′ are constants. We have fitted the data according to the two above equations, as shown in Figs. 9a, 9b. In Fig. 9a, ln (1 − G2/kc) is plotted against . If adsorption/desorption is the dominant mechanism in the G2 phase, then the plot should be a straight line. This is clearly not observed for any chosen value of kc. On the other hand, the plot of ln G2 against in Fig. 9b is linear in accordance with the secondary nucleation mechanism. It must also be emphasized that the value of the disassembly temperature obtained from the best fit in Fig. 9b is identical to that obtained in Fig. 8a for the primary nucleation. As a result, we conclude that the linear growth rate in the intermediate stage of assembly is analogous to that of the two-dimensional lamellar growth in polymer crystallization. The concentration dependence of G2 is given in Fig. 9c demonstrating a linear proportionality between G2 and c. This linear dependence is mainly due to the stepwise addition of the subunit to the growing assembly. This is consistent with the approximate equal duration required for addition of one more subunit in the G2 phase as seen in Fig. 7.
Figure 9.
Dependence of linear growth rate on temperature and subunit concentration. (a) Adsorption/desorption model is not obeyed as indicated by the poor fit with Eq. 12; the line is with kc = 0.1 and regression coefficient R2 = 0.8094. (b) The linear fit (with and regression coefficient R2 = 0.9997) for ln G2 vs. supports the secondary nucleation model. (c) G2 is linear in subunit concentration.
Polymer-assisted assembly
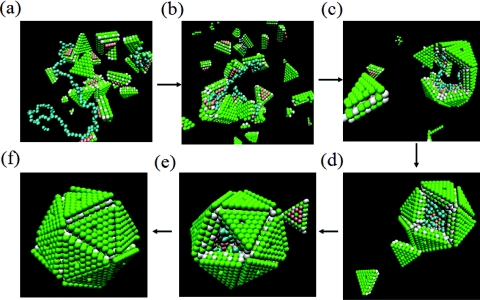
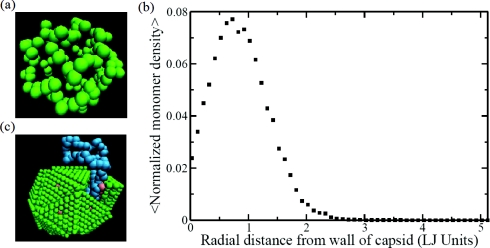
As has already been alluded to in Figs. 56, the presence of the polymer chain significantly affects the assembly process. A typical trajectory is given in Fig. 10 for the chain length N = 130 at c = 0.5188 mM and T* = 0.5266. Figs. 10a, 10b, 10c, 10d, 10e, 10f are snapshots at times 0, 5 × 10³, 1 × 10⁴, 5 × 10⁴, 1 × 10⁵, and 5 × 10⁵, respectively. It is evident from these snapshots that multiple capsid subunits bind with the polymer chain and the local concentration of the subunits is enhanced around the backbone of the chain. Since no specific sequence is endowed on the polymer, the binding occurs equally at all locations of the polymer. As the local concentration of the subunits is increased, the initial assembly of the subunits into the critical nucleus size is facilitated. Also, longer chains promote faster assembly, as long as they are not longer than the maximum length required for the fully assembled virus-like particle. As time progresses, the subunits then associate with the growing assembly further facilitated by the polymer. The polymer gets encapsulated by the subunits as seen in Figs. 10d, 10e. The positions of the united atoms belonging to the polymer are close to the capsid wall, as shown in Fig. 11a. The radially averaged density profile of the polymer from the capsid wall towards the center of the capsid is given in Fig. 11b. This density profile is analogous to the various experimental and theoretical density profiles for the genome in RNA-viruses.12, 27 In the present coarse-grained model, there is an upper bound on the chain length to be fully packaged inside the assembled particle. This bound is roughly N = 130. If N is larger than the bound, a part of the chain hangs outside the particle as shown in Fig. 11c for N = 200.
Figure 10.
Snapshots of assembly in the presence of the polymer (T* = 0.5266, c = 0.5188 mM, N = 130). (a)–(f) correspond to t = 0, 5 × 10³, 104, 5 × 10⁴, 105, and 5 × 10⁵ LJ units, respectively.
Figure 11.
(a) Snapshot of the polymer after co-assembly (N = 130). (b) Radially averaged monomer density distribution (N = 130). (c) The chain spills out of the icosahedron for large values of N (N = 200).
The quantitative aspects of the above mentioned features are seen in Figs. 56. The effect of chain length on the kinetics of assembly is given in Fig. 5c for T* = 0.5266 and c = 0.5188 mM. The curve corresponding to the polymer size being zero is the same as the blue curve in Fig. 5a. As the chain length increases, the growth kinetics becomes faster. For N = 130, the kinetics is an order of magnitude faster than in the absence of the polymer.
The faster growth kinetics in the presence of the polymer can be attributed to the lowering of the free energy barrier for the assembly by the polymer. The free energy landscapes for N = 130 are given in Figs. 6a, 6b at T* = 0.5266 and T* = 0.631, respectively. Several important conclusions can be reached by comparing these landscapes with those in the absence of the polymer in Fig. 6. First, the nucleation barrier for assembly is reduced by the polymer. The barrier is about 4kBT in the presence of the polymer at both temperatures. On the other hand, as we have already noted, the barriers are about 5kBT and 11kBT at the lower and higher temperatures, respectively, in the absence of the polymer. Thus, the nucleation barrier is reduced by the polymer by about 1kBT and 7kBT at T* = 0.5266 and T* = 0.631, respectively. This reduction of the nucleation barrier is responsible for the faster kinetics of assembly in the presence of the polymer. The second conclusion is that the presence of the polymer makes the assembly process more thermodynamically favorable than without the polymer. As shown in Fig. 6b, the thermodynamically unfavorable assembly at T* = 0.631 in the absence of the polymer is made favorable by the polymer. The free energy change is about −5kBT in the presence of the polymer, whereas it is +4kBT in the absence of the polymer at T* = 0.631. At the lower temperature T* = 0.5266, an already favorable assembly is made even more favorable by the polymer chain. Another feature of the free energy landscapes in the presence of the polymer is that there appears a metastable state with about ten subunits in the assembled structure. Given the smallness of the simulated system, we have not explored this feature in more detail in the present work.
The mechanism of assembly thus turns out to be nucleation and growth, both in the presence and absence of the polymer, the nucleation barrier being reduced by the polymer. As already described for the assembly without the polymer, we take the critical nucleus size to be k = 3. Analogous to Fig. 7, we have carried out an analysis of τk in the presence of the polymer. The main result is similar to Fig. 7, except that the kinetics is faster in the presence of the polymer. Again, k = 2 is the critical nucleus size based on these kinetic data. As in the case of assembly without the polymer, the choice of k = 2 or k = 3 for the critical nucleus size does not affect the main conclusions regarding the applicability of the nucleation-growth mechanism for assembly of virus-like particles.
Taking k = 3 for the critical nucleus size, we have collected the average nucleation time. The dependence of the nucleation time on the chain length is predicted by extending the classical nucleation theory for the present case. In view of the random binding of the subunits on the polymer chain without any cooperativity in the initial stages of assembly, the local concentration clocal can be written as
| (14) |
where c is the concentration of the subunits in the bulk and α is a coefficient for the assumed proportionality between the adsorbed subunits and the chain length. Substituting clocal for c in Eq. 11, we expect
| (15) |
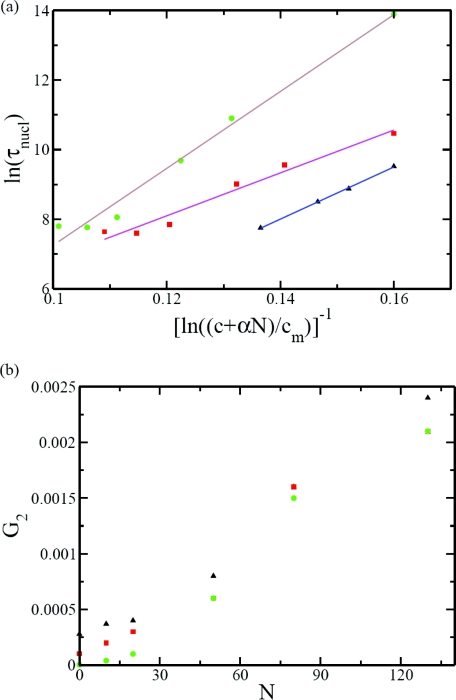
In Fig. 12a, ln τnucl is plotted against at three reduced temperatures (T* = 0.5, 0.526, and 0.556 for c = 0.5188 mM. The value of cm is taken as the same as the value (0.001 mM) in the absence of the polymer as obtained from Fig. 8b. By using α as the single fitting parameter, Eq. 15 is found to be valid. The value of the coefficient α increases roughly linearly with an increase in the reduced temperature, with values 0.02, 0.07, and 0.15 for T* = 0.5, 0.526, and 0.556, respectively. This trend indicates that the enrichment of the local concentration of the subunits is facilitated by an increased conformational freedom of the polymer chain at higher temperatures.
Figure 12.
(a) Plot of ln τnucl vs. 1/ln ((c + αN)/cm) is linear supporting the nucleation mechanism in the presence of polymer. (b) Linear growth rate is approximately linear with the polymer length. In both (a) and (b) the reduced temperatures are T* = 0.556 (circles), 0.526 (squares), and 0.5 (triangles).
The linear growth rate in the G2 phase is also enhanced by the polymer. The dependence of G2 on N is given in Fig. 12b at the same three temperatures as in Fig. 12a (c = 0.5188 mM). The data suggest that the linear growth rate G2 is roughly proportional to N. Since the local concentration of the subunit is proportional to N, this result is consistent with the conclusions based on Fig. 9c.
CONCLUSIONS
Using the experimentally determined previous results of Reguera et al.7 on the nature and the critical features of the building units required for self-assembly of the parovirus minute virus of mice, we have constructed a coarse grained model of the subunits for assembling a virus-like particle. The subunits in our model are the trimers of the capsid protein in the shape of a truncated pyramidal prism. The sides of the subunit are sticky with the neighboring subunits; the outside surface exhibits repulsive excluded volume interaction and the inner surface is positively charged to interact with a negatively charged polymer; and the wedges of the truncated prism allow the necessary curvature in the formation of the icosahedral structure. The polymer is modeled as a flexible uniformly charged polyelectrolyte chain. Starting with a given number of the subunits in the absence and presence of the polymer, the time-evolution of the structures, and their populations were followed with the Langevin dynamics simulation. The free energy landscapes were constructed with the parallel tempering technique. It turns out that only within a narrow region of the parameter space, successful assembly into icosahedra occurs. After establishing this region, we have explored the mechanism of assembly and the dependence of the various measures of assembly on temperature, subunit concentration, and polymer length.
The simulations show that the assembly of the subunits into the final icosahedron follows the nucleation and growth mechanism in the absence of the polymer. The features of the assembly kinetics are quite similar to many crystallization processes. There are three stages: nucleation, growth with linear growth rate, and the slowed down growth in the very late stage of assembly. We have shown that the nucleation time follows the expected laws from the classical nucleation theory regarding the dependencies on temperature and subunit concentration. In our model, the critical nucleus size is about three subunits. The second stage of assembly obeys the linear growth rate law. In the growth regime, we have shown that the growth rate obeys the laws expected from the model of secondary nucleation. This behavior is identical to the growth of two-dimensional lamella of polymer crystals where the well known mechanism is secondary nucleation. The third stage of slowed down growth is due to the continuous depletion of the subunit concentration in the growth medium.
The same mechanism of nucleation and growth is observed in our simulations of the assembly of subunits into icosahedra in the presence of the polymer also. Now, the polymer reduces the free energy barrier that needs to be surmounted for the assembly to occur. We have shown that the local concentration of the subunits is increased in the neighborhood of the polymer, due to random binding of the subunits with the polymer segments, which in turn leads to a reduction in the free energy barrier. We have shown that the nucleation time is smaller for longer chains in accordance with the expectations from the classical nucleation theory, as long as the chain is not too long to be spilling out of the finite sized icosahedron. Also, the linear growth rate in the second stage of assembly has been found to be higher for longer chains. It is remarkable that the expectations from the classical nucleation theory are found to be valid even for such a small system involving only twenty subunits.
The present work is designed to explore the generic mechanism of assembly of icosahedra and how this is affected by the presence of a flexible polymer bearing opposite charge to the net positive charge on the inside surface of the icosahedra. The present model is not suitable for addressing specific issues of virus assembly, although the capsid is fashioned after a realistic virus. This is due to the crude nature of the coarse graining used in the present simulations. Thus, comparisons with experimental data on any particular virus cannot be readily made. However, the present work strongly suggests that the assembly kinetics of viruses must generally follow the nucleation and growth mechanism. In the future, more finer coarse graining can be employed to address more specific questions such as the charge balance between the capsid and the polymer and the sequence effects from the polymer on the assembly.
ACKNOWLEDGMENTS
It is a pleasure to thank C. Forrey for stimulating discussions during the early stage of the project. Acknowledgment is made to the National Institutes of Health (NIH Grant No. R01HG002776-07), National Science Foundation (NSF Grant No. 1105029), Air Force Office of Scientific Research (AFOSR Grant No. FA9550-10-1-0159), and the Materials Research Science and Engineering Center at the University of Massachusetts, Amherst.
References
- Knipe D. M. and Howley P. M., Fundamental Virology, 4th ed. (Williams and Wilkins, Baltimore, 2001). [Google Scholar]
- Angelescu D. G. and Linse P., Soft Matter 4, 1981 (2008). 10.1039/b802597e [DOI] [Google Scholar]
- Hiebert E. and Bancroft J. B., Virology 39, 296 (1969). 10.1016/0042-6822(69)90050-6 [DOI] [PubMed] [Google Scholar]
- Da Poian A. T., Oliveira A. C., and Silva J. L., Biochemistry 34, 2672 (1995). 10.1021/bi00008a034 [DOI] [PubMed] [Google Scholar]
- Zlotnik A. and Stray S. J., Trends Biotechnol. 21, 536 (2003). 10.1016/j.tibtech.2003.09.012 [DOI] [PubMed] [Google Scholar]
- Mateo R., Diaz A., Baranowski E., and Mateu M. G., J. Biol. Chem. 278, 41019 (2003). 10.1074/jbc.M304990200 [DOI] [PubMed] [Google Scholar]
- Reguera J., Carreira A., Riolobos L., Almendral J. M., and Mateu M. G., Proc. Natl. Acad. Sci. U.S.A. 101, 2724 (2004). 10.1073/pnas.0307748101 [DOI] [PMC free article] [PubMed] [Google Scholar]
- Smith D. E., Tans S. J., Smith S. B., Grimes S., Anderson D. L., and Bustamante C., Nature (London) 413, 748 (2001). 10.1038/35099581 [DOI] [PubMed] [Google Scholar]
- Evilevitch A., Castelnovo M., Knobler C. M., and Gelbart W. M., J. Phys. Chem. B 108, 6838 (2004). 10.1021/jp0376525 [DOI] [Google Scholar]
- Forrey C. and Muthukumar M., Biophys. J. 91, 25 (2006). 10.1529/biophysj.105.073429 [DOI] [PMC free article] [PubMed] [Google Scholar]
- Petrov A. S., Lin-Hing K., and Harvey S. C., Structure 15, 807 (2007). 10.1016/j.str.2007.05.005 [DOI] [PubMed] [Google Scholar]
- Belyi V. and Muthukumar M., Proc. Natl. Acad. Sci. U.S.A. 103, 17174 (2006). 10.1073/pnas.0608311103 [DOI] [PMC free article] [PubMed] [Google Scholar]
- van der Schoot P. and Bruinsma R., Phys. Rev. E 71, 061928 (2005). 10.1103/PhysRevE.71.061928 [DOI] [PubMed] [Google Scholar]
- Bruinsma R., Eur. Phys. J. E 19, 303 (2006). 10.1140/epje/i2005-10071-1 [DOI] [PubMed] [Google Scholar]
- Siber A. and Podgornik R., Phys. Rev. E 78, 051915 (2008). 10.1103/PhysRevE.78.051915 [DOI] [PubMed] [Google Scholar]
- Li Z. D., Wu J.-Z., and Wang Z. G., Biophys. J. 94, 737 (2008). 10.1529/biophysj.107.112508 [DOI] [PMC free article] [PubMed] [Google Scholar]
- Yoffe A. M., Prinsen P., Gopal A., Knobler C. M., Gelbart W. M., and Ben-Shaul A., Proc. Natl. Acad. Sci. U.S.A. 105, 16153 (2008). 10.1073/pnas.0808089105 [DOI] [PMC free article] [PubMed] [Google Scholar]
- Hu Y. F., Zandi R., Anavitarte A., Knobler C. M., and Gelbart W. M., Biophys. J. 94, 1428 (2008). 10.1529/biophysj.107.117473 [DOI] [PMC free article] [PubMed] [Google Scholar]
- van den Worm S., Koning R., Warmenhoven H., Koerten H., and van Duin J., J. Mol. Biol. 363, 858 (2006). 10.1016/j.jmb.2006.08.053 [DOI] [PubMed] [Google Scholar]
- Opalka N., Tihova M., Brugidou C., Kumar A., Beachy R., Fauquet C., and Yeager M., J. Mol. Biol. 303, 197 (2000). 10.1006/jmbi.2000.4043 [DOI] [PubMed] [Google Scholar]
- Koning R., van den Worm S., Plaisier J., van Duin J., Abrahams J., and Koerten H., J. Mol. Biol. 332, 415 (2003). 10.1016/S0022-2836(03)00846-5 [DOI] [PubMed] [Google Scholar]
- Chen Z., Stauffacher C., Li Y., Schmidt T., Wu B., Kamer G., Shanks M., Lomonossoff G., and Johnson J., Science 245, 154 (1989). 10.1126/science.2749253 [DOI] [PubMed] [Google Scholar]
- Fisher A. and Johnson J., Nature (London) 361, 176 (1993). 10.1038/361176a0 [DOI] [PubMed] [Google Scholar]
- Larson S., Lucas R., Greenwood A., and McPherson A., Virology 334, 245 (2005). 10.1016/j.virol.2005.01.036 [DOI] [PubMed] [Google Scholar]
- Rossman M., Arisaka F., Battisti A., Bowman V., and Chipman P., Acta Crystallogr. D: Biol. Crystallogr. 63, 9 (2007). 10.1107/S0907444906047330 [DOI] [PMC free article] [PubMed] [Google Scholar]
- Schneemann A., Annu. Rev. Microbiol. 60, 51 (2006). 10.1146/annurev.micro.60.080805.142304 [DOI] [PubMed] [Google Scholar]
- Tihova M., Dryden K., Le T., Harvey S., Johnson J., Yeager M., and Schneemann A., J. Virol. 78, 2897 (2004). 10.1128/JVI.78.6.2897-2905.2004 [DOI] [PMC free article] [PubMed] [Google Scholar]
- Zlotnik A., Johnson J. M., Wingfield P. W., Stahl S. J., and Endres D., Biochemistry 38, 14644 (1999). 10.1021/bi991611a [DOI] [PubMed] [Google Scholar]
- Endres D. and Zlotnik A., Biophys. J. 83, 1217 (2002). 10.1016/S0006-3495(02)75245-4 [DOI] [PMC free article] [PubMed] [Google Scholar]
- Endres D., Miyahara M., Moisant P., and Zlotnik A., Protein Sci. 14, 1518 (2005). 10.1110/ps.041314405 [DOI] [PMC free article] [PubMed] [Google Scholar]
- Kegel W. K. and van der Schoot P., Biophys. J. 86, 3905 (2004). 10.1529/biophysj.104.040055 [DOI] [PMC free article] [PubMed] [Google Scholar]
- McPherson A., Bioessays 27, 447 (2005). 10.1002/bies.20196 [DOI] [PubMed] [Google Scholar]
- Zandi R., van der Schoot P., Reguera D., Kegel W., and Reiss H., Biophys. J. 90, 1939 (2006). 10.1529/biophysj.105.072975 [DOI] [PMC free article] [PubMed] [Google Scholar]
- Forrey C. and Muthukumar M., J. Chem. Phys. 131, 105101 (2009). 10.1063/1.3216550 [DOI] [Google Scholar]
- Siber A., Bozic A. L., and Podgornik R., Phys. Chem. Chem. Phys. 14, 3697 (2012). 10.1039/c1cp22756d [DOI] [PubMed] [Google Scholar]
- Hu T., Zhang R., and Shklovski B. I., Physica A 387, 3059 (2008). 10.1016/j.physa.2008.01.010 [DOI] [Google Scholar]
- Freddolino P. L., Arkhipov A. S., Larson S. B., McPherson A., and Schulten K., Structure 14, 437 (2006). 10.1016/j.str.2005.11.014 [DOI] [PubMed] [Google Scholar]
- Arkhipov A., Freddolino P. L., and Schulten K., Structure 14, 1767 (2006). 10.1016/j.str.2006.10.003 [DOI] [PubMed] [Google Scholar]
- Rapaport D. C., Johnson J. E., and Skolnick J., Comput. Phys. Commun. 121, 231 (1999). 10.1016/S0010-4655(99)00319-7 [DOI] [Google Scholar]
- Rapaport D. C., Phys. Rev. E 70, 051905 (2004). 10.1103/PhysRevE.70.051905 [DOI] [PubMed] [Google Scholar]
- Wales D. J., Philos. Trans. R. Soc. London, Ser. A 363, 357 (2005). 10.1098/rsta.2004.1497 [DOI] [PubMed] [Google Scholar]
- Nguyen H. D., Reddy V. S., and Brooks C. L., Nano Lett. 7, 338 (2007). 10.1021/nl062449h [DOI] [PubMed] [Google Scholar]
- Hagan M. F. and Chandler D., Biophys. J. 1, 42 (2006). 10.1529/biophysj.105.076851 [DOI] [PMC free article] [PubMed] [Google Scholar]
- Hagan M. F., Phys. Rev. E 77, 051904 (2008). 10.1103/PhysRevE.77.051904 [DOI] [PMC free article] [PubMed] [Google Scholar]
- Hagan M. F. and Elrad O. M., Biophys. J. 98, 1065 (2010). 10.1016/j.bpj.2009.11.023 [DOI] [PMC free article] [PubMed] [Google Scholar]
- Kivenson A. and Hagan M. F., Biophys. J. 99, 619 (2010). 10.1016/j.bpj.2010.04.035 [DOI] [PMC free article] [PubMed] [Google Scholar]
- Johnston I. G., Louis A. A., and Doye J. P.K., J. Phys.: Condens. Matter 22, 104101 (2010). 10.1088/0953-8984/22/10/104101 [DOI] [PubMed] [Google Scholar]
- Allen M. P. and Tildesley D. J., Computer Simulation Of Liquids (Clarendon, Oxford, 1987). [Google Scholar]
- Plimpton S., J. Comput. Phys. 117, 1 (1995). 10.1006/jcph.1995.1039 [DOI] [Google Scholar]
- See http://lammps.sandia.gov for details about the Langevin dynamics simulation and parallel tempering simulation methodology.
- Earl D. J. and Deem M. W., Phys. Chem. Chem. Phys. 7, 3910 (2005). 10.1039/b509983h [DOI] [PubMed] [Google Scholar]
- Sugita Y. and Okamoto Y., Chem. Phys. Lett. 314, 141 (1999). 10.1016/S0009-2614(99)01123-9 [DOI] [Google Scholar]
- Doremus R. H., Rates of Phase Transformations (Academic, Orlando, 1985). [Google Scholar]
- Muthukumar M., Adv. Chem. Phys. 128, 1 (2003). 10.1002/0471484237 [DOI] [Google Scholar]
- Kundagrami A. and Muthukumar M., J. Chem. Phys. 126, 144901 (2007). 10.1063/1.2713380 [DOI] [PubMed] [Google Scholar]


