

Abstract
PURPOSE
To correlate spectral domain optical coherence tomography (SD-OCT) findings of perfused diabetic microaneurysms with leakage status on fluorescein angiography (FA) using simultaneous FA and SD-OCT.
DESIGN
Retrospective, observational case series.
METHODS
173 microaneurysms were analyzed in 50 eyes (14 mild nonproliferative diabetic retinopathy (NPDR); 22 moderate NPDR; 9 severe NPDR; 5 proliferative diabetic retinopathy (PDR)) of 40 diabetic patients using simultaneous FA and SD-OCT. The characteristics of microaneurysms were evaluated by two masked observers using SD-OCT and correlated with leakage status on FA.
RESULTS
External diameter of microaneurysms averaged 104 microns (range 43 – 266 microns). Some microaneurysm centers (15/173, 9%) and the outermost extent of microaneurysms (113/173, 68%) were localized to the outer half of the retina. Almost all microaneurysms spanned more than 1 retinal layer (157/173; 91%). Most microaneurysms had an internal lumen with homogeneous reflectivity (109/173; 63%) and moderate reflectivity (87/173; 50%). Both retinal thickness through microaneurysms as well as the presence of adjacent hypo-reflectivity on SD-OCT correlated with increasing leakage status seen on FA (P < 0.001). Microaneurysms’ dimensions, percent depth within the retina, retinal layer location, and internal reflectivity by SD-OCT did not correlate significantly with FA leakage status.
CONCLUSIONS
Simultaneous FA and SD-OCT allows detailed characterization of perfused diabetic microaneurysms. Increased FA leakage of diabetic microaneurysms positively correlated with peri-aneurysm fluid and retinal thickness. Perfused microaneurysms seen by SD-OCT were localized deeper than the inner nuclear layer.
INTRODUCTION
Diabetic retinopathy (DR) is a leading cause of visual loss among working aged individuals in developed countries. This vision loss is often the result of macular edema from leaking microaneurysms 1,2 and may be very difficult to treat.
Clinically, diabetic microaneurysms appear as superficial red dots on fundus exam and as hyperfluorescent spots by fluorescein angiography (FA).3,4 Most knowledge regarding structure and localization of diabetic retinal microaneurysms is derived from histological and pathological studies. 5–10 These studies have shown that diabetic microaneurysms are incompetent vascular outpouchings of the macular capillary bed that primarily arise from the deep part of the inner retinal capillary plexus, 6, 7 and are located in the inner nuclear layer (INL) extending infrequently to the outer plexiform layer (OPL). 7,8 However, most histopathological studies have been based on trypsin digested retinal flat mounts with light microscopy or electron microscopy. 7, 9, 10
More recently, diabetic microaneurysms were characterized using spectral-domain optical coherence tomography (SD-OCT).11 However, understanding of structural differences between non-leaking microaneurysms and leaking microaneurysms which may lead to clinically significant macular edema have not been well-delineated. Better understanding of structure and location of non-leaking or leaking diabetic microaneurysms may improve current treatment approaches to macular edema.
As a non-invasive and non-contact imaging technique, high resolution spectral-domain optical coherence tomography (SD-OCT) with eye tracking allows us to use simultaneous scanning laser ophthalmoscopy (SLO) to co-localize angiographic findings with SD-OCT images. This makes it possible correlate angiographic features and SD-OCT morphology in retinal diseases.12 In this study, we characterize perfused diabetic aneurysms with no, mild, or severe leaking using simultaneous FA and SD-OCT. Our goal is to determine the size, distribution, and reflectivity of these aneurysms and compare angiographic and SD-OCT features.
METHODS
In a retrospective case series from September 2008 to October 2010, microaneurysms (N=173) in diabetic eyes (N=50) that underwent simultaneous FA and SD-OCT imaging were evaluated by two masked retina specialists. Eyes from diabetic patients with both non-proliferative diabetic retinopathy (NPDR) (N=45; Mild=14, Moderate=22, Severe=9) and proliferative diabetic retinopathy (PDR) (N=5) were evaluated. Patients who received anti- Vascular Endothelial Growth Factor (VEGF) treatment in either eye or eyes which received focal or grid laser within 6 months were excluded.
We performed simultaneous FA and SD-OCT (Heidelberg Spectralis, Carlsbad, CA) which allows real-time imaging to co-localize angiographically visible microaneurysms. Microaneurysms were detected as hyperfluorescent dots in the early phase of FA imaging and leakage was graded as no, mild, or severe by comparing the FA images of the microaneurysms in the arteriovenous phase with the images in the late phase. OCT protocol used raster sections of the macula. SD-OCT images were selected with either the vertical or horizontal scanning plane bisecting the center of each microaneurysm. All images were evaluated using a 1: 1 vertical: horizontal aspect ratio. The external and internal diameters of each microaneurysm were measured and the wall thickness was calculated (wall thickness = [external diameter - internal diameter] / 2). To analyze depth distribution of microaneurysms, retinal thickness (RT) through the center of each MA was measured, and the percent depth of each microaneurysm from retinal surface was calculated. To assess the span of each microaneurysm, the innermost and outermost retinal layer that each microaneurysm extended were determined.
To evaluate the heterogeneity of the contents within microaneurysms, internal reflectivity within each lumen was graded as hypo-, moderate, or hyper-reflective. Since microaneurysm walls are hyper-reflective compared to surrounding retinal tissue, the lumen was considered hyper-reflective if reflectivity was similar to the microaneurysm wall. Hypo-reflective was defined as a similar reflectivity to cystic intra-retinal fluid. Moderate reflectivity was determined for reflectivity intermediate to the two. Internal reflectivity was further characterized as homogeneous or heterogeneous. Additionally, immediately external to each microaneurysm within the surrounding retina, we determined whether surrounding hypo-reflectivity was present (Y or N).
Since correlation between two masked observers across all parameters for 30 microaneurysms was highly concordant (93% – 97%), statistical analyses (SAS version 9.2, Carey North Carolina) were performed using data from either observer. Continuous variables were expressed as mean ± standard deviation (SD). Regression analysis using FA leakage grade as a response was performed. A multi-nomial cumulative ordinal model was simulated using generalized estimation equations to deal with the nature of clustered data including inter- and intra-eye associations. A P value < 0.05 was considered to be statistically significant.
RESULTS
Fluorescein angiography
A majority of microaneurysms showed mild angiographic leakage (117/173; 68%). The number of microaneurysms with no leakage (26/173; 15%) or severe leakage (30/173; 17%) was similar. Microaneurysms in eyes with non-proliferative compared to those with PDR revealed no difference in leakage by FA (P = 0.508).
Dimensions of diabetic microaneurysms
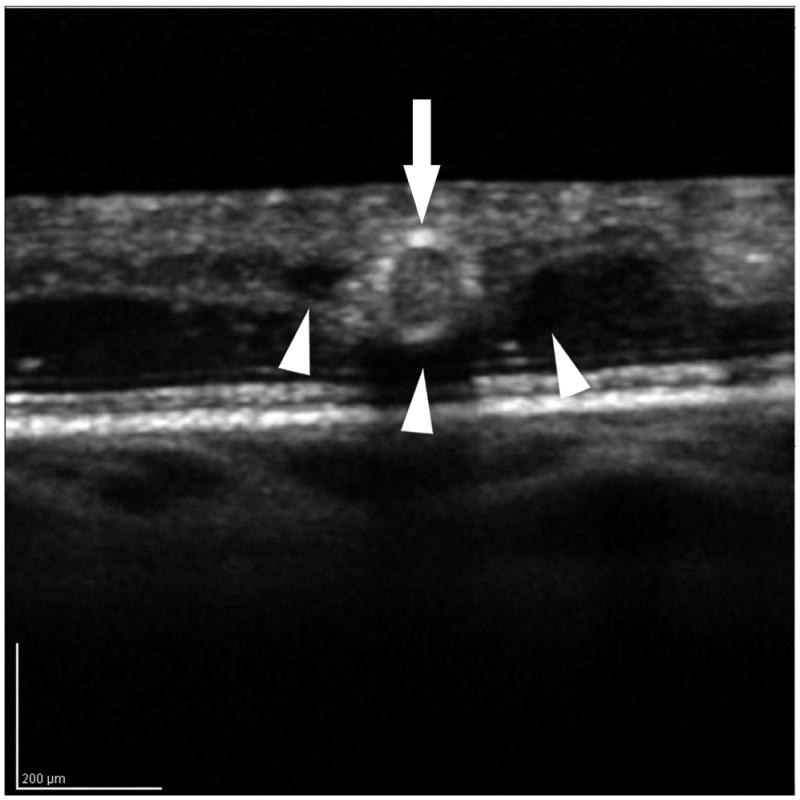
Overall, diabetic microaneurysms had a well-demarcated round or oval shape visualized by SD-OCT (Figure 1) with an external and internal diameter of 104 ± 35 microns and 55 ± 34 microns, respectively. The calculated mean wall thickness was 23 ± 7 microns. No differences in external (P = 0.246) and internal diameters P = 0.349) were observed among aneurysms with no, mild, or severe leakage on FA. The dimension of microaneurysms also did not vary with diabetic retinopathy status (data not shown).
Figure 1.
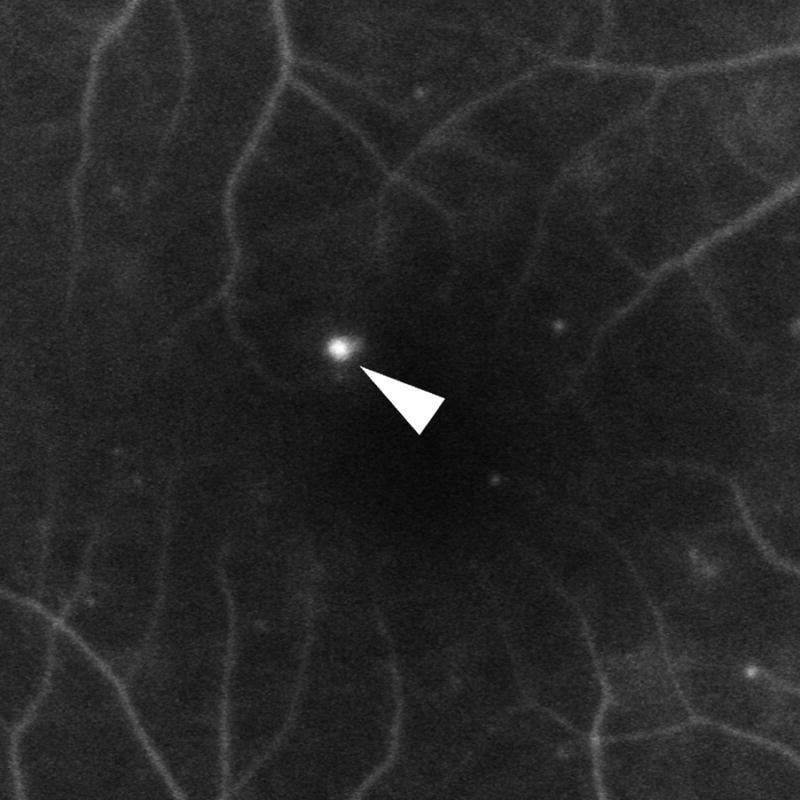
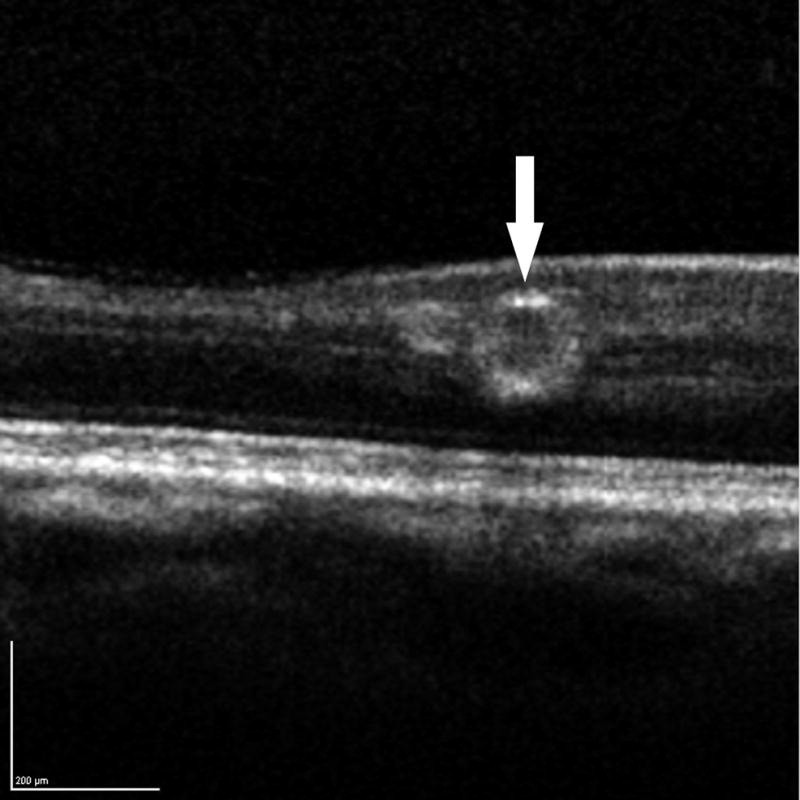
Diabetic microaneurysms visualized by simultaneous fluorescein angiography (FA) and spectral domain OCT (SD-OCT). Left: mild leakage of microaneurysm (arrowhead) seen by FA. Right: A microaneurysm was bisected by vertical scanning plane on SD-OCT (arrow). 1:1 axial: horizontal.
Depth and distribution of diabetic microaneurysms
To assess the percent depth of microaneurysms within the retina, we evaluated the retinal thickness (RT) through the center of each microaneurysm. Increasing angiographic leakage was associated with increasing RT around microaneurysms. Microaneurysms with no, mild, and severe leakage seen on FA resulted in RT of 306 ± 45 microns, 363 ± 86 microns, and 439 ± 96 microns, respectively (P < 0.001, GEE). The majority of diabetic microaneurysms were found at 37 ± 10% depth from the inner retinal surface. No differences in percent depth from the retinal surface were observed among microaneurysms with no, mild, or severe leakage on FA (P = 0.167). Interestingly, a subset of microaneurysms (15/173; 9%) was localized to the outer half (55 ± 5% depth) from the inner retinal surface.
We further characterized the location and extent of the innermost and outermost retinal layers spanned by each diabetic microaneurysm (Figure 2). The innermost extent ranged from the nerve fiber layer (NFL) to the outer nuclear layer (ONL). The innermost extent of the plurality of microaneurysms (73/173; 42%) was the inner plexiform layer (IPL). The outermost extent of microaneurysms ranged from IPL to ONL, with the majority of microaneurysms (168/173; 97%) having an outermost extent localized between the INL and the ONL. No differences between the outermost (P=0.237) and innermost (P=0.582) extents of diabetic microaneurysms were seen among microaneurysms with no, mild, or severe leakage.
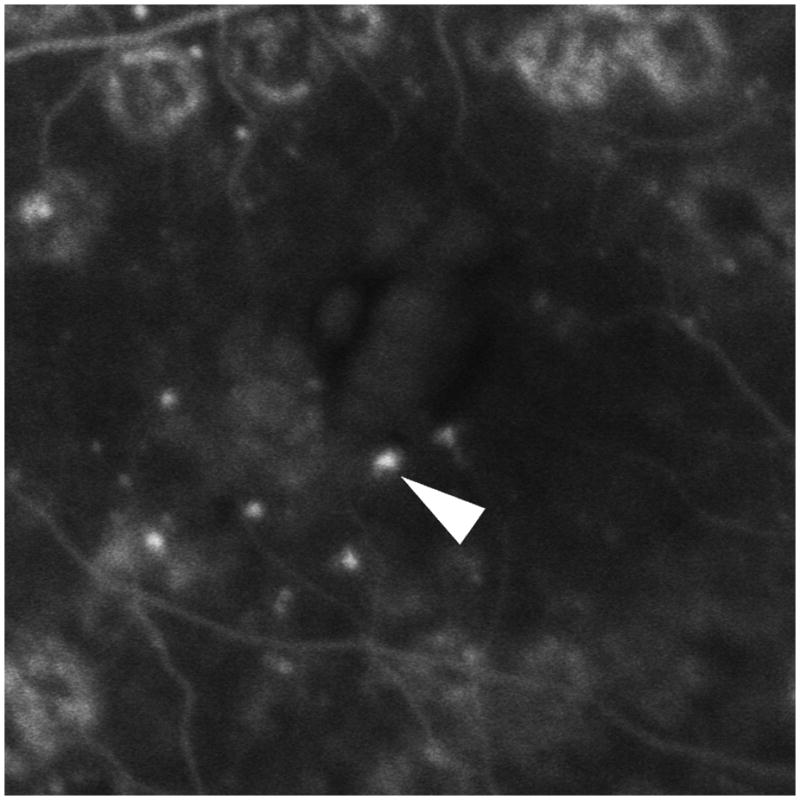
Figure 2.


Distribution of diabetic microaneurysms (N=173) by retinal layers. Top left: Representative mild leakage of microaneurysm (arrowhead) seen on FA. Top right: The same microaneurysm (arrow) visualized by SD-OCT along the vertical scanning plane spanning from IPL to OPL. Middle: The innermost distribution of diabetic microaneurysms by retinal layers extended from NFL to ONL. The innermost distribution of microaneurysms was not statistically significant among FA leakage status (P = 0.582). Bottom: The outermost distribution of diabetic microaneurysms by retinal layers extended from IPL to ONL. The outermost distribution of microaneurysms was not statistically significant among FA leakage status (P= 0.237). NFL: nerve fiber layer; GCL: ganglion cells layer; IPL: inner plexiform layer; INL: inner nuclear layer; OPL: outer plexiform layer; ONL: outer nuclear layer.
The majority of microaneurysms spanned more than 1 retinal layer (157/173; 91%) (Figure 3). Thirty six percent spanned either 1 or 2 retinal layers (63/173; 36%). Similarly, another third spanned 3 retinal layers (61/173; 35%). In addition, nearly one-third of microaneurysms spanned 4 or more retinal layers (49/173; 28%).
Figure 3.
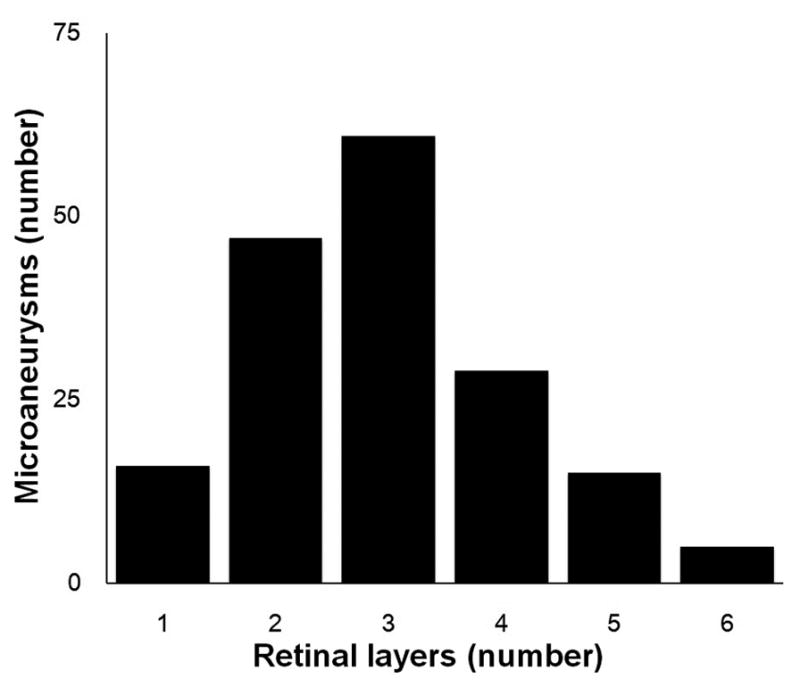
Axial extent of retinal layers occupied by diabetic microaneurysms (N=173). X-coordinate: number of spanning retinal layers by Microaneurysms; Y-coordinate: number of microaneurysms.
Internal reflectivity of microaneurysms by SD-OCT
To further characterize diabetic microaneurysms by SD-OCT, internal reflectivity and lumen heterogeneity or homogeneity was assessed among microaneurysms with no, mild, or severe leakage by FA (Table 1). Among all diabetic microaneurysms, half (87/173; 50%) had a moderate internal reflectivity with the remaining microaneurysm lumens well-distributed between hypo- (35/173; 20%) and hyper-reflectivity (51/173; 30%). A similar distribution of internal reflectivity by SD-OCT was noted within each category of microaneurysms (no, mild, or severe leakage) (P = 0.739). The majority of microaneurysm lumens had a homogenous internal reflectivity (109/173, 63%) while over one-third of microaneurysm lumens were determined to have a heterogenous internal reflectivity. Heterogenous or homogeneous internal reflectivity was similar among microaneurysms with no, mild, or severe leakage on FA (P = 0.186).
Table 1.
Internal reflectivity of diabetic microaneurysms by SD-OCT
| Internal reflectivity | All MAs (N=173) | No leakage (N=26) | Mild leakage (N=117) | Severe leakage (N=30) |
|---|---|---|---|---|
| N (%) | N (%) | N (%) | N (%) | |
| Hyper | 51 (30) | 7 (27) | 34 (29) | 10 (33) |
| Moderate | 87 (50) | 14 (54) | 59 (50) | 14 (47) |
| Hypo | 35 (20) | 5 (19) | 24 (21) | 6 (20) |
| Homogeneous | 109 (63) | 19 (73) | 75 (64) | 15 (50) |
| Heterogeneous | 64 (37) | 7 (27) | 42 (36) | 15 (50) |
MAs:microaneurysms
Adjacent hypo-reflectivity of microaneurysms by SD-OCT
We determined whether there was any adjacent hypo-reflectivity surrounding each microaneurysm using SD-OCT (Table 2, Figure 4). Adjacent hypo-reflectivity consistent with peri-aneurysm edema was observed in half of all microaneurysms (92/117, 52%). Only 3/26 (12%) of no leaking microaneurysms had adjacent hypo-reflectivity, while in the severe leakage group, the majority of microaneurysms (27/30, 90%) were surrounded by hypo-reflectivity in the retina. Adjacent hypo-reflectivity on SD-OCT was associated with increasing FA leakage status (P < 0.001). However, adjacent hypo-reflectivity of microaneurysms was not different in relation to their locations in retina. Out of 158 microaneurysms loated in the inner half of the retina, 81 (51%) had adjacent hypo-reflectivity on OCT and 9 out of 15 (60%) microaneurysms located in the outer half of the retina showed adjacent hypo-reflectivity (P = 0.60).
Table 2.
Adjacent hypo-reflectivity of diabetic microaneurysms by SD-OCT
| Surrounding hypo-reflectivity | All MAs (N=173) | No leakage (N=26) | Mild leakage (N=117) | Severe leakage (N=30) |
|---|---|---|---|---|
| N (%) | N (%) | N (%) | N (%) | |
| Yes | 90 (52) | 3 (12) | 60 (51) | 27 (90) |
| No | 83 (48) | 23 (88) | 57 (49) | 3 (10) |
MAs: microaneurysms
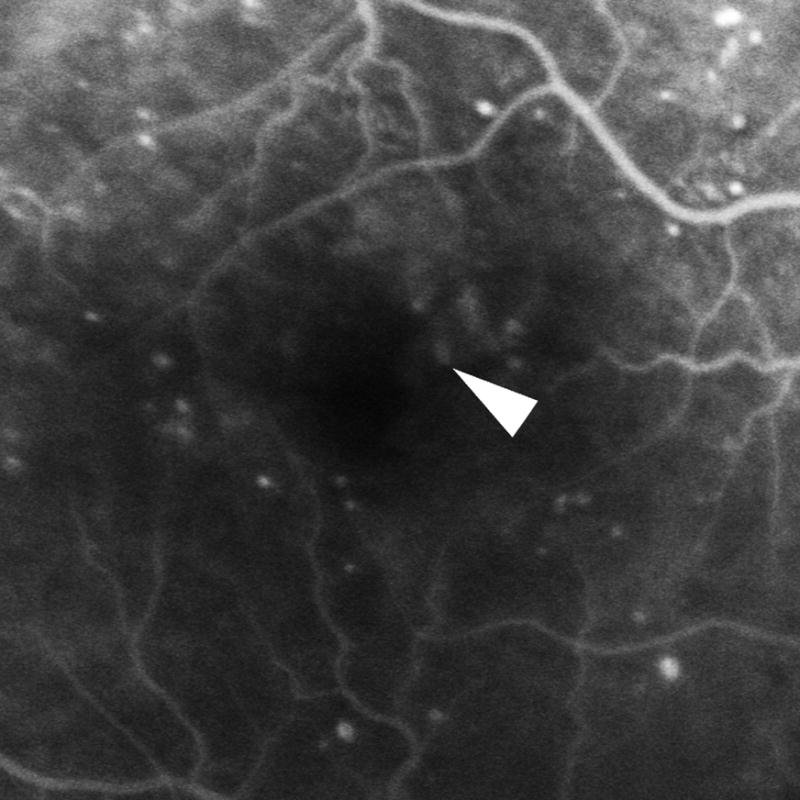
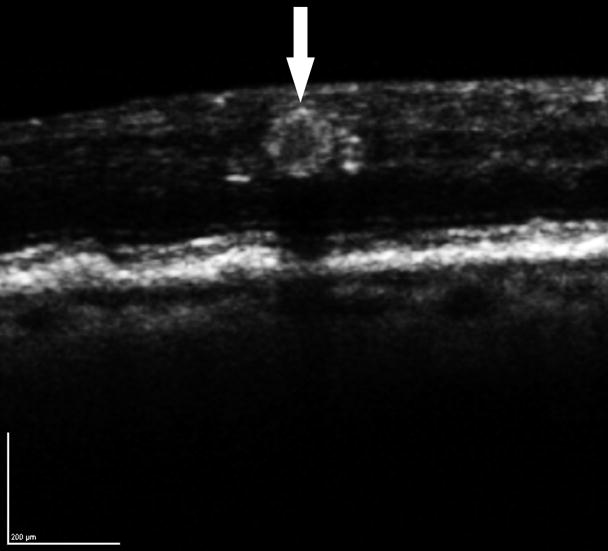
Figure 4.
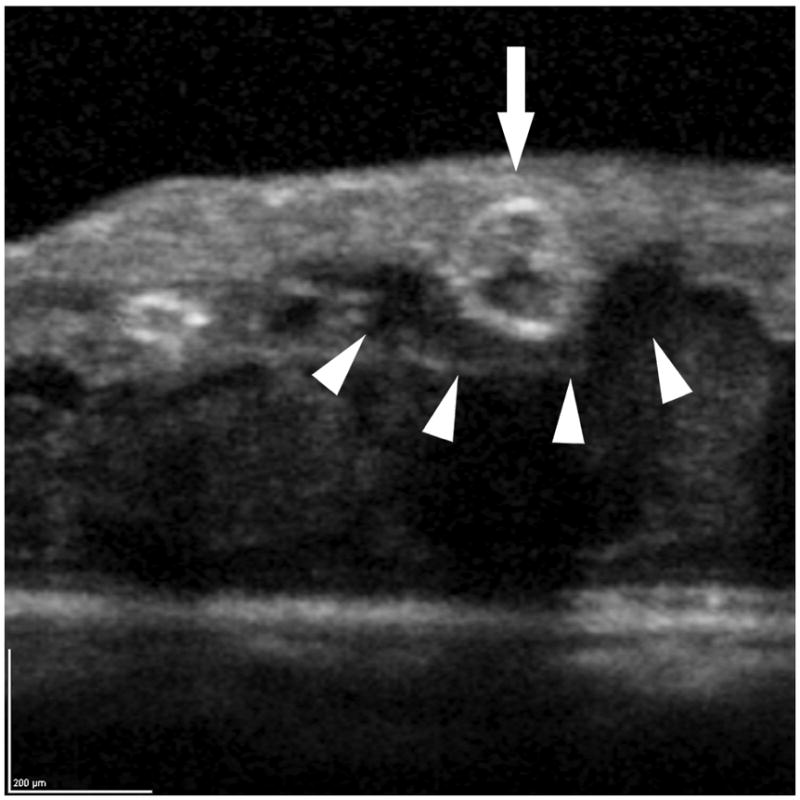
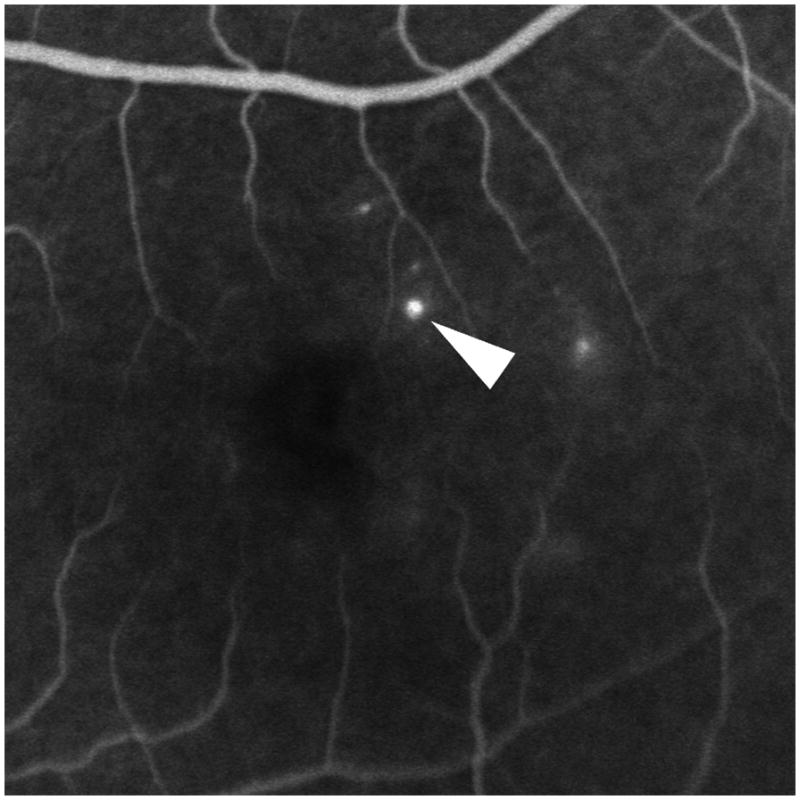
The internal and peri-aneurysm reflectivity of representative diabetic microaneurysms by using SD-OCT. Top left: Severe leakage of microaneurysm (arrowhead) with macular edema was showed on FA. Top right: The same microaneurysm (arrow) with peri-aneurysm hypo-reflectivity (arrowhead) and heterogeneous internal-reflectivity seen by horizontal scanning on SD-OCT. Bottom left: Mild leakage of microaneurysm (arrowhead) seen on FA. Bottom right: The same microaneurysm (arrow) with internal moderate and homogeneous reflectivity as well as peri-aneurysm hypo-reflectivity (arrowhead) visualized by SD-OCT.
DISCUSSION
This study outlines particular SD-OCT characteristics of diabetic microaneurysms and correlates these findings with extent of leakage seen by fluorescein angiography. Although previous studies have also evaluated diabetic microaneurysms using SD-OCT, simultaneous FA allows us to exclude involuted or thrombosed microaneurysms as well as lipid or pigmentary changes not likely contributing to visual pathology (macular edema).
Increasing leakage on FA correlated with increased total retinal thickness through the center of each microaneurysm measured using SD-OCT imaging. This affirms that subtle differences in leakage status seen by FA are detectable by differences in total retinal thickness measurements using SD-OCT imaging. There may exist a threshold change in total retinal thickness which may determine progression to clinically significant macular edema and highlight the need for earlier therapeutic intervention.
After normalization of microaneurysm location to total retinal thickness, no differences were seen in percentage depth of microaneurysms between those with no, mild, or severe leakage status by FA. This suggests that the tendency for microaneurysms to leak is not determined by retinal depth/location. In addition, measuring the internal diameter, external diameter, and wall thickness of diabetic microaneurysms revealed no differences among microaneurysms with no, mild, or severe leakage. It is likely that microaneurysm leakage reflects a functional difference in endothelial cell-cell integrity or permeability rather than an anatomical or size variation between microaneurysms.
Interestingly, the presence of adjacent hypo-reflectivity around diabetic microaneurysms on SD-OCT correlated with positive leakage status seen on FA (Table 2, P < 0.001). The surrounding hypo-reflectivity likely represents an accumulation of peri-aneurysmal fluid or edema. Thus SD-OCT may be a good alternative to assess “leakage” (peri-aneurysmal fluid) in patients with a contraindication to fluorescein angiography. Moreover, efficacy of diabetic macular edema treatment may be monitored by changes in surrounding hypo-reflectivity of microaneurysms using SD-OCT.
The majority of microaneurysms had an innermost location in the IPL (73/173; 42%) and an outermost location between the INL and ONL (168/173; 97%) (Figure 2). Surprisingly, a group of microaneurysm centers (15/173; 9%) were found in the outer half of the retina. In addition, the outermost extent of the majority of microaneurysms (113/173; 65%) was found in the outer half of the retina from OPL to ONL. This suggests that patent or perfused (angiographically visible) microaneurysms are actually deeper than previously described. 7, 13 In addition, over 90% of diabetic microaneurysms spanned more than one retinal layer with only 9% of microaneurysms localized within one retinal layer.
Histological studies have shown that lumen contents of microaneurysms may be comprised of polymorphonuclear cells, red blood cells, fibrotic cells, thrombi, or lipid aggregates. 7 Since all microaneurysms analyzed in this study were perfused by fluorescein, it is not surprising that SD-OCT reflectivity and heterogeneity or homogeneity were similar between microaneurysms with no, mild, or severe leakage seen by FA (Table 1). Currently available software does not permit quantification of internal reflectivity with a numerical scale. Perfused microaneurysms likely contain similar cells with minimal fibrosis or thrombi.
In summary, we have characterized perfused diabetic microaneurysms in detail using simultaneous fluorescein angiography and spectral domain optical coherence tomography. Subtle differences in retinal thickness and peri-aneurysmal fluid attributable to individual microaneurysm leakage and edema may be assessed reliably using SD-OCT. We acknowledge the limitations of this retrospective study which consist of patients with differing disease states and duration of disease. In addition, medical intervention such as laser retinopexy and anti-VEGF treatment may have influenced the leakage of the microaneurysms studied. However, microaneurysms in eyes with either NPDR or PDR revealed no difference in FA leakage (P = 0.508). In addition, our study only included microaneurysms that underwent remote anti-VEGF or laser treatment (more than 6 months), therefore, the impact of medical intervention on characteristic of diabetic microaneurysms may be limited. It may be interesting to evaluate FA leakage with SD-OCT adjacent hypo-reflectivity surrounding microaneurysms prospectively following anti-VEGF or laser treatment.
Acknowledgments
Funding/Support : this study was supported by NIH EY0 7366 (WRF), EY01323 (DUB), The Heed Foundation (CKC), and an Unrestricted Research Fund to Jacobs Retina Center at Shiley Eye Center, University of California, San Diego (LC).
Biography
 Haiyan Wang, MD, PhD, is an international retina fellow at the Jacobs Retina Center/Shiley Eye Center, University of California, San Diego. She received her MD from Weifang Medical College, China, in 1998. Dr Wang joined the faculty at the Department of Ophthalmology, Xijing hospital, China upon receiving her Master Degree In 2001. She received her PhD from the Fourth Military Medical University of China in 2004. Dr Wang’s research interests include medical retina and uveitis.
Footnotes
Financial Disclosures: none.
Statement about Conformity with Author Information: This study conformed to the Declaration of Helsinki for research involving human subjects and was approved by the Institutional Review Board of the University of California, San Diego.
Authors contributions in each of these areas: design of the study (LC, WRF, HW, IK); conduct of the study (HW, JC); analysis of the study (LC, HW, CKC, DUB); writing article (HW, CKC, LC, WRF); critical revision of the article (LC, WRF, JC, DUB, IK); obtaining funding (WRF, DUB, CKC, LC); final approval (HW, JC, WRF, CKC, IK, DUB, LC)
Publisher's Disclaimer: This is a PDF file of an unedited manuscript that has been accepted for publication. As a service to our customers we are providing this early version of the manuscript. The manuscript will undergo copyediting, typesetting, and review of the resulting proof before it is published in its final citable form. Please note that during the production process errors may be discovered which could affect the content, and all legal disclaimers that apply to the journal pertain.
References
- 1.Nunes S, Pires I, Rosa A, et al. Microaneurysm turnover is a biomarker for diabetic retinopathy progression to clinically significant macular edema: findings for type 2 diabetics with nonproliferative retinopathy. Ophthalmologica. 2009;223(5):292–297. doi: 10.1159/000213639. [DOI] [PubMed] [Google Scholar]
- 2.Murakami T, Nishijima K, Sakamoto A, Ota M, Horii T, Yoshimura N. Foveal cystoid spaces are associated with enlarged foveal avascular zone and microaneurysms in diabetic macular edema. Ophthalmology. 2011;118(2):359–367. doi: 10.1016/j.ophtha.2010.03.035. [DOI] [PubMed] [Google Scholar]
- 3.Hellstedt T, Vesti E, Immonen I. Identification of individual microaneurysms: a comparison between fluorescein angiograms and red-free and colour photographs. Graefes Arch Clin Exp Ophthalmol. 1996;234(Suppl 1):S13–17. doi: 10.1007/BF02343042. [DOI] [PubMed] [Google Scholar]
- 4.Friberg TR, Lace J, Rosenstock J, Raskin P. Retinal microaneurysm counts in diabetic retinopathy: colour photography versus fluorescein angiography. Can J Ophthalmol. 1987;22(4):226–229. [PubMed] [Google Scholar]
- 5.Bresnick GH, Davis MD, Myers FL, de Venecia G. Clinicopathologic correlations in diabetic retinopathy. II. Clinical and histologic appearances of retinal capillary microaneurysms. Arch Ophthalmol. 1977;95(7):1215–1220. doi: 10.1001/archopht.1977.04450070113010. [DOI] [PubMed] [Google Scholar]
- 6.Lucas David R. Greer’s Ocular Pathology. 4. Boston: Blackwell scientific publications; 1989. pp. 182–183. [Google Scholar]
- 7.Stitt AW, Gardiner TA, Archer DB. Histological and ultrastructural investigation of retinal microaneurysm development in diabetic patients. Br J Ophthalmol. 1995;79(4):362–367. doi: 10.1136/bjo.79.4.362. [DOI] [PMC free article] [PubMed] [Google Scholar]
- 8.Hogan Michael J, Zimmerman Lorenz E. Ophthalmic pathology an atlas and textbook. 2. Philadelphia: W.B. Saunders; 1962. pp. 506–510. [Google Scholar]
- 9.Yanoff Myron, Sassani Joseph W. Ocular pathology. 6. Edinburgh: Mosby Elsevier; 2009. pp. 604–608. [Google Scholar]
- 10.Fryczkowski AW, Chambers RB, Craig EJ, et al. Scanning electron microscopic study of microaneurysms in the diabetic retina. Ann Ophthalmol. 1991;23(4):130–136. [PubMed] [Google Scholar]
- 11.Horii T, Murakami T, Nishijima K, Sakamoto A, Ota M, Yoshimura N. Optical coherence tomographic characteristics of microaneurysms in diabetic retinopathy. Am J Ophthalmol. 2010;150(6):840–848. doi: 10.1016/j.ajo.2010.06.015. [DOI] [PubMed] [Google Scholar]
- 12.Brar M, Yuson R, Kozak I, et al. Correlation between morphologic features on spectral-domain optical coherence tomography and angiographic leakage patterns in macular edema. Retina. 2010;30 (3):383–389. doi: 10.1097/IAE.0b013e3181cd4803. [DOI] [PMC free article] [PubMed] [Google Scholar]
- 13.Moore J, Bagley S, Ireland G, McLeod D, Boulton ME. Three dimensional analysis of microaneurysms in the human diabetic retina. J Anat. 1999;194 ( Pt 1):89–100. doi: 10.1046/j.1469-7580.1999.19410089.x. [DOI] [PMC free article] [PubMed] [Google Scholar]