

Abstract
Purpose
White matter hyperintensities (WMHs) are a risk factor for Alzheimer’s disease (AD). This study investigated the relationship between WMHs and white matter changes in AD using diffusion tensor imaging (DTI) and the sensitivity of each DTI index in distinguishing AD with WMHs.
Subjects and Methods
Forty-four subjects with WMHs were included. Subjects were classified into three groups based on the Scheltens rating scale: 15 AD patients with mild WMHs, 12 AD patients with severe WMHs, and 17 controls with mild WMHs. Fractional anisotropy (FA), mean diffusivity (MD), radial diffusivity (DR) and axial diffusivity (DA) were analyzed using the region of interest and Tract-Based Spatial Statistics methods. Sensitivity and specificity of DTI indices in distinguishing AD groups from the controls were evaluated.
Results
AD patients with mild WMHs exhibited differences from control subjects in most DTI indices in the medial temporal and frontal areas; however, differences in DTI indices from AD patients with mild WMHs and AD patients with severe WMHs were found in the parietal and occipital areas. FA and DR were more sensitive measurements than MD and DA in differentiating AD patients from controls, while MD was a more sensitive measurement in distinguishing AD patients with severe WMHs from those with mild WMHs.
Conclusions
WMHs may contribute to the white matter changes in AD brains, specifically in temporal and frontal areas. Changes in parietal and occipital lobes may be related to the severity of WMHs. DR may serve as an imaging marker of myelin deficits associated with AD.
Keywords: Magnetic Resonance Imaging, White Matter Hyperintensity, Diffusion Tensor, Alzheimer’s Disease, Diffusivity, White Matter
Introduction
White matter hyperintensities (WMHs) that appear on T2 weighted magnetic resonance imaging (MRI) can be found in diseases, such as hypertension and diabetes, and reflect small vessel diseases indirectly [1]. Due to damage to the cerebral white matter, WMHs, especially when they are confluent, may cause a decline in specific cognitive abilities including memory, executive functioning, and response speed [2,3]. Cerebrovascular pathology in the form of WMHs is commonly observed in patients with Alzheimer’s disease (AD) [4]. It has been suggested that WMHs originating from vascular abnormalities may be a risk factor for Alzheimer’s disease (AD) [5,6]. However, the clinical significance of WMHs in AD patients is not well understood [7]. It is of great interest to investigate whether WMHs are associated with a change in white matter integrity in AD and the decline of cognitive functions in AD. One approach to address this issue is to evaluate white matter tissue affected by WMHs using non-invasive imaging methods, such as diffusion tensor imaging (DTI).
DTI measures the directionality and mobility of water diffusion in tissue and is a powerful tool for studying the structural integrity of white matter fibers that connect cortical regions [8]. Mean diffusivity (MD), an average of eigenvalues (λ1, λ2 and λ3) derived from DTI, is a measure of the average motion of water molecules in all directions, while fractional anisotropy (FA) is a measure of the degree of directional restricted motion of water molecules. More specifically, FA is a scalar value between zero and one that describes the degree of anisotropy of a diffusion process. A value of zero means that diffusion is isotropic, i.e. it is unrestricted (or equally restricted) in all directions. A value of one indicates that diffusion occurs only along one axis and is fully restricted along all other directions. Previous DTI studies have found reductions of FA values in various white matter regions, including the posterior corpus callosum, posterior cingulum, fornix, and bilateral uncinate fibers of AD patients [9,10]. Other regionally unbiased DTI studies have shown FA reductions in parietal and temporal regions as well as in the thalamus and internal capsule of AD patients [11,12]. More recently, axial diffusivity (DA) and radial diffusivity (DR) derived from DTI have also been used to measure specific properties of white matter structure. DA (λ||) is the principal eigenvalue of the diffusion tensor λ1, which is also called the longitudinal diffusivity or the axial diffusivity or even the parallel diffusivity λ||, i.e., λ|| = λ1. On the other hand, DR (λ⊥) is the average of the second and third eigenvalues, i.e., λ⊥ = (λ2 + λ3)/2, which is also be called the perpendicular diffusivity (λ⊥). Since the surrounding myelin sheath is considered to be the main cause of restricted diffusion across axonal fiber tracts, water diffusion anisotropy of axonal fiber tracts likely reflects myelin or axonal integrity [13]. Earlier studies have suggested that DA represents the water diffusion parallel to the axonal fibers in the central nervous system and DR represents the water diffusion perpendicular to the axonal fibers [14]. It is believed that this quantity is an assessment of the degree of restriction due to membranes and other effects and proves to be a sensitive measure of degenerative pathology in some neurological conditions. Therefore, increases of DR and DA observed in white matter are considered to be related to myelin and axonal breakdown [15], although such an interpretation still needs further validation [16].
Despite the importance of understanding the role of WMH in AD and interests in developing non-invasive imaging markers for improving AD diagnosis, only limited studies have reported DTI measured white matter alterations and their possible relation with WMHs in AD patients [3,17]. In this study, we used DTI to investigate whether WMHs are associated with the alteration of white matter integrity of AD patients with varying degrees of WMHs in the periventricular and deep white matter. In addition, we specifically sought to determine which DTI indices, i.e, FA, MD, DR and DA, are useful imaging measurements for distinguishing AD patients from age and gender matched cognitively normal controls.
Subjects and Methods
Subject Recruitment and Assessment
This study was approved by the Emory University Institutional Review Board. Written consents were obtained from all participants and their representatives. Participants were recruited from the Memory Assessment Clinics in the Emory Neurology Department and from the Emory Alzheimer’s Disease Research Center. Twenty seven right-handed subjects (16 men, 12 women; average age of 74.8±6.3 years old) who met NINCDS-ADRDA criteria [18] for AD were included in the study. Based on their WMH scores on the Scheltens rating scale [19], AD patients were divided into two groups: mild WMHs (Group I, n=15) and severe WMHs (Group II, n=12). In addition, 17 cognitively normal age and gender matched subjects with mild WMHs (10 men, 7 women; mean age of 73.6 ±5.2 years) were recruited as a control group (Group III). Subject evaluations included screening for other types of dementia or for coexisting conditions that could affect cognition. All participants did not have histories or findings suggestive of stroke as determined by reviewing their medical records and a neurologic exam.
MRI Data Acquisition
A brain MRI protocol including structural MRI and DTI was performed on each subject using a Siemens 3T Tim/Trio scanner (Siemens Medical System, Malvern, PA) and a standard 8-channel head coil. Parallel imaging with Generalized Autocalibrating Partially Parallel Acquisition (GRAPPA) was used in all scans. For structural MRI, axial 3D T1-weighted multiplanar magnetization prepared rapid gradient echo (MPRAGE) imaging with TR = 45 ms and TE = 15 ms was used with a field of view (FOV) of 240 mm, matrix of 256 × 256, and slice thickness of 1 mm. In addition, T2 weighted fast spin echo (FSE) images (TR = 4900 ms and TE = 110 ms) were collected in the same section location with 60 slices, 2 mm thickness and no gap. These were followed by a fluid-attenuated inversion recovery (FLAIR) sequence, with TR = 6000 ms and TE = 81 ms with 27 slices and 4 mm slice thickness to detect WMHs. For DTI, images were recorded in the axial direction with 60 slices and 2 mm thickness with no gap using the same FOV and slice locations used in T2 weighted imaging. Directional sensitized diffusion-weighted single-shot spin-echo echo-planar imaging sequence with 20 gradient directions was used with the following imaging parameters: TR=9800 ms; TE=74 ms, b values of 0 or 1000 s/mm2. DT images were collected with a matrix of 128 × 128 and then reconstructed to a matrix size of 256 × 256.
Ratings of White Matter Hyperintensities
WMHs are characterized as areas in the deep and periventricular white matter with increased signal intensity found on FLAIR and T2 weighted images. However, lesions with an increased T2 signal but smaller than 2 mm are considered to be perivascular spaces not WMHs [20]. The extent and degree of WMHs were independently assessed by study radiologists (L.W. and C.H.) on axial FLAIR images based on the Scheltens rating scale. This scale provides scores reflecting the severity of WMHs and ratings of subcortical signal hyperintensities according to the size and number of lesions. Briefly, combined scores (0–30) can be assigned for WMHs observed in the cerebral regions of periventricular, deep and subcortical white matter. For the periventricular region including subgroups of frontal, occipital and lateral aspects, respectively, a total score of 0–6 ranges from 0 = no abnormalities, 1 = hyperintensity ≤ 5 mm, or 2 = hyperintensity > 5mm and < 10 mm. Any hyperintensity with a size over 10mm is considered a deep and subcortical hyperintensity. For deep and subcortical white matter (a total score of 0–24), WMHs are scored in the frontal, temporal, occipital and parietal lobes with a score of 0–6 for subgroups. Scores range from: 0 = no abnormalities, 1 = hyperintensity < 3mm and n ≤ 5, 2 = hyperintensity < 3 mm and n > 6, 3 = hyperintensity 4–10 mm and n ≤ 5, 4 = hyperintensity 4–10 mm and n > 6, 5 = hyperintensity >11 mm, and n >1, 6 = confluent). In the current study, if two independent raters differed in their rating by one point, the final rating was given as the mean of the two values. In cases where the difference was greater than one point between the raters, a consensus was reached based on a discussion. Because the size and number of WMHs had significant variations in their scores and locations among individuals, AD patients were divided into two groups according to the total WMH scores: Group I with mild WMHs (mean score: 3.7±1.1) and Group II with severe WMHs (mean score: 11.3±5.3). Subjects in Group I typically had a single WMH lesion with a size ≤ 5mm, while subjects in Group II had more than two WMH lesions with the size > 5mm. Similar to Group I, subjects in the control group (Group III, mean score: 2.1±1.1) also had a single WMH lesion with a size ≤ 5mm. T2 weighted and FLAIR images in Figure 1 show examples of WMHs observed in the different white matter regions of selected subjects with different WMH scores.
Figure 1.

Examples of WMHs observed in T2 weighted MRI and in different white matter regions and WMH scores based on the Sheltens rating scale. Cross section images (A and B) from a subject with mild WMHs show a hyperintensity lesion in the left occipital periventricular region (size < 5 mm, arrow indicated) with a score of 1 (A) and a hyperintensity lesion (size < 3 mm) in the left parietal region with a score of 1 (B). A total score up to 5 can be given to a subject in the mild WMHs category. For the severe WMHs category, WMHs can be also scored for a total of 20. For example, images from a subject in the severe WMHs group shows hyperintensity lesions in the both frontal periventricular regions (5mm < size < 10 mm) that have scores of 4; in the both occipital periventricular regions (size < 5mm) with 2 scores; in the both lateral periventricular regions (size < 5 mm) with 2 scores (C). Confluent hyperintensity lesions in the both of parietal regions shown in (D) are counted for 12 scores.
Image and Data Analysis
Diffusion tensor images were processed and analyzed using the software of FSL (FMRIB, Oxford University, http://www.fmrib.ox.ac.uk/fsl/). Eddy current distortions were corrected to compensate for the stretch and shear in the diffusion-weighted images. Tensor eigenvalues (λ1, λ2 and λ3) were derived and the maps of DTI indices, i.e., FA, MD, DA and DR, were generated using the algorithm implemented in FSL. Maps of DA and DR were calculated on a voxel-by-voxel basis after ranking the eigenvalues (λ1 > λ2 > λ3). DTI data analysis was performed following the standard procedure of voxel-wised cross subject analysis using the measurements obtained from Tract-Based Spatial Statistics (TBSS) implemented in FSL 4.0. All FA maps from the subjects of each group were aligned onto a standard FA template using a nonlinear registration tool provided in the TBSS package [21]. The mean FA map of each group and a mean FA skeleton image that represented the centers of all tracts common to the group were generated. A threshold of FA > 0.2 was set to include the major white matter pathways, but to exclude peripheral tracts where there was significant inter-subject variability and/or partial volume effects with gray matter. The FA map of each subject was then projected onto this skeleton to obtain averaged DTI indices for each group using TBSS. A similar procedure was also applied to the analyses of MD, DR and DA maps. In order to examine white matter changes in selected anatomic regions, FA, MD, DR and DA measurements of each subject were obtained from region-of-interests (ROI) selected on the skeletons derived from TBSS and in reference to anatomical regions shown in T1 weighted images. ROIs, as shown in Figure 2A–C, were typically a volume of 5 × 5 × 5 mm3 and were selected in the white matter regions adjacent to the paracingulate gyrus of the medial frontal area, middle and superior temporal areas, lateral occipital and postcentral gyrus of the parietal lobe, as well as the anterior internal capsule (AIC) and posterior internal capsule (PIC) bilaterally.
Figure 2.

The ROIs were superimposed on the white matter skeleton (green) and anatomical (gray) images of selected regions: (A) frontal, anterior and posterior internal capsule, and occipital areas, (B) superior and middle temporal areas, and (C) parietal lobes.
Statistical Analysis
To detect white matter changes in different anatomical regions, mean FA, MD, DR and DA measured from ROIs of three groups were analyzed and compared using the Analysis of Variance (ANOVA) procedure implemented in the Statistical Package for the Social Sciences (SPSS, Chicago, IL, v15.0). Binary logistic regression with receiver operator characteristic (ROC) analysis was carried out to obtain the sensitivity and specificity of each measurement. Sensitivity and specificity of each DTI measurement in differentiating AD patients from controls was assessed using the area under the curve (AUC) derived from ROC analysis. AUC was used to evaluate the Optimal Cutoff Point, which is given by the maximum of the Youden index. The Youden index J returns the maximal value of the expression (for inverted models, it returns the minimum):
where SE(t) and SP(t) are, respectively, the sensitivity and specificity over all possible threshold values t of the model. Thus, the Optimal Model Threshold corresponds to the model output at the Optimal Cutoff Point. A result with P < 0.05 was considered statistically significant.
We also defined the power of each DTI index in differentiating different groups based on their percentage contributions to the total DTI measurements that showed statistically significant sensitivity and specificity in different white matter structures. Briefly, the number of ROIs which showed statistically significant differences (P < 0.05) in each DTI index was counted as NFA, NMD, NDA and NDR, respectively. The power of each DTI index was calculated as its percentage in the sum of NFA, NMD, NDA and NDR. For example, the power of FA was computed as:
Results
Characterization of WMHs
Table 1 summarizes the demographic features and overall cognitive status of the subjects. There were no statistically significant differences in age and gender among the three groups. In addition, no statistically significant differences between averaged WMH score of Group I (AD with mild WMHs) and Group III (control with mild WMHs) were found. Subjects with mild WMHs in Group I and III had only a single WMH lesion with a size less than 5 mm either in the deep or in the periventricular white matter. However, the sizes of WMHs in Group II were more than 5 mm and typically appeared as multiple confluent lesions scattered in the white matter. As would be expected based on our classification scheme, AD patients with severe WMHs in Group II had significantly higher WMH scores (mean score: 11.3±5.3) than those with mild WMHs in Group I (P = 0.005) and Group III (P = 0.004).
Table 1.
Demographic and clinical information of the participants
| Age (mean±SD) | Gender (M:F) | WMH Scores (mean±SD) | MMSE | |
|---|---|---|---|---|
| Group I (n=15) | 73.5±7.5 | 10:5 | 3.7±1.1* | 23.1±3.3*,** |
| Group II (n=12) | 76.5±4.1 | 7:5 | 11.3±5.3** | 19.8±3.7** |
| Group III (n=17) | 73.1±6.1 | 10:7 | 2.1±1.1* | 29.6±0.5* |
Notes:
Comparison made between Group I and Group II or between Group III and Group II;
Comparison made between Group I and Group III or between Group II and Group III.
Group I consists of AD subjects with mild WMHs; Group II consists of AD subjects with severe WMHs and Group III is a normal control group consisting of individuals with mild WMHs.
There was a pattern for lower MMSE scores in subjects with higher WMH scores. AD subjects with severe WMHs had the lowest MMSE scores (19.8±3.7) and the highest WMH scores (11.3±5.3). Control subjects had the highest MMSE scores (29.6±0.5) and the lowest WMH scores (2.1±1.1).
White Matter Changes
Figure 3 shows the differences in FA, MD, DR and DA values between AD patients in Group I and control subjects in Group III who have comparable mild WMH scores. AD patients had significantly decreased FA values in the bilateral frontal lobes (left P = 0.014; right P = 0.008), bilateral middle temporal lobes (left P = 0.003; right P = 0.049), AIC (left P < 0.001; right P = 0.006), and in the superior left temporal lobe (P < 0.001). The decreased FA values were coupled with increased DR values. MD values increased only in several regions of the temporal area, and DA values increased only in the left temporal lobe, including middle and superior temporal regions.
Figure 3.

Comparisons of averaged FA and/or MD values (A) and DR and/or DA (B) of different groups in the plot allow for showing white matter changes in specific white matter structures. * indicates the DTI measurement reached statistical significant differences (P<0.05) when comparing AD patients with mild WMHs (Group I) to control subjects with mild WMHs Group III).
When AD subjects in Group I and Group II were compared (shown in Table 2), the AD subjects with severe WMHs had significantly increased MD values in the bilateral parietal lobes (left P = 0.052; right P = 0.046), AIC (left P = 0.003; right P = 0.002), PIC (left P = 0.051; right P = 0.004), and in the right occipital region (P = 0.03). The increased MD values also were coupled with increased DR values; however, DA values increased only in the bilateral parietal lobes (left P = 0.045; right P = 0.041) and AIC (left P = 0.008; right P = 0.003). Decreased FA values were found in several structures of the right cerebral hemisphere, including right occipital (P = 0.026) and right parietal areas (P = 0.014), as well as right AIC (P = 0.016) and right PIC (P = 0.002).
Table 2.
Mean FA, MD, DR and DA of selected regions in AD subjects with mild and severe WMHs
| ROIs | FA | MD | DR | DA | ||||
|---|---|---|---|---|---|---|---|---|
| Group I | Group II | Group I | Group II | Group I | Group II | Group I | Group II | |
| LO | 0.42±0.05 | 0.40±0.08 | 0.76±0.08 | 0.78±0.06 | 0.59±0.08 | 0.64±0.04* | 1.12±0.08 | 1.16±0.11 |
| RO | 0.42±0.06 | 0.38±0.05* | 0.75±0.04 | 0.83±0.09* | 0.58±0.05 | 0.66±0.08* | 1.14±0.09 | 1.14±0.12 |
| LP | 0.36±0.06 | 0.33±0.05 | 0.78±0.08 | 1.18±0.61* | 0.69±0.09 | 0.92±0.32* | 1.07±0.06 | 1.56±0.67* |
| RP | 0.39±0.02 | 0.32±0.08* | 0.82±0.07 | 1.16±0.57* | 0.66±0.08 | 0.87±0.21* | 1.08±0.06 | 1.63±0.65* |
| LAIC | 0.45±0.05 | 0.41±0.07 | 0.80±0.06 | 1.03±0.20* | 0.58±0.06 | 0.77±0.19* | 1.24±0.09 | 1.48±0.25* |
| RAIC | 0.49±0.05 | 0.43±0.07* | 0.83±0.07 | 1.08±0.20* | 0.58±0.07 | 0.79±0.20* | 1.32±0.08 | 1.56±0.22* |
| LPIC | 0.65±0.03 | 0.63±0.05 | 0.69±0.06 | 0.76±0.09* | 0.39±0.05 | 0.45±0.08* | 1.29±0.08 | 1.39±0.13* |
| RPIC | 0.66±0.02 | 0.61±0.04* | 0.72±0.05 | 0.80±0.07* | 0.40±0.04 | 0.49±0.07* | 1.36±0.10 | 1.43±0.09 |
Notes:
: P < 0.05, Comparisons between Group I and Group II. All diffusivities are in the unit of μm2/ms. Group I is AD with mild WMHs; Group II is AD with severe WMHs. LO: left occipital; RO: right occipital; LP: left parietal; RP: right parietal; LAIC: left anterior internal capsule; RAIC: right anterior internal capsule; LPIC: left posterior internal capsule; RPIC: right posterior internal capsule.
When AD subjects with severe WMHs were compared with the controls, we observed significantly decreased FA, and increased MD and DR values in most of the selected ROIs. However, increased DA values were only observed in a few ROIs. Furthermore, both decreased FA and increased DR were more pronounced in the left cerebral hemisphere of AD subjects when compared with controls, as shown in Figure 4. Such lateralization was not observed among AD subjects with different degrees of WMHs.
Figure 4.
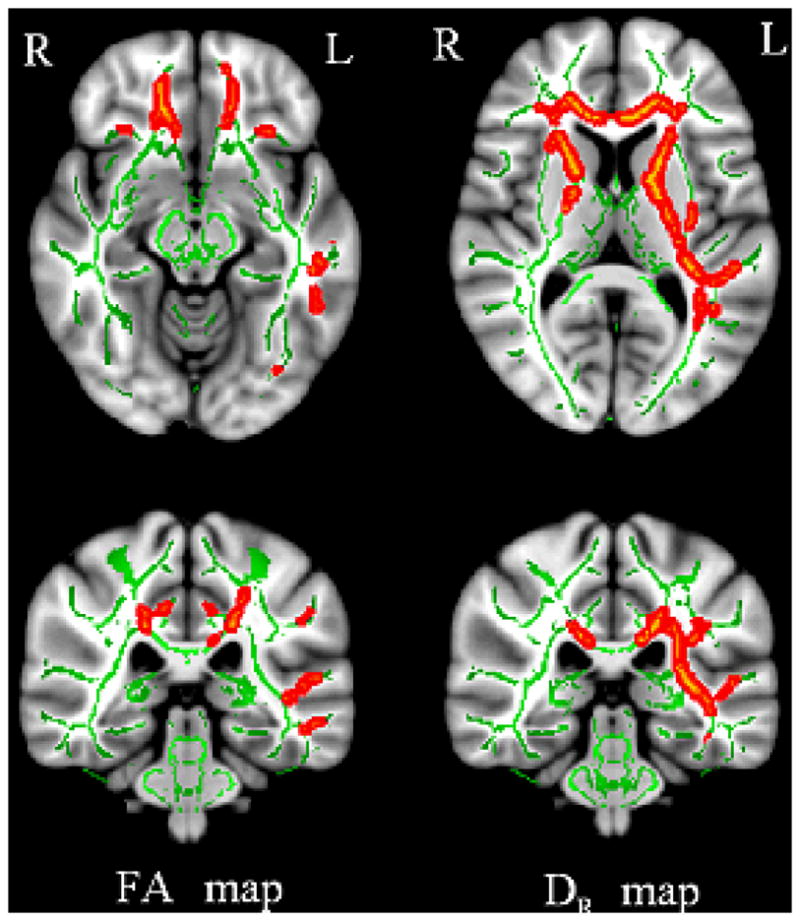
The differences in white matter changes between AD with mild WMHs (Group I) and controls with mild WMHs Group III) appear to be lateralized in the left cerebral hemisphere. The contrast maps between DTI indices of Group I and Group III are superimposed on the white matter skeleton (green) from TBSS to demonstrate the alterations (red) of FA (right panel) and DR (left panel).
Sensitivity and Specificity of DTI Indices
The results from ROC analyses as summarized in Table 3 show that specific DTI indices and measurements, especially obtained from the left temporal and bilateral AIC regions, differentiated AD patients from controls. Moreover, FA and DR measured from the left cerebral hemisphere were particularly sensitive. Using FA value changes in the superior left temporal region, subjects with AD could be differentiated from controls with a sensitivity of 88% and a specificity of 60%. When using FA value changes in the left AIC, sensitivity and specificity reached 94% and 53%, respectively.
Table 3.
Sensitivity and specificity of DTI indices in differentiating AD from normal controls*
| Regions | DTI Indices | AUC | Sensitivity | Specificity |
|---|---|---|---|---|
| LAIC | FA | 0.87 | 0.94 | 0.53 |
| LST | FA | 0.85 | 0.88 | 0.60 |
| RAIC | FA | 0.83 | 0.82 | 0.80 |
| RMT | DR | 0.81 | 0.87 | 0.83 |
| LST | MD | 0.81 | 0.87 | 0.61 |
| LMT | DR | 0.80 | 0.80 | 0.61 |
| LST | DR | 0.80 | 0.80 | 0.61 |
| LMT | FA | 0.80 | 0.82 | 0.67 |
Notes:
data with AUC ≥ 0.80 are presented.
LAIC: left anterior internal capsule; LST: left superior temporal region; RAIC: right anterior internal capsule; RMT: right middle temporal region; LMT: left middle temporal region.
The sensitivity or the power of different DTI indices, i.e. FA, DR, MD and DA in differentiating AD with WMHs from controls was also evaluated by examining the number of ROIs that exhibited statistically significant changes in each DTI index. A DTI index with a higher percentage of ROIs among all ROIs was considered to be more powerful than others. Interestingly, we found that a greater number of ROIs exhibited significant changes of FA and DR than other DTI indices when comparing AD subjects in Group I to control subjects in Group III with PFA = 39% and PDR = 33%, respectively (Figure 5A). This suggests that FA and DR were more powerful measurements than MD and DA in differentiating AD patients from controls. In contrast, when AD subjects with different degrees of WMHs in Group I and Group II were compared, changes in MD and DR were found in 29% and 33% of all specific ROIs, respectively (Figure 5B). PMD and PDR were higher than that of PFA and PDA, suggesting that MD and DR are more sensitive measurements in discriminating AD patients with severe versus mild WMH.
Figure 5.

The pie plots demonstrate the power of each DTI measurement in distinguishing AD patients with mild WMHs (Group I) from controls with mild WMHs (Group III) (A), and differentiating AD patients with mild WMHs (Group I) from AD patients with severe WMHs (Group II) (B). The chart is normalized from the sum of all ROIs exhibiting statistically significant differences in at least one of the DTI indices, i.e. FA, DR, MD and DA. With higher percentages of effective ROIs compared to the others, FA and DR were more sensitive measurements for distinguishing AD patients from controls, and MD was more effective for differentiating the severity of WMHs.
Discussion
The presence of WMHs in AD patients has been associated with reduced cognitive scores [22], and an earlier study with MRI and DTI suggested that cerebrovascular pathology has a stronger impact on the diffusivity value than AD pathology alone [23]. However, studies using simple behavioral rating scales to assess total WMH burden have yielded less consistent evidence linking cognition and WMHs in AD [24,25,26,27]. Our study demonstrates that FA and DR are sensitive in differentiating AD patients from normal controls. In addition, MD is more sensitive in differentiating AD patients with severe versus mild WMHs. These findings suggest that it is important to examine individual DTI indices when evaluating white matter in order to better understand the role of WMHs in changes in white matter and cognitive functions. Although mechanisms and biological origins of individual DTI indices are a subject of further investigation, increased DR is generally considered to reflect that more water diffusion is occurring perpendicular to axons, representing less myelination or reduced oligodendroglial integrity [8]. Therefore, DR may be a characteristic of AD related white matter disruptions in the form of demyelination that is different from the axonal damage as measured by FA.
A number of studies, including the current study, have provided experimental evidences that DR and/or DA appear to be more specific to the white matter changes than the overall measurement of FA, which is the square root of the sum of squares (SRSS) of the diffusivity differences, divided by the SRSS of the diffusivities. One possible explanation is that FA is an average of the differences of several directionally sensitive diffusion measurements, including DR and DA, but not specific components that may be affected by the disease process preferentially. In addition, a highly intact white matter area may consist of crossing fibers which may lead to a low FA value, even though individual diffusivities, DA and DR are high. In contrast, individual measurement of DR or DA may provide more specific characterizations of diffusion restrictions and minimize the underestimation of white matter fiber with FA. Thus, examining DR or DA can potentially lead to the more sensitive detection of white matter changes.
Similar to the previous studies [15], we observed white matter changes as measured by FA and DR values in the middle and superior temporal lobes [28], frontal lobes [29] and AIC, when comparing AD patients with mild WMHs to controls (i.e., Group I vs. Group III). In addition, the current study examined whether regional WMHs were responsible for their DTI changes and showed that the degree of white matter changes, specifically as measured by MD, was associated with the extent of WMHs in specific brain areas. The changes in MD and DR values were localized to the parietal and occipital lobes and the AIC and PIC, when comparing AD patients with mild WMHs and severe WMHs (i.e., Group I and Group II). To our knowledge, such patterns of white matter changes have not been reported previously. Taking the results derived from the group comparisons as a whole, our current study supports the notion that WMHs are associated with white matter changes in frontal and temporal regions in AD brains. Furthermore, it is possible that WMHs may also mediate the white matter changes in parietal and occipital areas of AD patients. However, the underlying mechanism of such patterns of white matter changes and their relationships to the severity of WMHs and focal atrophy suggestive of AD, such as hippocampal atrophy, need further investigation and validation.
We found that most subjects had WMHs in the basal ganglia region (such as AIC and PIC), which is consistent with an earlier study [30]. This observation is intriguing with regard to our suggestion of the link between WMHs and AD. One possible explanation is that the region specific white matter damage reflected by WMHs may be related to the small vascular structures of these areas. The AIC contains frontopontine (corticofugal) fibers which project from the frontal cortex to the pons, and thalamocortical fibers which connect the medial and anterior nuclei of the thalamus to the frontal lobes. The lenticulostriate branches of the middle cerebral artery (superior half) and recurrent artery of Heubner from the anterior cerebral artery (inferior half) are important for the blood supply to the AIC. These small arteries are particularly susceptible to narrowing in the setting of chronic hypertension, and can result in small, punctuate lacunar infarctions or intraparenchymal hemorrhage and WMHs observed on MRI. The central branches of the middle cerebral artery are the medial and lateral striata arteries which provide blood supply to the basal ganglia, internal capsule, and thalamus. When there is damage to these arteries, the fibers within the internal capsule can be damaged, causing functional impairments. The striata consists of very thin arteries that have high internal blood pressure. They are considered by many to be vulnerable to hemorrhages and to blockages, consequently disrupting cognitive functions.
Another interesting finding in the current study is that the white matter alterations were greater in structures lateralized in the left hemisphere of AD patients, similar to what has been reported in previous studies [31,32]. Although it is not clear whether the left hemisphere is inherently more vulnerable than the right in AD patients, the importance of white matter structures in the left cerebral hemisphere in relation to cognitive functions, including language has been extensively investigated. The contribution of WMHs and DTI measured changes in white matter integrity with performance on a battery of cognitive measures in the same study cohort is currently underway.
We recognize that the current study has several limitations, including: 1) the small sample size in Group II due to the difficulty in identifying AD patients who have a high degree of WMHs but do not have a stroke history; and 2) the lack of a cognitively normal age-matched control group with severe WMHs, in order to determine whether the relationship between WMHs and AD is unique. In addition, limited subjects limited this study from further examining the role of WMHs in the changes of white matter integrity in the regional specific manner, e.g., association of frontal WMHs to the FA changes in the frontal lobe. Therefore, the suggestions that the extent of WMHs is associated with in certain specific brain areas and that individual DTI indices, such as DR and FA are specific to the types of white matter changes still need to be tested and validated in the future studies.
Conclusions
This study provides further evidence that white matter alterations, as measured by DTI, occur in the temporal and frontal areas of AD patients with mild and severe degrees of WMHs. WMHs may mediate the white matter damage in certain regions of AD brains, specifically in parietal and occipital areas. Among measurable DTI indices, FA and DR are more sensitive in discriminating AD patients with WMHs from controls, while MD is more effective in discriminating AD patients with severe WMHs from AD patients with mild WMHs. Furthermore, radial diffusivity (DR) may reveal insight concerning the underlying biological changes of white matter, suggesting that DR may be an imaging marker for myelin deficits caused by WMHs and/or AD.
Acknowledgments
The authors thank Dr. Longchuan Li (Department of Biomedical Engineering, Emory University) and Dr. Xiaodong Zhong (MR R&D Collaborations, Siemens Medical Solutions) for their assistances and helpful discussions.
This study was supported in part by a grant from NIH (R21AG027335 to HM) and a pilot project grant from The Emory Alzheimer’s Disease Research Center (NIH-NIA P50 AG025688 to HM).
Abbreviations
- MRI
Magnetic resonance imaging
- DTI
Diffusion Tensor Imaging
- WMHs
White matter hyperintensities
- AD
Alzheimer’s disease
- TBSS
Tract-Based Spatial Statistics
- FA
Fractional anisotropy
- MD
Mean diffusivity
- DR
Radial diffusivity
- DA
Axial diffusivity
- ROC
Receiver operator characteristics
- AUC
Area under curve
- AIC
Anterior internal capsule
- PIC
Posterior internal capsule
Footnotes
Conflict of interest statement
The authors declare that we have no conflict of interest.
References
- 1.Schmidt R, Schmidt H, Kapeller P, Enzinger C, Ropele S, et al. The natural course of MRI white matter hyperintensities. J Neurol Sci. 2002;203–204:253–257. doi: 10.1016/s0022-510x(02)00300-3. [DOI] [PubMed] [Google Scholar]
- 2.Gunning-Dixon FM, Brickman AM, Cheng JC, Alexopoulos GS. Aging of cerebral white matter: a review of MRI findings. Int J Geriatr Psychiatry. 2009;24:109–117. doi: 10.1002/gps.2087. [DOI] [PMC free article] [PubMed] [Google Scholar]
- 3.Madden DJ, Bennett IJ, Song AW. Cerebral white matter integrity and cognitive aging: contributions from diffusion tensor imaging. Neuropsychol Rev. 2009;19:415–435. doi: 10.1007/s11065-009-9113-2. [DOI] [PMC free article] [PubMed] [Google Scholar]
- 4.Appel J, Potter E, Bhatia N, Shen Q, Zhao W, et al. Association of white matter hyperintensity measurements on brain MR imaging with cognitive status, medial temporal atrophy, and cardiovascular risk factors. AJNR Am J Neuroradiol. 2009;30:1870–1876. doi: 10.3174/ajnr.A1693. [DOI] [PMC free article] [PubMed] [Google Scholar]
- 5.Lee DY, Fletcher E, Martinez O, Ortega M, Zozulya N, et al. Regional pattern of white matter microstructural changes in normal aging, MCI, and AD. Neurology. 2009;73:1722–1728. doi: 10.1212/WNL.0b013e3181c33afb. [DOI] [PMC free article] [PubMed] [Google Scholar]
- 6.Riekse RG, Leverenz JB, McCormick W, Bowen JD, Teri L, et al. Effect of vascular lesions on cognition in Alzheimer’s disease: a community-based study. J Am Geriatr Soc. 2004;52:1442–1448. doi: 10.1111/j.1532-5415.2004.52405.x. [DOI] [PMC free article] [PubMed] [Google Scholar]
- 7.Hirono N, Kitagaki H, Kazui H, Hashimoto M, Mori E. Impact of white matter changes on clinical manifestation of Alzheimer’s disease: A quantitative study. Stroke. 2000;31:2182–2188. doi: 10.1161/01.str.31.9.2182. [DOI] [PubMed] [Google Scholar]
- 8.Cheong JL, Thompson DK, Wang HX, Hunt RW, Anderson PJ, et al. Abnormal white matter signal on MR imaging is related to abnormal tissue microstructure. AJNR Am J Neuroradiol. 2009;30:623–628. doi: 10.3174/ajnr.A1399. [DOI] [PMC free article] [PubMed] [Google Scholar]
- 9.Huang J, Friedland RP, Auchus AP. Diffusion tensor imaging of normal-appearing white matter in mild cognitive impairment and early Alzheimer disease: preliminary evidence of axonal degeneration in the temporal lobe. AJNR Am J Neuroradiol. 2007;28:1943–1948. doi: 10.3174/ajnr.A0700. [DOI] [PMC free article] [PubMed] [Google Scholar]
- 10.Zhang Y, Schuff N, Du AT, Rosen HJ, Kramer JH, et al. White matter damage in frontotemporal dementia and Alzheimer’s disease measured by diffusion MRI. Brain. 2009;132:2579–2592. doi: 10.1093/brain/awp071. [DOI] [PMC free article] [PubMed] [Google Scholar]
- 11.Rose SE, Janke AL, Chalk JB. Gray and white matter changes in Alzheimer’s disease: a diffusion tensor imaging study. J Magn Reson Imaging. 2008;27:20–26. doi: 10.1002/jmri.21231. [DOI] [PubMed] [Google Scholar]
- 12.Xie S, Xiao JX, Gong GL, Zang YF, Wang YH, et al. Voxel-based detection of white matter abnormalities in mild Alzheimer disease. Neurology. 2006;66:1845–1849. doi: 10.1212/01.wnl.0000219625.77625.aa. [DOI] [PubMed] [Google Scholar]
- 13.Klingberg T, Vaidya CJ, Gabrieli JD, Moseley ME, Hedehus M. Myelination and organization of the frontal white matter in children: a diffusion tensor MRI study. Neuroreport. 1999;10:2817–2821. doi: 10.1097/00001756-199909090-00022. [DOI] [PubMed] [Google Scholar]
- 14.Song SK, Sun SW, Ramsbottom MJ, Chang C, Russell J, et al. Dysmyelination revealed through MRI as increased radial (but unchanged axial) diffusion of water. Neuroimage. 2002;17:1429–1436. doi: 10.1006/nimg.2002.1267. [DOI] [PubMed] [Google Scholar]
- 15.Budde MD, Xie M, Cross AH, Song SK. Axial diffusivity is the primary correlate of axonal injury in the experimental autoimmune encephalomyelitis spinal cord: a quantitative pixelwise analysis. J Neurosci. 2009;29:2805–2813. doi: 10.1523/JNEUROSCI.4605-08.2009. [DOI] [PMC free article] [PubMed] [Google Scholar]
- 16.Wheeler-Kingshott CA, Cercignani M. About “axial” and “radial” diffusivities. Magn Reson Med. 2009;61:1255–1260. doi: 10.1002/mrm.21965. [DOI] [PubMed] [Google Scholar]
- 17.Gouw AA, Seewann A, Vrenken H, van der Flier WM, Rozemuller JM, et al. Heterogeneity of white matter hyperintensities in Alzheimer’s disease: post-mortem quantitative MRI and neuropathology. Brain. 2008;131:3286–3298. doi: 10.1093/brain/awn265. [DOI] [PubMed] [Google Scholar]
- 18.Mckhann G, Drachman D, Folstein M, Katzman R, Price D, et al. Clinical-Diagnosis of Alzheimers-Disease - Report of the Nincds-Adrda Work Group under the Auspices of Department-of-Health-and-Human-Services Task-Force on Alzheimers-Disease. Neurology. 1984;34:939–944. doi: 10.1212/wnl.34.7.939. [DOI] [PubMed] [Google Scholar]
- 19.Scheltens P, Barkhof F, Leys D, Pruvo JP, Nauta JJ, et al. A semiquantative rating scale for the assessment of signal hyperintensities on magnetic resonance imaging. J Neurol Sci. 1993;114:7–12. doi: 10.1016/0022-510x(93)90041-v. [DOI] [PubMed] [Google Scholar]
- 20.Wahlund LO, Barkhof F, Fazekas F, Bronge L, Augustin M, et al. A new rating scale for age-related white matter changes applicable to MRI and CT. Stroke. 2001;32:1318–1322. doi: 10.1161/01.str.32.6.1318. [DOI] [PubMed] [Google Scholar]
- 21.Smith SM, Jenkinson M, Johansen-Berg H, Rueckert D, Nichols TE, et al. Tract-based spatial statistics: voxelwise analysis of multi-subject diffusion data. Neuroimage. 2006;31:1487–1505. doi: 10.1016/j.neuroimage.2006.02.024. [DOI] [PubMed] [Google Scholar]
- 22.Capizzano AA, Acion L, Bekinschtein T, Furman M, Gomila H, et al. White matter hyperintensities are significantly associated with cortical atrophy in Alzheimer’s disease. J Neurol Neurosurg Psychiatry. 2004;75:822–827. doi: 10.1136/jnnp.2003.019273. [DOI] [PMC free article] [PubMed] [Google Scholar]
- 23.Lee PH, Oh SH, Bang OY, Joo IS, Huh K. Pathogenesis of deep white matter medullary infarcts: a diffusion weighted magnetic resonance imaging study. J Neurol Neurosurg Psychiatry. 2005;76:1659–1663. doi: 10.1136/jnnp.2005.066860. [DOI] [PMC free article] [PubMed] [Google Scholar]
- 24.Chen SQ, Kang Z, Hu XQ, Hu B, Zou Y. Diffusion tensor imaging of the brain in patients with Alzheimer’s disease and cerebrovascular lesions. J Zhejiang Univ Sci B. 2007;8:242–247. doi: 10.1631/jzus.2007.B0242. [DOI] [PMC free article] [PubMed] [Google Scholar]
- 25.DeCarli C, Grady CL, Clark CM, Katz DA, Brady DR, et al. Comparison of positron emission tomography, cognition, and brain volume in Alzheimer’s disease with and without severe abnormalities of white matter. J Neurol Neurosurg Psychiatry. 1996;60:158–167. doi: 10.1136/jnnp.60.2.158. [DOI] [PMC free article] [PubMed] [Google Scholar]
- 26.O’Brien JT, Wiseman R, Burton EJ, Barber B, Wesnes K, et al. Cognitive associations of subcortical white matter lesions in older people. Ann N Y Acad Sci. 2002;977:436–444. doi: 10.1111/j.1749-6632.2002.tb04849.x. [DOI] [PubMed] [Google Scholar]
- 27.Schmidt R, Ropele S, Enzinger C, Petrovic K, Smith S, et al. White matter lesion progression, brain atrophy, and cognitive decline: the Austrian stroke prevention study. Ann Neurol. 2005;58:610–616. doi: 10.1002/ana.20630. [DOI] [PubMed] [Google Scholar]
- 28.Damoiseaux JS, Smith SM, Witter MP, Sanz-Arigita EJ, Barkhof F, et al. White matter tract integrity in aging and Alzheimer’s disease. Hum Brain Mapp. 2009;30:1051–1059. doi: 10.1002/hbm.20563. [DOI] [PMC free article] [PubMed] [Google Scholar]
- 29.Zarei M, Damoiseaux JS, Morgese C, Beckmann CF, Smith SM, et al. Regional white matter integrity differentiates between vascular dementia and Alzheimer disease. Stroke. 2009;40:773–779. doi: 10.1161/STROKEAHA.108.530832. [DOI] [PubMed] [Google Scholar]
- 30.Lee JH, Olichney JM, Hansen LA, Hofstetter CR, Thal LJ. Small concomitant vascular lesions do not influence rates of cognitive decline in patients with Alzheimer disease. Arch Neurol. 2000;57:1474–1479. doi: 10.1001/archneur.57.10.1474. [DOI] [PubMed] [Google Scholar]
- 31.Wang L, Goldstein FC, Veledar E, Levey AI, Lah JJ, et al. Alterations in cortical thickness and white matter integrity in mild cognitive impairment measured by whole-brain cortical thickness mapping and diffusion tensor imaging. AJNR Am J Neuroradiol. 2009;30:893–899. doi: 10.3174/ajnr.A1484. [DOI] [PMC free article] [PubMed] [Google Scholar]
- 32.Seo SW, Im K, Lee JM, Kim YH, Kim ST, et al. Cortical thickness in single- versus multiple-domain amnestic mild cognitive impairment. Neuroimage. 2007;36:289–297. doi: 10.1016/j.neuroimage.2007.02.042. [DOI] [PubMed] [Google Scholar]