

Summary
Humans and other species continually perform microscopic eye movements, even when attending to a single point [1-3]. These movements, which include microscopic drifts and microsaccades, are under control of the oculomotor system [2, 4, 5], elicit strong responses throughout the visual system [6-11], and have been thought to serve important functions [12-16]. The influence of these fixational eye movements on the acquisition and neural processing of visual information remains unknown. Here, we show that during viewing of natural scenes, microscopic eye movements carry out a crucial information-processing step: they remove predictable correlations in natural scenes by equalizing the spatial power of the retinal image within the frequency range of ganglion cells' peak sensitivity. This transformation, which had been attributed to center-surround receptive field organization [17-19], occurs prior to any neural processing, and reveals a form of matching between the statistics of natural images and those of normal eye movements. We further show that the combined effect of microscopic eye movements and retinal receptive field organization is to convert spatial luminance discontinuities into synchronous firing events, thus beginning the process of edge extraction. In sum, our results show that microscopic eye movements are fundamental to two goals of early visual processing —redundancy reduction [20, 21] and feature extraction— and, thus, that neural representations are intrinsically sensory-motor from the very first processing stages.
Results and Discussion
To determine the influence of fixational eye movements, we examined the visual input to the retina during periods of visual fixation. The eye movements of human observers were recorded during free-viewing of pictures of natural scenes, a condition in which saccades occurred frequently (average intersaccadic duration: 248 ±54 ms) and possessed highly variable amplitude (Fig. 1C). As expected from previous studies [22], microsaccades were rare in this condition and their frequency varied substantially across subjects, ranging from approximately one microsaccade every 2 s to one every 20 s (average rate: 0.17 ± 0.15 microsaccades/s). Nevertheless, the eye was continually in motion, as it drifted with apparently random trajectories in between saccades (Fig. 1D and E). Across all subjects, the probability distribution of the center of gaze during the intersaccadic periods covered an area of 363 ± 151 arcmin2. Thus, the projection of the scene moved significantly on the retina during fixation.
Figure 1.
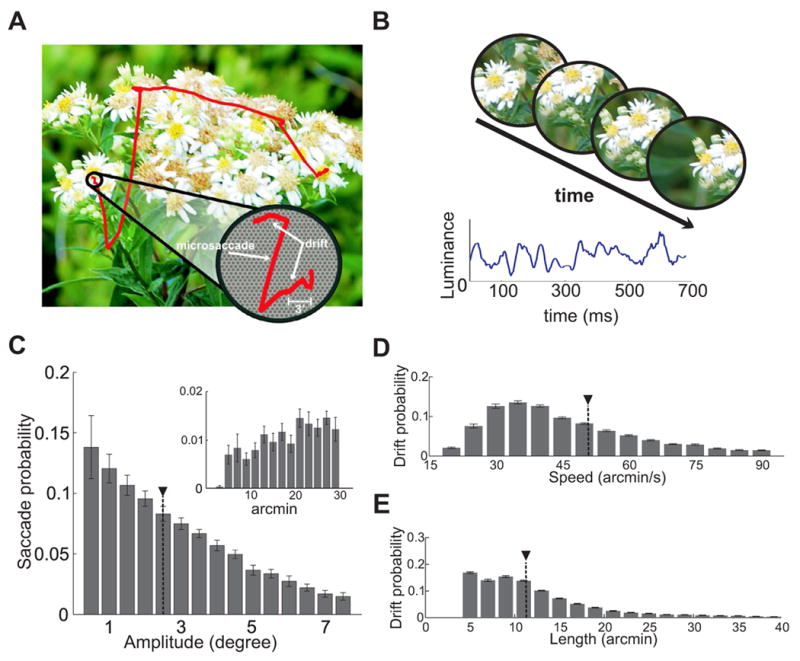
Microscopic eye movements modulate visual input signals during normal fixation. (A) An example of recorded eye movements superimposed on the observed image. The enlarged region shows the eye movements occurring during a period of fixation in relation to the size of photoreceptors. (B) The resulting spatiotemporal stimulus impinging on a region of the retina (top) and on a single photoreceptor (bottom). Note the luminance fluctuations in the input signal. (C–E) Characteristics of eye movements during free-viewing of natural scenes. Average distributions of saccade amplitudes (C), ocular drift speeds (D), and lengths (E) over N = 14 observers. The insert in C shows the range of microsaccades. Data in E represent the arc lengths of the trajectories followed by the eye during the intersaccadic periods. Black triangles indicate means. Errorbars represent standard deviations.
To examine the impact of fixational instability on visual input signals, we reconstructed the spatiotemporal stimulus on the retina, i.e., the visual input resulting from scanning the image according to the subject's eye movements. We then quantified the characteristics of this signal via spectral analysis (Fig. 2).
Figure 2.

Fixational modulations of luminance equalize spatial power. (A) Spatiotemporal frequency content of the retinal stimulus during intersaccadic fixation. (B–C) Sections at several temporal and spatial frequencies. At nonzero temporal frequencies, the power of the retinal stimulus was constant over a wide range of spatial frequencies. Theoretical predictions from a Brownian motion model of eye movement (BM) are also shown. (D) Comparison between the power spectrum of the images observed by subjects (black line) and the power available in the form of temporal modulations in the retinal stimulus (the sum over all nonzero temporal frequencies) during drift (red) and during periods of fixation which included both drifts and microsaccades (blue). The dotted line represents the prediction of the Brownian motion model. Shaded areas in B–D represent one standard deviation.
Fig. 2A shows the results obtained during the intersaccadic periods of ocular drift. With spatial frequency held constant, power declined as a function of temporal frequency (Fig. 2B). However, with temporal frequency held constant at a nonzero value, power was equalized over a wide range of spatial frequencies (Fig. 2C). This was strikingly different from the spatial characteristics of the images displayed on the monitor: as is typical for pictures of natural scenes [23], the spectral density of the images in our database declined steeply with spatial frequency (k-1.9; k denotes spatial frequency). In sum, the effect of fixational eye movements was to redistribute the spatial power of the scene across temporal frequencies so that the power available in the form of temporal modulations (the sum of all power at resolvable temporal frequencies) was constant up to approximately 10 cycles/deg (Fig. 2D).
These results were robust with respect to the method used for spectral analysis. Fig. 2C shows that equalization of spatial power also occurred when eye movements were modeled by the best-fitting Brownian motion process, a case in which the influence of eye movements can be expressed in closed form (see Supplemental Experimental Procedures (SEP)). Furthermore, very similar results were obtained during periods of fixation which also included microsaccades in addition to ocular drift (Fig. 2D). While the fixations recorded in these experiments were on average too short to allow spectral estimation below 4 Hz, power equalization could be assessed down to 1 Hz when observers were instructed to maintain prolonged fixation on a single point in the image. In all cases, fixational eye movements attenuated the low spatial frequencies, which predominate in natural images, yielding a retinal stimulus with “whitened” spatial distributions in the temporal domain. This transformation is significant for neural coding, as it occurs within the range of peak spatiotemporal sensitivity of neurons in the retina and lateral geniculate nucleus [24-26] (i.e., 0.1-10 cycles/deg and above 2 Hz).
To determine the factors responsible for the spatial whitening, we investigated the dependence of input signals on the probability distribution of eye movement. Under the assumption that fixational eye movements are independent of the observed image I, the spectrum of the retinal stimulus is given by:
| (1) |
where I(k) represents the spectral density of the image, and Q(k, ω) is the Fourier transform of the probability, q(x,t), that the eye moves by x in an interval t (SEP). This equation provided excellent approximation of the input power spectrum estimated in the experiments (Fig. 2D). It shows that the spectral distribution of the retinal stimulus depends both on the image and the way the eye moves.
The probability density function of ocular drift and its frequency distribution are reported in Figs. 3A and B, respectively. For a wide range of nonzero temporal frequencies, Q(k,ω) increased proportionally to the square of the spatial frequency. This dependence counterbalanced the spectral distribution of natural scenes (I(k) in Eq. 1), yielding a retinal stimulus whose power did not depend on spatial frequency. Thus, whitening of the retinal stimulus originated from the interaction between the statistics of natural images and the spatiotemporal structure of fixational eye movements.
Figure 3.
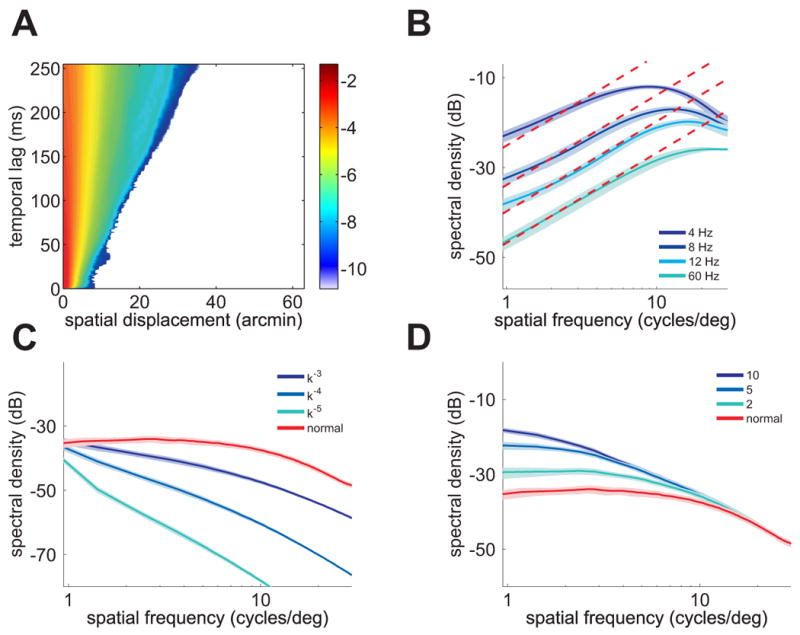
Whitening of the retinal stimulus depends on the characteristics of natural images and fixational eye movements. (A) Probability distribution q(x,t) of eye movement during intersaccadic fixation. The color of a pixel at coordinates (x,t) represents the probability (in log scale) that the eye moved by x in an interval t. (B) Frequency content of q(x,t). For a wide frequency range, energy increased proportionally to the square of spatial frequency (dashed lines), a dependence that counterbalanced the power spectrum of natural images. (C–D) Whitening was lost with presentation of images which lacked scale-invariance and was greatly attenuated when eye movements were artificially enlarged. In (C), natural images were filtered to yield various spectral densities: the red curve is the unfiltered case, and corresponds to the scale-invariant spectrum. In (D), eye movements were scaled by different factors: the red curve, a scale factor of 1, corresponds to normal eye movements. Each curve represents the sum over all nonzero temporal frequencies. Shaded areas represent one standard deviation.
Eq. 1 predicts that whitening of the retinal stimulus by normal fixational instability will only occur during viewing of images with approximately scale-invariant spectral density (I(k) ∝ k−2), like natural images. Fig. 3C tests this prediction. It shows the input temporal power measured when the same eye movement traces scanned images whose power spectra declined according to other power-law functions (I(k) ∝ k−α, for α = 3,4,5). No power equalization occurred with these images. Whitening was also greatly attenuated when images of natural scenes were scanned by abnormally large eye movements (Fig. 3D). This happened because normal eye movements only counterbalanced the spectral density of natural scenes up to approximately 10 cycles/deg (Fig. 3B). Artificial amplification of eye movements shifted this whitening range to lower spatial frequencies, away from the region in which ganglion cells have their greatest sensitivity. Thus, fixational eye movements match the characteristics of natural scenes to the sensitivity of retinal neurons.
The data in Figs. 2 and 3 show that fixational eye movements carry out a specific conversion of spatial patterns into temporal modulations. What are the implications of this reformatting of the retinal input for the neural encoding of visual information?
To gain some intuition, it is convenient to decompose the stimulus on the retina into a sum of two separate signals (Fig. 4A): a static image, in which the intensity of each pixel represents the average luminance experienced by a retinal receptor over the fixation period; and a dynamic signal containing the changes in luminance caused by eye movements. These two signals have very different correlation properties. The static signal corresponds to the power in the retinal stimulus at zero temporal frequency. Most of this power is at low spatial frequencies: correspondingly, pairs of pixel have extensive luminance correlations. In contrast, the dynamic signal corresponds to the power which eye movements shifted to nonzero temporal frequencies and equalized over a broad range of spatial frequencies. Since equalization of spectral power is equivalent to elimination of second-order correlations, this signal no longer contains the long-range correlations attributable to the average second-order statistics of natural images. The surviving correlations are specific to the scene being observed and emphasize the luminance discontinuities that occur at edges and object boundaries.
Figure 4.
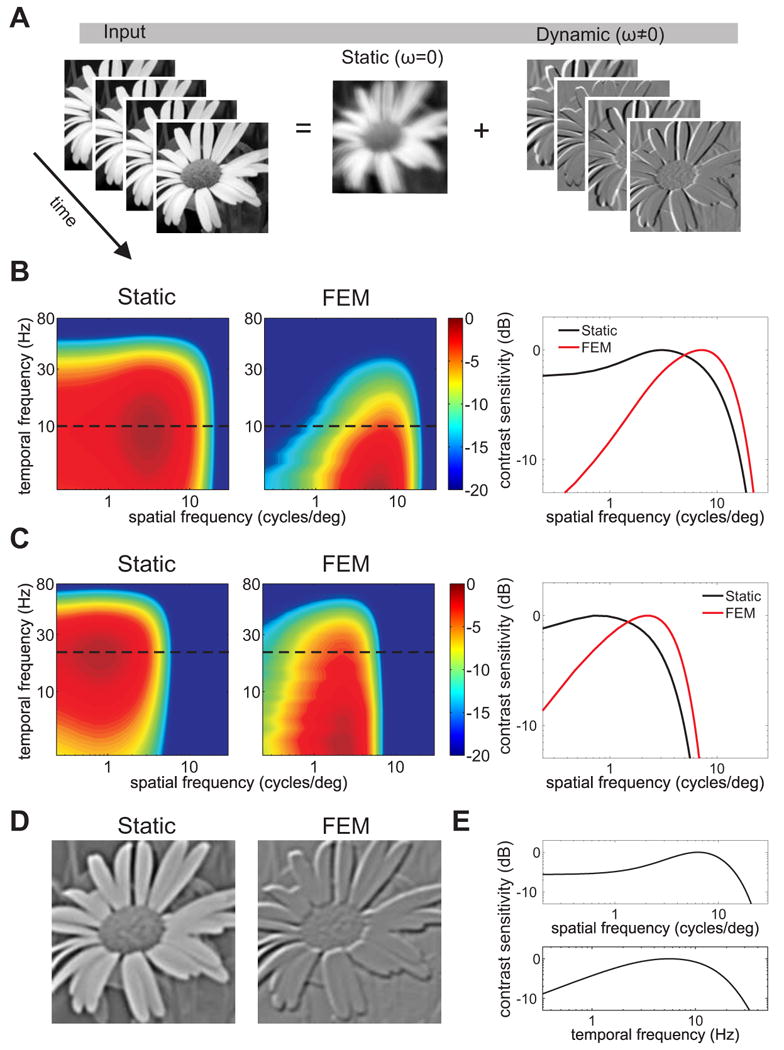
Implications of spatial whitening for neural encoding. (A) The retinal stimulus during fixation can be decomposed into a blurred image (the power at temporal DC) and the spatially decorrelated modulations caused by eye movements (see Movie S1). (B–C) Influences of eye movements on the response characteristics of parvocellular (B) and magnocellular (C) retinal ganglion cells. Contrast sensitivity functions measured with immobile retinas [24, 31, 32] (Static) are compared to equivalent functions which incorporate the effect of the redistribution of input power caused by eye movements (FEM). The two panels on the right show spatial sections at the original peak temporal frequencies (dashed lines). (D) Snapshots of activity in an array of computer-simulated transient neurons during a recorded trace of fixational eye movements (FEM) and when the same scene was displayed without retinal image motion (Static). The intensity of each pixel represents the mean instantaneous firing rate of a neuron with receptive field centered at the pixel coordinates. Notice the enhancement of important edges in the scene during fixational instability. See Movie S2 for full simulations of neural activity. (E) Neurons were modeled as linear filters replicating the spatial and temporal contrast sensitivity of a ON-center parvocellular cell recorded in the macaque's lateral geniculate nucleus [26].
Both parvocellular and magnocellular retinal ganglion cells possess peak sensitivity at nonzero temporal frequencies and will, therefore, be strongly influenced by the dynamic component of the visual input. Neurons with transient responses —which are not sensitive to zero temporal frequency— will effectively see a spatially whitened input. Their responses will, therefore, be less influenced by low spatial frequencies and enhance high spatial frequencies significantly more than expected from their contrast sensitivity functions measured in neurophysiological recordings with immobile retinas (Fig. 4B-C; see SEP). More sustained neurons will be driven by both the static and dynamic signals. Their tonic responses will depend on the local mean luminance conveyed by the static signal. Superimposed on this, phasic modulations in their responses driven by the dynamic, spatially-whitened component of the visual input will emphasize high spatial frequencies. These synchronous modulations are likely to elicit strong responses in cortical neurons [27, 28]. Interestingly, in physiological recordings, these modulations would be mistaken for correlations arising from neural noise, unless careful experimental measurement of microscopic eye movements was undertaken [10]. They are instead generated by the jittering retinal stimulus itself.
These surprising effects were demonstrated by computer simulations of populations of transient parvocellular neurons. Whereas a static (no eye movements) flash of a natural image led to spatially extensive pools of coactive neurons, neural responses during viewing of the same image with normal fixational eye movements emphasized object contours (see Movie S2). This pattern of activity occurred even though the receptive fields of model neurons were circularly symmetric and did not possess a preference for oriented stimuli. Thus, fixational eye movements facilitated the extraction of important features in the scene.
The observed whitening of the retinal input may provide an explanation for the lack of perceived blurring during fixational instability [29]. With normal eye movements, a predominance of low spatial frequency power only occurs at zero temporal frequency (the static component of the visual input in Fig. 4A), a range in which retinal ganglion cells are only marginally responsive. At nonzero temporal frequencies, fixational eye movements enhance high spatial frequency power, an effect which also supports a contribution of fixational eye movements to the perception of fine spatial detail [12, 15] and explains the perceptual impairments reported in the absence of retinal image motion [16]. Furthermore, these results radically alter standard views about the goals of early neural processing in the visual system. While center-surround interactions [17-19] and nonlinearities [30] in retinal neurons might contribute to spatial decorrelation in ganglion cells with sustained responses, transient neurons are driven by signals that are already spatially whitened. Thus, the band-pass spatial sensitivity of transient neurons actually introduces correlations in their responses, which further emphasize edges in the image.
In sum, our findings show that the incessant fixational motion of the eye reshapes the spatiotemporal stimulus on the retina into a format that facilitates subsequent neuronal processing. This transformation takes advantage of the temporal tuning of visual neurons by (a) spreading the energy of the image into the temporal domain, and (b) equalizing the resulting spatial distribution within the range of peak neuronal sensitivity. Much more than just a means for refreshing neural activity, fixational eye movements are a crucial mechanism for encoding a spatial sensory domain in time before any neuronal processing occurs.
Experimental Procedures
Fourteen naive subjects with normal vision participated in the experiments. Subjects were instructed to memorize 60 gray-scale pictures of natural scenes. Images were displayed sequentially, each for 10 s, on a Iyama HM204DT CRT monitor at 1024×768 pixel resolution and 100 Hz refresh rate. Each pixel subtended 1′, an angle similar to that covered when the image was originally acquired. Stimuli were observed monocularly, with the left eye patched, in a dimly illuminated room.
Eye movements were recorded by means of a Dual Purkinje Image eyetracker (Fourward Technology) and sampled at 1 Khz. A head rest and a custom dental-imprint bite bar prevented head movements. Recorded traces were segmented into periods of fixation and saccades based on eye velocity. Movements with speeds larger than 3°/s and amplitudes exceeding 3′ were classified as saccades or microsaccades depending on whether their amplitudes were larger or smaller than 30′. Saccade amplitude was defined as the length of the vector connecting the two locations at which velocity became greater (onset) and lower (offset) than 2°/s.
For each period of fixation, we created a movie of the retinal stimulus by translating the image following the recorded eye trajectory, so that each frame was centered at the current gaze location. Power spectra of these movies were evaluated by means of Welch algorithm with 50% block overlap (window lengths: 512 ms and 256′). Spectra were estimated separately for each subject and then averaged. 3D power spectra were also rotationally averaged across all directions in each spatial frequency plane (kx,ky) to yield 2D maps of spatial and temporal frequency. Data in Fig. 2 were obtained by selecting fixations longer than 512 ms. Results were virtually identical (other than a lower temporal resolution) when fixations longer than 128 ms were selected for analysis.
Supplementary Material
Highlights.
In natural viewing, microscopic eye movements decorrelate (i.e., whiten) the visual stimulus.
Whitening is due to a match between natural scene characteristics and fixational eye movements.
Elimination of input redundancy starts before any neural processing takes place.
In a continually moving eye, the process of edge extraction starts in the retina.
Acknowledgments
This work was supported by National Institutes of Health grants EY07977 and EY09314 to J.D.V., National Institutes of Health grant EY18363 and National Science Foundation grants BCS-0719849, BCS-1127216, and IOS-0843304 to M.R.. The authors thank Antonino Casile and Eric Schwartz for helpful comments and declare no conflicts of interests.
Footnotes
Publisher's Disclaimer: This is a PDF file of an unedited manuscript that has been accepted for publication. As a service to our customers we are providing this early version of the manuscript. The manuscript will undergo copyediting, typesetting, and review of the resulting proof before it is published in its final citable form. Please note that during the production process errors may be discovered which could affect the content, and all legal disclaimers that apply to the journal pertain.
References
- 1.Ratliff F, Riggs LA. Involuntary motions of the eye during monocular fixation. J Exp Psychol. 1950;40:687–701. doi: 10.1037/h0057754. [DOI] [PubMed] [Google Scholar]
- 2.Steinman RM, Haddad GM, Skavenski AA, Wyman D. Miniature eye movement. Science. 1973;181:810–819. doi: 10.1126/science.181.4102.810. [DOI] [PubMed] [Google Scholar]
- 3.Martinez-Conde S, Macknik SL, Hubel DH. The role of fixational eye movements in visual perception. Nat Rev Neurosci. 2004;5:229–240. doi: 10.1038/nrn1348. [DOI] [PubMed] [Google Scholar]
- 4.Hafed Z, Goffart L, Krauzlis R. A neural mechanism for microsaccade generation in the primate superior colliculus. Science. 2009;323:940–943. doi: 10.1126/science.1166112. [DOI] [PMC free article] [PubMed] [Google Scholar]
- 5.Ko HK, Poletti M, Rucci M. Microsaccades precisely relocate gaze in a high visual acuity task. Nat Neurosci. 2010;13:1549–1553. doi: 10.1038/nn.2663. [DOI] [PMC free article] [PubMed] [Google Scholar]
- 6.Leopold DA, Logothetis NK. Microsaccades differentially modulate neural activity in the striate and extrastriate visual cortex. Exp Brain Res. 1998;123:341–345. doi: 10.1007/s002210050577. [DOI] [PubMed] [Google Scholar]
- 7.Martinez-Conde S, Macknik SL, Hubel DH. Microsaccadic eye movements and firing of single cells in the striate cortex of macaque monkeys. Nat Neurosci. 2000;3:251–258. doi: 10.1038/72961. [DOI] [PubMed] [Google Scholar]
- 8.Snodderly DM, Kagan I, Gur M. Selective activation of visual cortex neurons by fixational eye movements: Implications for neural coding. Visual Neurosci. 2001;18:259–277. doi: 10.1017/s0952523801182118. [DOI] [PubMed] [Google Scholar]
- 9.Greschner M, Bongard M, Rujan P, Ammermüller J. Retinal ganglion cell synchronization by fixational eye movements improves feature estimation. Nat Neurosci. 2002;5:341–447. doi: 10.1038/nn821. [DOI] [PubMed] [Google Scholar]
- 10.Kagan I, Gur M, Snodderly DM. Saccades and drifts differentially modulate neuronal activity in V1: Effects of retinal image motion, position, and extraretinal influences. J Vis. 2008;8:1–5. doi: 10.1167/8.14.19. [DOI] [PubMed] [Google Scholar]
- 11.Herrington TM, Masse NY, Hachmeh KJ, Smith JET, Assad JA, Cook EP. The effect of microsaccades on the correlation between neural activity and behavior in middle temporal, ventral intraparietal, and lateral intraparietal areas. J Neurosci. 2009;29:5793–5805. doi: 10.1523/JNEUROSCI.4412-08.2009. [DOI] [PMC free article] [PubMed] [Google Scholar]
- 12.Marshall WH, Talbot SA. Recent evidence for neural mechanisms in vision leading to a general theory of sensory acuity. In: Kluver H, editor. Biological Symposia—Visual Mechanisms. Lancaster, PA: 1942. pp. 117–164. [Google Scholar]
- 13.Ditchburn RW, Ginsborg BL. Vision with a stabilized retinal image. Nature. 1952;170:36–37. doi: 10.1038/170036a0. [DOI] [PubMed] [Google Scholar]
- 14.Riggs LA, Ratliff F, Cornsweet JC, Cornsweet TN. The disappearance of steadily fixated visual test objects. J Opt Soc Am. 1953;43:495–501. doi: 10.1364/josa.43.000495. [DOI] [PubMed] [Google Scholar]
- 15.Ahissar E, Arieli A. Figuring space by time. Neuron. 2001;32:185–201. doi: 10.1016/s0896-6273(01)00466-4. [DOI] [PubMed] [Google Scholar]
- 16.Rucci M, Iovin R, Poletti M, Santini F. Miniature eye movements enhance fine spatial detail. Nature. 2007;447:852–855. doi: 10.1038/nature05866. [DOI] [PubMed] [Google Scholar]
- 17.Srinivasan MV, Laughlin SB, Dubs A. Predictive coding: A fresh view of inhibition in the retina. P Roy Soc Lond B Bio. 1982;216:427–459. doi: 10.1098/rspb.1982.0085. [DOI] [PubMed] [Google Scholar]
- 18.Atick J, Redlich A. What does the retina know about natural scenes? Neural Comput. 1992;4:196–210. [Google Scholar]
- 19.van Hateren JH. A theory of maximizing sensory information. Biol Cybern. 1992;68:23–29. doi: 10.1007/BF00203134. [DOI] [PubMed] [Google Scholar]
- 20.Attneave F. Some informational aspects of visual perception. Psychol Rev. 1954;61:183–193. doi: 10.1037/h0054663. [DOI] [PubMed] [Google Scholar]
- 21.Barlow HB. Possible principles underlying the transformations of sensory messages. In: Rosenblith WA, editor. Sensory Communication. Cambridge, MA: MIT Press; 1961. pp. 217–234. [Google Scholar]
- 22.Collewijn H, Kowler E. The significance of microsaccades for vision and oculomotor control. J Vis. 2008;8:1–21. doi: 10.1167/8.14.20. [DOI] [PMC free article] [PubMed] [Google Scholar]
- 23.Field DJ. Relations between the statistics of natural images and the response properties of cortical cells. J Opt Soc Am A. 1987;4:2379–2394. doi: 10.1364/josaa.4.002379. [DOI] [PubMed] [Google Scholar]
- 24.Croner L, Kaplan E. Receptive fields of P and M ganglion cells across the primate retina. Vision Res. 1995;35:7–24. doi: 10.1016/0042-6989(94)e0066-t. [DOI] [PubMed] [Google Scholar]
- 25.Kaplan E, Benardete E. The dynamics of primate retinal ganglion cells. Prog Brain Res. 2001;134:17–34. doi: 10.1016/s0079-6123(01)34003-7. [DOI] [PubMed] [Google Scholar]
- 26.Derrington AM, Lennie P. Spatial and temporal contrast sensitivities of neurons in lateral geniculate nucleus of macaque. J Physiol. 1984;357:219–240. doi: 10.1113/jphysiol.1984.sp015498. [DOI] [PMC free article] [PubMed] [Google Scholar]
- 27.Dan Y, Alonso JM, Usrey WM, Reid RC. Coding of visual information by precisely correlated spikes in the lateral geniculate nucleus. Nat Neurosci. 1998;6:501–507. doi: 10.1038/2217. [DOI] [PubMed] [Google Scholar]
- 28.Bruno RM, Sakmann B. Cortex is driven by weak but synchronously active thalamocortical synapses. Science. 2006;312:1622–1627. doi: 10.1126/science.1124593. [DOI] [PubMed] [Google Scholar]
- 29.Packer O, Williams DR. Blurring by fixational eye movements. Vision Res. 1992;32:1931–1939. doi: 10.1016/0042-6989(92)90052-k. [DOI] [PubMed] [Google Scholar]
- 30.Pitkow X, Meister M. Decorrelation and efficient coding by retinal ganglion cells. Nat Neurosci. 2011 doi: 10.1038/nn.3064. in press. [DOI] [PMC free article] [PubMed] [Google Scholar]
- 31.Benardete EA, Kaplan E. The receptive field of the primate P retinal ganglion cell, I: Linear dynamics. Visual Neurosci. 1997;14:169–185. doi: 10.1017/s0952523800008853. [DOI] [PubMed] [Google Scholar]
- 32.Benardete EA, Kaplan E. The dynamics of primate M retinal ganglion cells. Visual Neurosci. 1999;16:355–368. doi: 10.1017/s0952523899162151. [DOI] [PubMed] [Google Scholar]
Associated Data
This section collects any data citations, data availability statements, or supplementary materials included in this article.