

Abstract
A sufficient cardiology workforce is necessary to ensure access to cardiovascular care. Specifically, access to cardiologists is important in the management and treatment of chronic cardiovascular disease. Previous workforce analyses focused narrowly on the total numbers necessary to care for the entire population and not the geographic distribution of the workforce. To examine the supply and distribution of the cardiologist workforce, we mapped the ratios of cardiologists, primary care physicians, and total physicians to the population aged 65 years or older within different Hospital Referral Regions from the years 1995 and 2007. We found within the 12-year span of our study growth in the cardiology workforce was modest compared to the primary care physician and total physician workforces. Also we found a persistent geographic misdistribution of cardiologists associated with socioeconomic population characteristics. Our results suggest that large segments of our population, specifically in rural areas, continue to have decreased access to cardiologists despite a modest growth in the overall workforce. Policy initiatives focused upon increasing the cardiologist workforces in these areas in necessary to provide adequate cardiovascular care.
Keywords: Workforce Issues, Access to Care, Physicians
INTRODUCTION
Concerns about increasing demands from an aging population have led to a debate about the size and makeup of the physician workforce, culminating with recent U.S. health care reform.(1) These concerns are particularly relevant to the field of cardiology, which first noted emerging problems with its workforce as early as 1993.(2)
Attention to issues concerning the cardiology workforce is increasing for several reasons. First, changing population demographics will cause the prevalence of cardiovascular disease to increase even as the age-adjusted incidence declines.(3) Second, the rising obesity epidemic increases the possibility that anticipated reductions in cardiovascular disease incidence could be reversed.(4) Third, the number of cardiologists retiring may be happening faster than anticipated.(5) Fourth, technical advancements in cardiology have made it increasingly difficult for primary care physicians to substitute for cardiologists and deliver a growing array of advanced services and technical cardiovascular procedures.(6, 7)
Despite these concerns, few studies have examined the supply of cardiologists and their geographic distribution across the United States. To investigate these issues, we studied the geographic distribution of the ratio of cardiologists to the population aged 65 years or older among different Hospital Referral Regions in 1995 and 2007. We also examined the factors that were associated with the current distribution of the cardiology workforce within different regions. Finally, we evaluated the evenness of the distribution of cardiologists and how it compares with the distribution of primary care doctors and the total physician workforce.
METHODS
Data Sources
We obtained demographic, population, and physician distribution data for the years 1995 and 2007 from the 2004 and 2008 editions of the Area Resource File.(8) This document, published by the Health Resources and Services Administration of the United States Department of Health and Human Services, aggregates information concerning healthcare professionals, healthcare facilities, and population for each county in the United States, drawing from multiple sources. Specifically, the Area Resource File includes the number of nonfederal specialists within each county, using the American Medical Association’s Physician Masterfile.
Hospital Referral Regions
To account for physicians whose practices are spread over multiple counties, we used the 306 Hospital Referral Regions in the United States.(9) These regions have often been used to examine geographic variations in healthcare because they represent substantial populations and have been formulated upon historical geographic patterns of patient care by large referral hospitals within a region.(10-12) To aggregate the county-level data from the county to the regional referral level, we combined the county-level and regional maps and found the areas of the regions formed by the intersection of county and regional referral boundaries.
Using the areas of the intersections, we created a weight representing the percentage that each hospital referral region contributed to the county. Lastly, for all the county-level variables except median household income, we used the weights to aggregate data to the regional level by calculating the weighted sum. Median household income was aggregated to the regional level by calculating the weighted mean because it provided a more accurate representation within each referral region.
Cardiologist-to-Population (Age 65 or Older) ratio
The physician-to-population ratio is an accepted measure of physician distribution within a geographic region.(13, 14) The primary outcome of this study was the ratio of cardiologists to population aged 65 years or older, also known as the cardiologist ratio. Cardiologists were identified as physicians who are recorded by the American Medical Association as specializing in ”cardiovascular disease” within internal medicine.
The elderly were chosen as the denominator population because they possess a relatively high prevalence of cardiovascular disease and they utilize a significant portion of cardiovascular services.(15) Moreover, recent studies have suggested that population aged 65 or older is a significant driver for future demand of cardiologist services.(5) The cardiologist ratio of each hospital referral region was calculated as the number of cardiologists per 100,000 people aged 65 years or older. cardiologist ratios were generated for the years 1995 and 2007. ratios of doctors to population aged 65 years or older (total physician ratio) and primary care doctors to population aged 65 years or older (primary care ratio) were calculated for comparison with the cardiologist ratio. Although we cannot expect the changes overtime between the three workforces to be equivalent, analysis of the primary care and total physician workforces provides reference groups to better evaluate changes in the cardiologist workforce. Physicians whose specialty was identified as general practice, family practice, or general internal medicine were categorized as primary care physicians.
Population Demographic Variables
We examined the following Hospital Referral Region-level population demographic characteristics in our analyses: race; income; education; and unemployment. Population race was defined as the percentage of the population which was white based on the 2000 Census Geographic Comparison Table; population income was defined as the median household income based on the 2007 Census Small Area Income Poverty Estimates; population education was defined percentage of the population with a high school education, specifically the percentage of the population aged 25 years or older with at least a high school diploma based on the 2000 Census Demographic File; and population unemployment was defined as the percentage unemployed among the civilian workforce aged 16 years or older based on the 2007 Bureau of Labor Statistics.
Statistical Analysis
To compare the distribution of cardiologists between different Hospital Referral Regions and changes in the geographic distribution of cardiologists, quartiles of cardiologist ratios in 1995 and 2007 as well as the difference between 1995 and 2007 cardiologist ratios were separately mapped to corresponding Hospital Referral Regions.
We then calculated the means and inter-quartile ratios for the cardiologist ratio, total physician ratio, and primary care physician ratio in both 1995 and 2007 and examined whether the inter-quartile ratio, which is between the 75th and 25th percentiles, changed over time. This ratio serves as a measure of variation in physician distribution. A narrowing of this ratio between 1995 and 2007 would suggest decreased variation, whereas a widening would suggest increased variation.
To assess the evenness of the cardiologist distribution as well as to compare with total physicians and primary care doctors, Lorenz curves were drawn and Gini coefficients were also calculated for cardiologists, total physicians, and primary care physicians between 1995 and 2007. Traditionally used to assess distribution of wealth, Gini coefficients and Lorenz curves have recently been used to evaluate physician distribution. The Lorenz curves were constructed by graphing the cumulative percentage of cardiologists as ranked by cardiologist ratios versus the cumulative percentage of the population aged 65 years or older; similar procedures were followed for Total Physician ratios and primary care physicians ratios.
To evaluate potential determinants of the geographic distribution of cardiologists in 2007, we employed negative binomial regression analysis, which was considered most appropriate after assessing the cardiologist ratio distribution, mean, and variance. We examined the impact of the population characteristics described previously on 2007 cardiologist ratio in both univariate and multivariate models. Statistical significance was determined at p<.05.
Limitations
There are several limitations to our analysis. First, we are not able to determine the ideal distribution of cardiologists. What is clear, however, is that many regions have far fewer specialists than others. Within many Hospital Referral Regions there seem to be few cardiologists to care for a substantial patient population. Second, the AMA Masterfile does not accurately describe physicians who have practices in multiple geographic locations. However, our analysis was focused on Hospital Referral Regions and we expect few physicians to maintain practices in multiple Hospital Referral Regions. Third, specialty data from the AMA Masterfile is self-reported and not based on verifiable evidence such as board certification in cardiology. Moreover we cannot determine the types of cardiologists in each Hospital Referral Region. However, studies have shown the Masterfile to be quite accurate in describing self-reported physician specialties compared with actual practice patterns.(16) Fourth, our analysis did not capture the impact of medical professionals who are not cardiologists. Physician extenders, such as cardiovascular-specific nurses or other physician specialties, could affect the distribution of the cardiology workforce.(17) Fifth, our study did not account for telemedicine used in underserved areas or other technological extensions used by physicians to provide care in areas with low densities of cardiologists. Sixth our analysis does not account for disease specific factors that could influence where cardiologist decide to practice such as severity of cardiovascular disease within a region. Seventh, our study could not quantify the amount of clinical and research activity undertaken by each cardiologist. Although the number of full time research cardiologists is small and decreasing, our analysis could overestimate the clinical cardiologist workforce in large academic centers.(18) Nevertheless our finding concerning the lack of cardiologists in rural areas remains unaffected by this limitation. Finally, our analysis could not account for other potential factors associated with access to care, specifically how many physicians within each Hospital Referral Region provide care for Medicare patients.
RESULTS
Cardiology Workforce: Prevalence
Over the 12-year period of the study, there was a 28.6 percent increase in the total physician workforce, from 617,344 physicians in 1995 to 794,101 physicians in 2007, and a 26.3 percent increase in the primary care physician workforce, from 156,527 physicians to 197,737 physicians. In contrast, there was only a 19.2% increase in the cardiology workforce, from 18,333 physicians to 21,854 physicians (Exhibit 1). Similarly, there was a 15.0 percent increase in the mean total physician ratio among Hospital Referral Regions, from 1,560 per 100,000 in 1995 to 1,793 per 100,000 in 2007, and a 13.5 percent increase in the mean primary care physician ratio, from 429 per 100,000 to 487 per 100,000. Comparatively, there was only a 10.5 percent increase in the mean cardiologist ratio, from 44 per 100,000 to 48 per 100,000. Our results suggest that although there has been growth in the overall cardiology workforce in the 12-years period, the growth remains modest compared to both the overall physician and the primary care physician workforces.
Exhibit 1.
Changes in Numbers of Physicians per 100,000 For People Age 65 or Older Across Hospital Referal Regions, 1995 and 2007
| Cardiologist Physicians | Primary Care Physicians | Total Physicians | |||||||
|---|---|---|---|---|---|---|---|---|---|
| 1995 | 2007 | % Change | 1995 | 2007 | % Change | 1995 | 2007 | % Change | |
| Total Workforce | 18,333 | 21,854 | 19.2 | 156,527 | 197,737 | 26.3 | 617,344 | 794,101 | 28.6 |
| Mean Ratio per 100,000 | 43.8 | 48.4 | 10.5 | 429.2 | 487.1 | 13.5 | 1,560.0 | 1,793.3 | 15.0 |
| Interquartile Ratio | 2.0 | 1.8 | −8.0 | 1.5 | 1.4 | −3.7 | 1.8 | 1.7 | −2.2 |
Source: 2004 and 2008 Editions of the Area Resource File; authors’ analysis.
Cardiology Workforce: Distribution and Variation
Although there was a 2.2 percent decrease in the total physician ratio interquartile ratio from 1995 to 2007 and a 3.7 percent decrease in the primary care physician ratio interquartile ratio, there was an 8.0 percent decrease in the cardiologist ratio interquartile ratio (Exhibit 1), suggesting that there was a greater decrease in cardiologist ratio variation among Hospital Referral Regions compared with total physician ratio and primary care physician ratio. However, many Hospital Referral Regions were found to have persistently low cardiologist ratios. For example, in 2007 10 percent of Hospital Referral Regions had 25 or fewer cardiovascular specialists per 100,000 people aged 65 or older (Exhibit 2).
Exhibit 2. The Geographic Distributions of the Cardiology Workforce: 1995 and 2007 and change between.
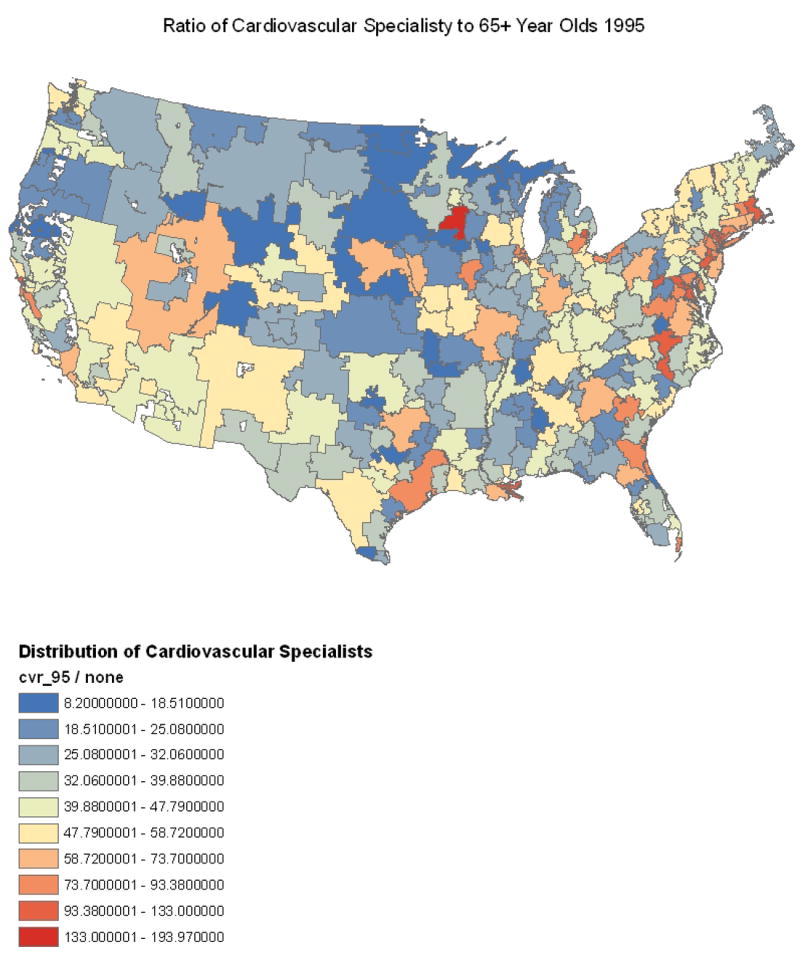
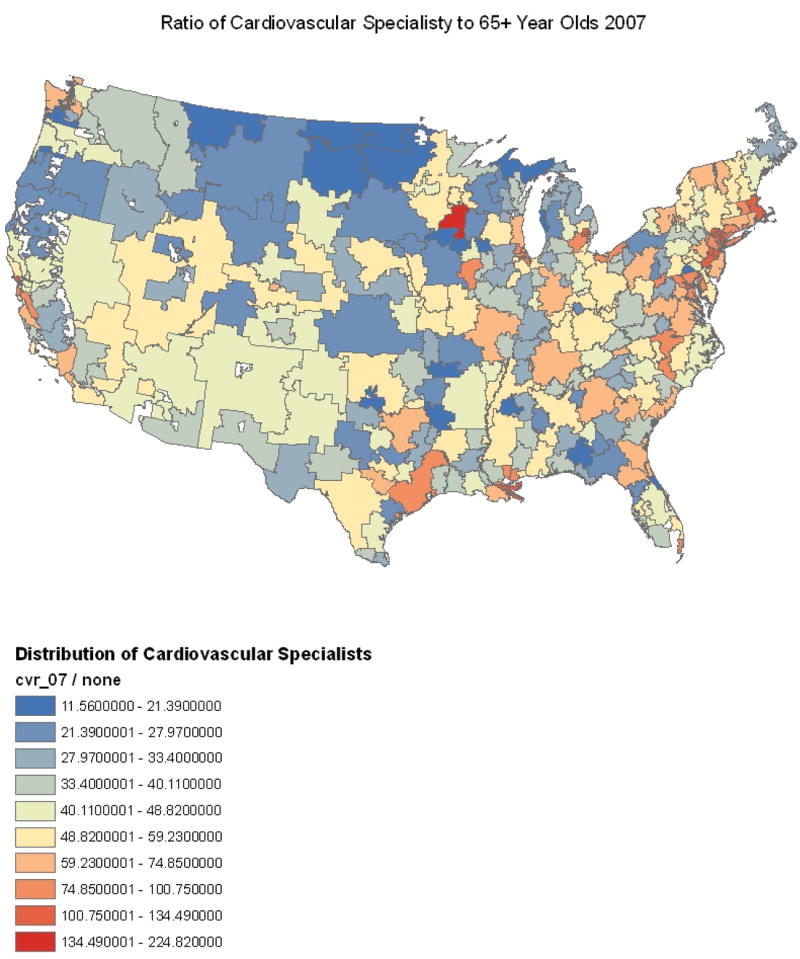
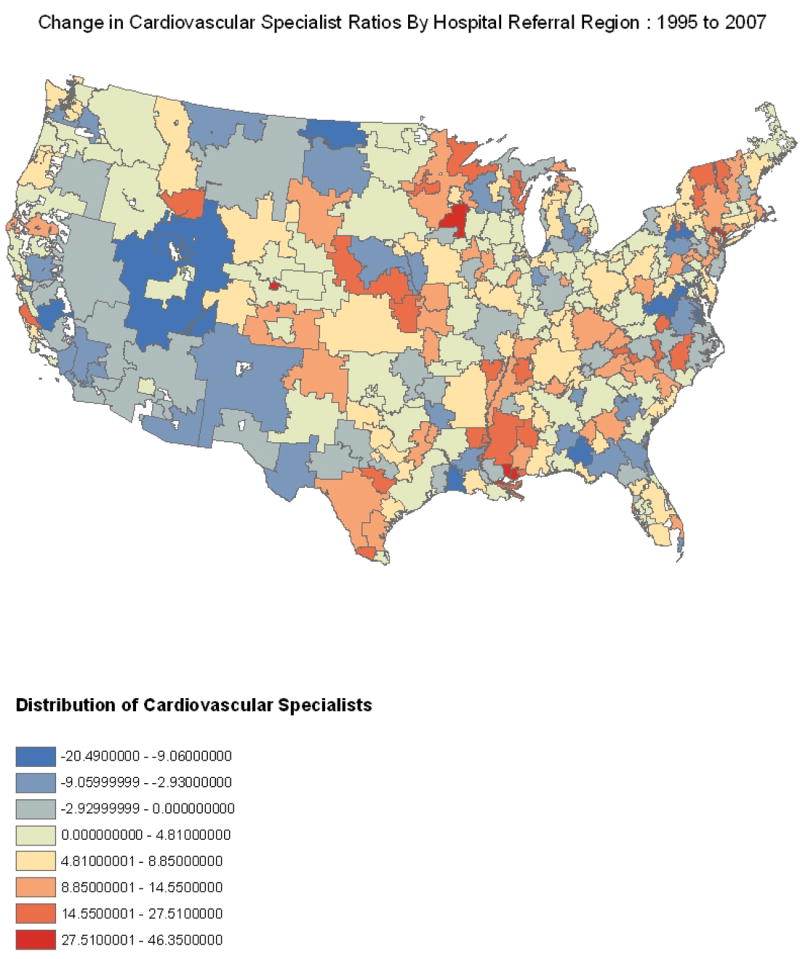
Source: 2004 and 2008 Editions of the Area Resource File; authors’ analysis.
In addition, there was persistent geographic variation of cardiologist ratios between 1995 and 2007. For instance, lower cardiologist ratios were consistently observed in rural areas and in the Midwest whereas relatively higher cardiologist ratios were consistently observed in the Northeast. Of note, four of the five Hospital Referral Regions with the highest cardiologist ratio in 1995 (Rochester, Minnesota; Manhattan, New York; New Orleans, Louisiana; and Hinsdale, Illinois) remained among the five highest Hospital Referral Regions in 2007. Mapping the change in cardiologist ratio during the 12-year period, we found Hospital Referral Regions in the Western part of the country have exhibited generally decreasing cardiologist ratio. In contrast, Hospital Referral Regions in the Northeast, Texas, Minnesota, and Mississippi have shown notable increases in cardiologist ratio since 1995. Although there has been growth in the physician workforce over the 12-year period of our study there remains a clustering of cardiologists leaving large segments of the population underserved. Specifically, rural regions continue to have reduced access to cardiologists while metropolitan regions, notably in the Northeast have an abundance of cardiologists.
Cardiology Workforce: Distribution Evenness
Lorenz curve and Gini coefficient calculations showed an uneven distribution of the cardiology workforce. We found that only 38 percent of the cardiology workforce was distributed among Hospital Referral Regions where 60 percent of the population aged 65 or older resides. When comparing Gini coefficients between other specialties in 1995 and 2007, primary care physicians were the most evenly distributed group, followed by total physician workforce and finally cardiologists (Exhibit 3). Moreover, the Gini coefficients of all three groups exhibited a percentage decrease indicating an improvement in distribution towards evenness. Cardiologists possessed the largest change (−9.39 percent), followed by primary care physicians (−5.55 percent) and finally total physicians (−3.17 percent). Analysis of the Gini coefficients suggests that although cardiologists were far less evenly distributed than primary care physicians and total physicians, they experienced a greater change toward evenness from 1995 to 2007. Our Gini calculations indicate that although modestly improving the cardiologist workforce is not equally distributed among the population aged 65 or older. Furthermore, the inequity of cardiologists is significantly worse than rest of the physician and primary care workforces.
Exhibit 3.
Gini Coefficients Calculated for the Cardiologist Physician Workforce, the Primary Care Physician Workforce, and the Total Physician Workforce, 1995-2007.
| 1995 | 2007 | Change | % Change | |
|---|---|---|---|---|
| Cardiologist Physicians | 0.260 | 0.236 | −0.024 | −9.39 |
| Primary Care Physicians | 0.179 | 0.169 | −0.010 | −5.55 |
| Total Physicians | 0.231 | 0.224 | −0.007 | −3.17 |
Source: 2004 and 2008 Editions of the Area Resource File; authors’ analysis.
Cardiology Workforce: Population Factors Associated with Distribution
Using univariate negative binomial regression analysis, we found that the population unemployment rate (β=−5.89, p=0.01), the population percentage with a high school education (β=1.13, p=.012), median household income per $10,000 (β=0.23, p<.001), and the population percentage of white race (β=−1.18, p<.001) were all statistically significantly associated with the 2007 cardiologist ratio (Exhibit 4). However, using multivariable analysis, the population percentage with a high school education was no longer statistically significantly associated with the cardiologist ratio, whereas population median household income per $10,000 (β=0.22, p<.001), population unemployment rate (β=−4.02, p=.04), and population percentage of white race (β=−0.72, p<.001) all remained significantly associated. Of note, cardiologist ratios were higher on average in Hospital Referral Regions that had higher proportions of minority adults. Our results suggest that variations in socioeconomic population characteristics could be contributing to the geographic maldistribution of the cardiovascular workforce.
Exhibit 4.
Bivariate and Multivariable Association between Population Demographic Characteristics and the 2007 ratio of Cardiovascular Physicians to the Population Aged 65 Years or Older.
| Bivariate | Multivariate | |||||||
|---|---|---|---|---|---|---|---|---|
| Population Characteristics | Beta | P | 95% Confidence Interval | Beta | P | 95% Confidence Interval | ||
| Unemployment Rate 2007 | −5.89 | 0.01 | −10.39 | −1.38 | −4.02 | 0.04 | −7.86 | −0.19 |
| % High School Education 2000 | 1.13 | 0.012 | 0.25 | 2.02 | −0.61 | 0.23 | −1.61 | 0.39 |
| Median Household Income 2007 (in $10,000s) | 0.23 | <.001 | 0.19 | 0.27 | 0.22 | <.001 | 0.17 | 0.27 |
| % White Population 2000 | −1.18 | <.001 | −1.57 | −0.80 | −0.72 | <.001 | −1.11 | −0.34 |
Source: 2008 Editions of the Area Resource File; authors’ analysis.
DISCUSSION
We found that despite a growth in the cardiology workforce, there remained a consistent geographic maldistribution of cardiologists within the United States. Moreover, growth in the cardiology workforce did not match the growth in the total physician or primary care physician workforce. Our findings suggest that examinations of the cardiology workforce should extend beyond analysis of overall physician supply relative to clinical demand but also to geographic distribution. We found that many rural regions had persistently poor local access to cardiologists in both 1995 and 2007, as well as persistent maldistribution of cardiologists, including low cardiologist ratios in less densely populated areas that may not be able to sustain specialists. Our findings highlight the need for strategies that extend cardiologists to these communities, perhaps through technological innovations such as telemedicine.
Our analysis indicates that the growth in the cardiology workforce was relatively small when compared with the primary care and total physician workforce growth. We found that over a 12-year period, the mean cardiologist ratio within Hospital Referral Regions across the United States increased by approximately 4 specialists per 100,000 people aged 65 years or older. Comparatively, the growth in the mean primary care physician ratio and total physician ratio was approximately 58 physicians per 100,000 people aged 65 years or older and 233 physicians per 100,000 people aged 65 years or older respectively. Increases in mean population adjusted ratios indicate an overall growth in the cardiology workforce that outpaced the growth of the elderly population, yet highlight the relatively small increase in the cardiology workforce compared with other fields.
Although it is difficult to assess the optimal change in cardiologist ratio over time, it seems that the changes in cardiologist ratio were low given the needs of the population. Our results were consistent with previous studies that have found an overall growth in the cardiology workforce(6, 19), but also highlighted specific areas that exhibited the greatest growth. Growth in the cardiology workforce, although modest, is encouraging and perhaps due to the increase in cardiology fellowship programs over this time period.(20)
An overall growth in the cardiology workforce however, masks concerns about geographic distribution. Analysis of the Lorenz curves indicated that approximately 60 percent of the elderly populations within the United States had access to only 38 percent of the cardiologists. Conversely, approximately 50 percent of the cardiology workforce was spread among only 25 percent of the elderly population within the country, leaving large segments of the population having little access to specialists. Not only did we see that cardiologists were maldistributed across Hospital Referral Regions, but also that this remained relatively consistent over time.
The Gini coefficient and interquartile ratio calculations confirmed the uneven distribution patterns of cardiologists compared with primary care physicians and total physicians seen in our mapped data. Our findings were consistent with previous analyses that found that in 1992, primary care physicians were the most evenly distributed group of physicians when comparing states, followed by total physicians and finally specialists.(13, 21) Our mapping analysis showed the substantial workforce growth within the Hospital Referral Regions that comprised the highest cardiologist ratio quartile in 1995. These results corroborated recent studies that found that four of every five new physicians settle in regions where supply is already high.(19) The relatively even distribution of primary care physicians, compared with that of total physicians and cardiologists, suggests that policy efforts to distribute primary care physicians geographically have been relatively more successful. Interestingly however, cardiologists exhibited the largest percentage increase in Gini coefficient and decrease in interquartile ratio during the 12-year period, suggesting that the cardiology workforce is becoming more evenly distributed geographically. Perhaps this finding was a result of the large degree of initial maldistribution among cardiologists in 1995 or is an indication that there are now more, or more enticing, opportunities for cardiologists in previously underserved areas.
We found an association between cardiologist distribution and socioeconomic and racial variables. Our analysis was consistent with previous findings that access to cardiovascular healthcare services was allocated along socioeconomic lines, suggesting that such associations remain with respect to the current distribution of cardiologists. In addition, although racial disparities in cardiovascular outcomes have been well documented (22), our study found that minority populations were generally in close geographical proximity to cardiologists, highlighting the complexity of ensuring access to care and that geographic proximity is one of multiple important factors that affect access.
Our findings are particularly relevant for policy-makers. The newly enacted Patient Protection and Affordable Care Act has established the National Healthcare Workforce Commission, charged with assessing whether the demand for healthcare professionals is being met.(23) The Council on Graduate Medical Education estimated a decrease in growth within the workforce from the year 2010 onward because of an aging of the current physician workforce compounded by a disparate number of new physicians entering the field. Additionally, by 2015 the council estimates that the rate of population growth will exceed that of growth in the workforce, widening the gap created by the current shortage.(24)
Our study brings attention to geographic areas that seem to lack sufficient patient populations to generate the revenue necessary to offset the costs required to operate full-time cardiology practices. Ensuring access to care for these areas remains a substantial challenge that likely goes beyond physician recruitment. Improving cardiologist distribution, particularly in rural areas, will likely require technological advancements in delivery of care, such as telemedicine, in addition to addressing underlying efficiency problems within our health care system to better coordinate care between primary care physicians and specialists in rural areas.(25, 26) Nevertheless, at a minimum, our findings provide recent and accurate benchmarks to measure the effectiveness of physician recruitment efforts.
CONCLUSION
The distribution of cardiologists is increasingly relevant to policy discussions. With the aging of the population and rising obesity epidemic, chronic cardiovascular disease will only increase, contributing to an increasing demand for cardiologists. Our study highlights the current shortage of cardiologist supply in the United States, its geographic maldistribution, and the persistence of the maldistribution over time. Policy discussions attempting to solve the cardiology workforce crisis must focus not only on gross numbers but also on geographic distribution of cardiologists. Policies centered upon undirected growth of the workforce will continue to promote the geographic maldistribution of cardiologists. Initiatives that direct funds towards the recruitment of cardiologists to underserved rural areas will do the most the reverse the current gaps in the cardiologist workforce. Additionally, the establishment of cardiology training programs in underserved areas would not only promote growth of the overall cardiologist workforce, but may also increase the likelihood for cardiologists to continue to practice in underserved areas after graduating.
ENDNOTES
- 1.Birdwell RL, Mountford CE, Iglehart JD. Molecular imaging of the breast. Radiol Clin North Am. 2010 Sep;48(5):1075–88. doi: 10.1016/j.rcl.2010.07.017. [DOI] [PubMed] [Google Scholar]
- 2.J Am Coll Cardiol; 25th Bethesda Conference: Future Personnel Needs for Cardiovascular Health Care; Bethesda, Maryland. November 15-16, 1993; 1994. Aug, pp. 275–328. [PubMed] [Google Scholar]
- 3.J Am Coll Cardiol; 35th Bethesda Conference. Cardiology’s Workforce Crisis: a pragmatic approach; Bethesda, Maryland. 17-18 October 2003; 2004. Jul 21, pp. 216–75. [DOI] [PubMed] [Google Scholar]
- 4.Biro FM, Wien M. Childhood obesity and adult morbidities. Am J Clin Nutr. 2010 May;91(5):1499S–505S. doi: 10.3945/ajcn.2010.28701B. [DOI] [PMC free article] [PubMed] [Google Scholar]
- 5.Rodgers GP, Conti JB, Feinstein JA, Griffin BP, Kennett JD, Shah S, et al. ACC 2009 survey results and recommendations: Addressing the cardiology workforce crisis A report of the ACC board of trustees workforce task force. J Am Coll Cardiol. 2009 Sep 22;54(13):1195–208. doi: 10.1016/j.jacc.2009.08.001. [DOI] [PubMed] [Google Scholar]
- 6.Foot DK, Lewis RP, Pearson TA, Beller GA. Demographics and cardiology, 1950-2050. J Am Coll Cardiol. 2000 Apr;35(5 Suppl B):66B–80B. [PubMed] [Google Scholar]
- 7.Goodman DC. Do we need more physicians? Health Aff (Millwood) 2004 Jan-Jun;:W4-67–9. doi: 10.1377/hlthaff.w4.67. Suppl Web Exclusives. [DOI] [PubMed] [Google Scholar]
- 8.US Department of Health and Human Services, Health Resources and Services Administration: Area Resource File (ARF): National county-level health resource information database. http://www.arfsys.com.
- 9.Dartmouth Institute for Health Policy and Clinical Practice. The Dartmouth Atlas of Healthcare Website. http://www.dartmouthatlas.org.
- 10.Goodney PP, Travis LL, Malenka D, Bronner KK, Lucas FL, Cronenwett JL, et al. Regional variation in carotid artery stenting and endarterectomy in the Medicare population. Circ Cardiovasc Qual Outcomes. 2010 Jan 1;3(1):15–24. doi: 10.1161/CIRCOUTCOMES.109.864736. [DOI] [PMC free article] [PubMed] [Google Scholar]
- 11.Krumholz HM, Merrill AR, Schone EM, Schreiner GC, Chen J, Bradley EH, et al. Patterns of hospital performance in acute myocardial infarction and heart failure 30-day mortality and readmission. Circ Cardiovasc Qual Outcomes. 2009 Sep;2(5):407–13. doi: 10.1161/CIRCOUTCOMES.109.883256. [DOI] [PubMed] [Google Scholar]
- 12.O’Hare AM, Rodriguez RA, Hailpern SM, Larson EB, Kurella Tamura M. Regional variation in health care intensity and treatment practices for end-stage renal disease in older adults. JAMA. 2010 Jul 14;304(2):180–6. doi: 10.1001/jama.2010.924. [DOI] [PMC free article] [PubMed] [Google Scholar]
- 13.Chang RK, Halfon N. Geographic distribution of pediatricians in the United States: an analysis of the fifty states and Washington, DC. Pediatrics. 1997 Aug;100(2 Pt 1):172–9. doi: 10.1542/peds.100.2.172. [DOI] [PubMed] [Google Scholar]
- 14.Odisho AY, Cooperberg MR, Fradet V, Ahmad AE, Carroll PR. Urologist density and county-level urologic cancer mortality. J Clin Oncol. 2010 May 20;28(15):2499–504. doi: 10.1200/JCO.2009.26.9597. [DOI] [PMC free article] [PubMed] [Google Scholar]
- 15.Bonow RO, Smith SC., Jr Cardiovascular manpower: the looming crisis. Circulation. 2004 Feb 24;109(7):817–20. doi: 10.1161/01.CIR.0000119801.38445.8F. [DOI] [PubMed] [Google Scholar]
- 16.Shea JA, Kletke PR, Wozniak GD, Polsky D, Escarce JJ. Self-reported physician specialties and the primary care content of medical practice: a study of the AMA physician masterfile. American Medical Association. Med Care. 1999 Apr;37(4):333–8. doi: 10.1097/00005650-199904000-00003. [DOI] [PubMed] [Google Scholar]
- 17.Simmons HJ, 3rd, Rapoport DH. How will physician extenders affect our need for physicians? Health Care Strateg Manage. 2007 Nov;25(11):4–5. [PubMed] [Google Scholar]
- 18.Fuster V, van der Zee S, Elmariah S, Bonow RO. Academic careers in cardiovascular medicine. Circulation. 2009 Feb 10;119(5):754–60. doi: 10.1161/CIRCULATIONAHA.108.792564. [DOI] [PubMed] [Google Scholar]
- 19.Goodman DC. Twenty-year trends in regional variations in the U.S. physician workforce. Health Aff (Millwood) 2004:VAR90–7. doi: 10.1377/hlthaff.var.90. Suppl Web Exclusives. [DOI] [PubMed] [Google Scholar]
- 20.Hirshfeld J, Jr, Fye WB. Summary of Task Force recommendations to address the growing shortage of cardiologists. J Am Coll Cardiol. 2004 Jul 21;44(2):272–5. doi: 10.1016/j.jacc.2004.05.028. [DOI] [PubMed] [Google Scholar]
- 21.Matsumoto M, Inoue K, Bowman R, Kajii E. Self-employment, specialty choice, and geographical distribution of physicians in Japan: A comparison with the United States. Health Policy. 2010 Aug;96(3):239–44. doi: 10.1016/j.healthpol.2010.02.008. [DOI] [PubMed] [Google Scholar]
- 22.Chen J, Rathore SS, Radford MJ, Wang Y, Krumholz HM. Racial differences in the use of cardiac catheterization after acute myocardial infarction. N Engl J Med. 2001 May 10;344(19):1443–9. doi: 10.1056/NEJM200105103441906. [DOI] [PubMed] [Google Scholar]
- 23.Iglehart JK. Health reform looms as major factor in midterm election battles. Health Aff (Millwood) 2010 Aug;29(8):1429–31. doi: 10.1377/hlthaff.2010.0730. [DOI] [PubMed] [Google Scholar]
- 24.American Association of Medical Colleges Center for Workforce Studies. Health Care Reform and the Health Workforce. 2010 www.aamc.org/workforce/healthcarereformleg.pdf.
- 25.Berman M, Fenaughty A. Technology and managed care: patient benefits of telemedicine in a rural health care network. Health Econ. 2005 Jun;14(6):559–73. doi: 10.1002/hec.952. [DOI] [PubMed] [Google Scholar]
- 26.Goodman DC, Fisher ES. Physician workforce crisis? Wrong diagnosis, wrong prescription. N Engl J Med. 2008 Apr 17;358(16):1658–61. doi: 10.1056/NEJMp0800319. [DOI] [PubMed] [Google Scholar]