

It is widely appreciated that our understanding of nonequilibrium phenomena has not kept pace with its equilibrium counterpart. In recent years, however, consideration of the above question, posed at the microscopic level of statistical mechanics, has yielded some intriguing theoretical results distinguished by two common features. First, the results remain valid far from equilibrium, that is, even if the system is disturbed violently from its initial equilibrium state. Second, they incorporate information about the history of the system over some span of time; effectively, these results are statistical predictions about what we would see if we could watch a movie of the system filmed at the atomic level, rather than predictions about individual snapshots.
To date, this work has been theoretical, although it has been supplemented with numerical simulations. However, in the current issue of PNAS, Hummer and Szabo (1) show how to combine these theoretical advances with single-molecule manipulation experiments, so as to extract useful equilibrium information from nonequilibrium laboratory data. What these authors propose amounts to a distinctive method of deducing the equilibrium mechanical properties of individual molecules.
The scenario, roughly, is the following. Imagine a molecule, perhaps a linear polymer, that can be stretched like a tiny rubber band by tugging at one end by using micromanipulation technology such as atomic force microscopy or optical tweezers. Suppose we want to determine the equilibrium tension of this molecule as a function of its elongation or extension at a given temperature. We therefore stretch it, pulling out one end of the molecule at some constant speed while simultaneously measuring the restoring force. From these data, we can construct a plot of force vs. extension, as shown in figure 2 Inset of ref. 1. However, this information might not be what we are after; if we stretch the molecule too fast, we drive it out of equilibrium, resulting in hysteresis. The measured force will then tend to overestimate the equilibrium tension. (The same happens with macroscopic rubber bands, which heat up and become more tense when stretched rapidly.) One solution to this problem is to pull very slowly, allowing the molecule to maintain a gradually changing state of equilibrium. Hummer and Szabo's surprising alternative (1) involves numerous “rapid” pulling experiments, rather than a single slow pull. The authors provide a prescription for combining the data from these repeated experiments, so that what ultimately emerges is the equilibrium tension as function of elongation, even if the molecule was driven away from equilibrium during the pulling process! Moreover, they make a solid case—by using simulations as well as analysis of published micromanipulation data—that their method is experimentally feasible.
Hummer and Szabo (1) anchor their proposal in rigorous analysis, invoking the Feynman–Kac theorem for stochastic processes. Although this analysis is important for anyone wishing to gain a true appreciation of the theoretical ideas behind the work, the essence of those ideas can be conveyed without delving into the technical details of the derivation. In what follows, I will present a cartoon version of the experiments proposed in ref. 1 and use this model to illustrate the underlying principles.
Imagine the chain-like, one-dimensional “molecule” shown in Fig. 1. The three beads depict atoms, the springs represent the forces between them. One end of the chain is tethered to a wall (or some other appropriately immovable object), while the other is attached to a handle that we are able to grasp and move at will. The variable λ, denoting the distance between the wall and the handle, is viewed as an external parameter. The vector x = (x1, x2, x3) denotes the microscopic configuration of the molecule, specifying the position of each atom. Let us furthermore imagine that this molecule is immersed in a thermal environment at temperature T, so that, if we fix the value of λ, the molecule will relax to a state of equilibrium.
Figure 1.

A “toy” molecule, as described in the text.
We now adopt a statistical attitude, imagining infinitely many copies or realizations of the system. We will then make statements about the response of this ensemble to a rapid change in λ, assuming an initial state of equilibrium. Effectively, we will be discussing the statistics of a collection of microscopic histories, each representing one possible scenario for the evolution of the molecule over a fixed time interval during which the handle is drawn out from one position to another.
In equilibrium, with the handle held at some distance λA from the wall, the configurations of the molecule are distributed according to the Boltzmann–Gibbs formula:
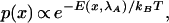 |
1 |
where E is the energy of the configuration and kBis Boltzmann's constant. Let us take this equation to define our initial conditions. Now imagine that, starting from this equilibrium state, we perturb the system by pulling the handle outward from λA to some new position λB. Unless we pull very slowly, the state of the ensemble will soon lag behind the instantaneous equilibrium state.
It is quite possible that there exists no simple, general formula describing the nonequilibrium distribution of configurations at the instant the handle reaches λB; the ensemble response to the perturbation may simply be too complicated and too dependent on numerous details of the thermal environment. This situation is in marked contrast to the sweeping generality of equilibrium statistical mechanics, where at most a few parameters characterizing the environment (e.g., temperature, pressure, and chemical potential) suffice to pin down the statistical state of any system that has been allowed to equilibrate with that environment. However—and this idea is at the heart of the method proposed in ref. 1—we can indeed make statements of comparable generality in this nonequilibrium situation, if we are willing to consider the entire evolution of each realization, rather than just the instantaneous state of the ensemble.
For any one of the “mental copies” in our ensemble, the evolution of the molecule is described by a trajectory x(t), detailing the motion of each atom as the handle is drawn from λA to λB. From knowledge of this trajectory, we can compute, among other interesting quantities, the microscopic external work, W, performed on the molecule by whatever agent pulls the handle. (In the present context, W is the tension of the red spring shown in Fig. 1, integrated over the distance along which the handle is pulled.) Because the precise thermal jiggling of each atom differs from one realization to the next, the value of W will differ as well. Now imagine that we note down two pieces of information about each realization: the final configuration of the molecule, xf, at the instant the handle reaches λB and the total work W performed by pulling the handle from λA to λB. We then use these data to construct two distributions characterizing the ensemble: an ordinary, “democratic” distribution of the final configurations xf, with each realization contributing equally and a weighted, “undemocratic” distribution of the same xf values, in which the contribution of each realization is scaled by a factor e−W/kBT. (See Fig. 2 for a schematic representation or figures 5 and 6 of ref. 2 for an actual construction of such distributions.) Although the former is simply the final nonequilibrium state of our ensemble, the latter will be proportional to the Boltzmann–Gibbs distribution corresponding to parameter value λB, no matter how slowly or quickly we pull the handle! (Various proofs of this assertion are found in refs. 1–3.)
Figure 2.

A schematic representation of the ordinary and weighted distributions of molecule configurations. (Left) A simple snapshot of the ensemble at a given moment in time, for instance when the handle reaches the position λB; each circle represents the current configuration of a specific realization. (Right) Each realization is additionally assigned a statistical weight, depicted by the size of the size of the circle.
Of course, there is nothing unique about position λB; once we start to perturb the system away from equilibrium, we can at any time note down—for each realization—both the current configuration of the molecule, x(t), and the work performed up to that instant, W(t). We can then construct a dynamical picture in which a collection of trajectories evolves through configuration space, each bearing a time-dependent statistical weight e−W/kBT. At every instant in time, this weighted ensemble will be proportional to the equilibrium distribution associated with the current value of λ. Even if λ is changed very quickly and each realization barely has time to respond, the weighted distribution will nevertheless keep up with the rapidly changing associated equilibrium state.
An immediate implication of this result is that we can extract equilibrium information from nonequilibrium data in this situation, simply by tagging each realization with a statistical weight e−W/kBT and computing averages with the weighted distribution. Essentially, Hummer and Szabo (1) bring this idea to the experimental arena of molecular micromanipulation. Their proposed method is in fact somewhat more sophisticated, taking into account complicating features of a realistic laboratory set-up, but the underlying philosophy is the same. The authors show how to reconstruct the potential of mean force (PMF) associated with a particular pulling coordinate, which in the proposed experiments is guided externally. If this coordinate also happens to be a good reaction coordinate that accurately describes the path taken by the molecule during a spontaneous transition from one long-lived state to another—for instance, from a bound to an unbound protein–ligand complex—then the deduced PMF will characterize not only the static properties of the molecule but its dynamic behavior as well.
The recent theoretical progress in this area has included other results as well, such as the nonequilibrium work relation of ref. 4 and Crooks's (5) elegant formula relating the probabilities of “forward” and “reverse” trajectory segments (a kind of detailed balance statement for microscopic histories). Taking a broader perspective, the idea of studying the statistics of entire trajectories has enjoyed a certain popularity in recent years, making appearances in the Fluctuation Theorem (6–8), the efficient sampling of transition paths and calculation of rate constants of complex chemical reactions (9–12), and derivations of inequalities for transitions between nonequilibrium steady states (13–15).
My primary aim in this commentary has been to summarize the theoretical result behind the method proposed in ref. 1. Namely, when a system is perturbed away from equilibrium by the arbitrary variation of an external parameter, then a particular statistical description of its response—constructed via the weighting procedure outlined above—behaves with remarkable simplicity; it exactly follows the instantaneous equilibrium state associated with the changing value of the parameter. Hummer and Szabo (1) have translated this abstract notion into a concrete proposal for an experimental method of measuring the properties of molecules. Not only does their method represent a potentially useful laboratory technique, but an experiment along these lines would provide the first direct test of the underlying theory.
Acknowledgments
I thank Profs. David Chandler and Christoph Dellago for useful correspondence regarding this commentary.
Footnotes
See companion article on page 3658.
References
- 1.Hummer G, Szabo A. Proc Natl Acad Sci USA. 2001;98:3658–3661. doi: 10.1073/pnas.071034098. [DOI] [PMC free article] [PubMed] [Google Scholar]
- 2.Jarzynski C. Phys Rev E Stat Phys Plasmas Fluids Relat Interdiscip Top. 1997;56:5018–5035. [Google Scholar]
- 3.Crooks G E. Phys Rev E Stat Phys Plasmas Fluids Relat Interdiscip Top. 2000;61:2361–2366. doi: 10.1103/physreve.60.2721. [DOI] [PubMed] [Google Scholar]
- 4.Jarzynski C. Phys Rev Lett. 1997;78:2690–2693. [Google Scholar]
- 5.Crooks G E. J Stat Phys. 1998;90:1481–1487. [Google Scholar]
- 6.Evans D J, Cohen E G D, Morriss G P. Phys Rev Lett. 1993;71:2401–2404. doi: 10.1103/PhysRevLett.71.2401. [DOI] [PubMed] [Google Scholar]
- 7.Evans D J, Searles D J. Phys Rev E Stat Phys Plasmas Fluids Relat Interdiscip Top. 1994;50:1645–1648. doi: 10.1103/physreve.50.1645. [DOI] [PubMed] [Google Scholar]
- 8.Gallavotti G, Cohen E G D. J Stat Phys. 1995;80:931–970. [Google Scholar]
- 9.Dellago C, Bolhuis P G, Csajka F S, Chandler D. J Chem Phys. 1995;108:1964–1977. [Google Scholar]
- 10.Bolhuis P, Dellago C, Chandler D. Faraday Discuss Chem Soc. 1998;110:421–436. [Google Scholar]
- 11.Geissler P L, Dellago C, Chandler D. J Phys Chem B. 1999;103:3706–3710. [Google Scholar]
- 12.Geissler, P. L., Dellago, C., Chandler, D., Hutter, J. & Parinello, M. (2001) Science, in press. [DOI] [PubMed]
- 13.Hatano T. Phys Rev E Stat Phys Plasmas Fluids Relat Interdiscip Top. 1999;60:R5017–5020. doi: 10.1103/physreve.60.r5017. [DOI] [PubMed] [Google Scholar]
- 14.Hatano, T. & Sasa, S. (2000) http://xxx.lanl.gov/abs/cond-mat/0010405.
- 15.Shibata, T. (2000) http://xxx.lanl.gov/abs/cond-mat/0012404.