Abstract
Probes with runs of four or more guanines (G-stacks) in their sequences can exhibit a level of hybridization that is unrelated to the expression levels of the mRNA that they are intended to measure. This is most likely caused by the formation of G-quadruplexes, where inter-probe guanines form Hoogsteen hydrogen bonds, which probes with G-stacks are capable of forming. We demonstrate that for a specific microarray data set using the Human HG_U133A Affymetrix GeneChip and RMA normalization there is significant bias in the expression levels, the fold change and the correlations between expression levels. These effects grow more pronounced as the number of G-stack probes in a probe set increases. Approximately 14% of the probe sets are directly affected. The analysis was repeated for a number of other normalization pipelines and two, FARMS and PLIER, minimized the bias to some extent. We estimate that ∼15% of the data sets deposited in the GEO database are susceptible to the effect. The inclusion of G-stack probes in the affected data sets can bias key parameters used in the selection and clustering of genes. The elimination of these probes from any analysis in such affected data sets outweighs the increase of noise in the signal.
INTRODUCTION
The use of microarray technologies, such as the Affymetrix GeneChip, has revolutionized gene expression profiling over the past 10 years. It provides a quick and relatively cheap method for the high-throughput quantification of expression for a range of species. How this quantification is carried out has been discussed at length elsewhere (1,2). In summary, the amounts of hybridization with short fragments (25 bases long for GeneChips) of 11–20 regions of a gene are measured from strands of complementary ssDNA (called probes) lithographically printed onto a chip using fluorescent labelling. The sequence fragments are picked so that they are intended to be unique for the gene of interest. A group of probes that are complementary for a specific gene are referred to as a probe set.
The analysis of this type of data has presented a number of challenges and a considerable amount of effort has focussed on issues such as the summarization of the data from different probes (3,4), background correction and normalization (5,6). Apart from the implications of GC content on normalization, comparatively little work has been done on the effect of the underlying biophysics of these devices, though it has been found that probes containing runs of four or more contiguous guanines show abnormally high levels of hybridization (7). It has furthermore been shown that such probes are not reliable for measuring gene expression in the various Affymetrix GeneChips of mammalia, as these probes exhibit an unusually high correlation with each other (8,9).
The likely cause for these anomalies is that the runs of guanines in the probes are forming G-quadruplexes (8,10,11). Such quadruplexes form through a series of Hoogsteen hydrogen bonds between the guanines with a centrally placed metal ion. Examples of non-Watson–Crick bonding in nucleic acid structures have been noted for nearly 50 years (12). More recently, G-quadruplex formation has been shown to play a role in, for example, telomere structure (13). In previous examples, the G-quadruplexes form from a single nucleic acid strand with a specific pattern of repeats of guanines in its sequence. In the case of the microarray, however, the closely packed strands of ssDNA in an individual probe spot of a microarray imply that four individual strands can bind together in this fashion. With such a structure formed, the effective binding length of the probes is now much shorter, and hence hybridzation with a much larger number of mRNA sequences is now possible (14).
While this effect has been demonstrated at the probe level, its impact on the expression levels derived from probe sets has not been investigated; that is the purpose of this article. The effects are measured by examining the changes in expression levels that result when the G-stack probes are masked.
Throughout this article we define a G-stack probe as a probe having a single subsequence (run) of exactly four guanines and correspondingly a normal probe as a probe that does not contain any runs of four guanines. We note that probe sets without G-stack probes can potentially also be affected by G-stack probes because of the complex nature of the background correction and normalization procedures applied, though, as we shall see, the effects in such cases are smaller.
Having identified probes that could bias the final normalized expression levels, the simplest procedure is to mask such probes in the normalization procedure. Upton et al. (8) showed that the bias effect is variable across experiments so that there will be an increase in the noise in the final expression level. Li and Wong (15) demonstrated that the variation over replicates at the individual probe level can be much smaller than the variation between probes in a probe set indicating that the final summarized value can be highly susceptible to the elimination of a single probe. It is therefore important that, in addition to examining the effect of eliminating G-stack probes we also examine the effect of eliminating normal probes. This will enable us to compare the advantages of reduced bias (due to the elimination of G-stack probes) with the disadvantages of reduced precision (because of the reduction in the number of potentially informative probes) for the estimated gene expression levels.
In this article, the effect of G-stack probes on three commonly measured parameters is investigated, namely:
the overall normalized expression level of each probe set;
the fold change between different conditions; and
the correlation between expression levels taken across different conditions.
In the case of gene expression we examine the change in the expression level that results when we eliminate either a specific number of G-stack probes or the same number of normal probes. For the other two parameters we also analyse the effect of masking all G-stack probes from the normalization procedure, showing how the effect varies according to the number of G-stack probes in the probe set.
We focus initially on the commonly employed normalization pipeline RMA (3). It is one of the most commonly employed normalization pipelines and is composed of three steps:
Background correction: the measured intensity for each probe in a given array is corrected by modelling all the data for an individual array as the product of two distributions (Gaussian and Exponential) that represent the noise and signal, respectively. The modelled noise component is then subtracted from the measured intensity.
Normalization: in order to ensure that the overall distribution of the corrected intensities is the same over all the arrays in the experiment, a quantile normalization algorithm is applied (16). This algorithm is applied simultaneously over all the data on each array.
Summarization: a final estimate of the summarized value from all of the probes in each probe set is computed by modelling the corrected and normalized intensities with a linear model including a noise component and a probe effect component as well as the summarized value for each probe set in a particular array. These parameters are estimated using median polish.
The analysis can be easily repeated for any number of different normalization pipelines and we have provided the biases for other commonly used pipelines — gcRMA (17), tRMA (18), MAS5 (19), FARMS (20) and PLIER (Guide to Probe Logarithmic Intensity Error (PLIER) Estimation, Affymetrix Technical report, Santa Clara 2005). gcRMA and tRMA are extensions of RMA, with the former attempting to correct for sequence-specific hybridization effects and the latter being a small modification of RMA to reduce biases in correlations due to the normalization procedure. MAS5 is of one the early normalization pipelines provided by Affymetrix and is still widely employed. FARMS employs a factor-analysis model that gives an improved agreement with artificial spike-in data from Affymetrix. Finally, PLIER attempts to provide an improved estimate of low intensities.
The article is organized as follows. In the ‘Materials and Methods’ section, the criteria used in selecting the microarray data set are discussed and details are given of the abundance of G-stack probes in the probe sets of the HG_U133A GeneChip. Following this, a detailed explanation on the choice of a control set of probes to determine the significance of the removing the G-stacks is given. The parameters measured are explained in more detail and a description of how they were computed is provided. The results of these analyses are presented. An estimate of the prevalence of this effect over other HG_U133A data sets and different normalizations is given. In the conclusions, there is a discussion of the impact this effect will have on the analysis of such data sets in the future.
MATERIALS AND METHODS
In this article, we focus on the HG_U133A Affymetrix GeneChip that contains a total of 22 283 annotated probe sets. Table 1 gives the frequencies of G-stack probes and affected probe sets in the HG_U133A chip design. We note that slightly over one-third of the probe sets contain at least one G-stack probe.
Table 1.
The numbers of probe sets that have specified numbers of G-stack probes
| No. of G-stack probes in a probe set | 0 | 1 | 2 | ≥3 |
| No. of affected probe sets | 13 985 | 5188 | 2124 | 986 |
Microarray data for the HG_U133A GeneChip are publicly available at the NCBI Gene Expression Omnibus (GEO) repository (21). Each experiment (data set) consists of a set of measurements that are stored in CEL files. Each of the more than 800 experiments available on GEO has its own GSE index number. We have examined the data from a sample of these experiments that represented the full complement of data deposited until 2007 and which has been used for earlier papers examining these effects at a probe level (8,9). We have used the data from experiment GSE1869 to illustrate our findings, since the effects of the G-stack probes are particularly clear for that experiment. The experiment GSE1869 contains the data reported in a study of ischaemic and non-ischaemic cardiomyopathy (22), which consists of 25 CEL files. We discuss later the magnitude of the effects in other experiments.
In order to mask particular probes it is necessary to create a new Chip Definition File (CDF). This can be done using the probe sequence file provided by Affymetrix, a short script to identify the specific sequences to be masked, the original CDF and the Xspecies software (23) to generate the new CDF. More detailed instructions can be found in the Supplementary Data (also available at: http://gene.cs.rhul.ac.uk/Gstack).
Construction of a control: equal sized probe sets
As discussed previously, the elimination of a probe from a probe set will increase (sometimes substantially) the noise of the resulting signal (15,24). Furthermore, because of the complicated procedure for obtaining a final normalized value for each gene it is not clear if the random elimination of a probe will cause a bias in the results. The first step is therefore to disentangle the significance of removing G-stack probes from a probe set with the effect of reducing the size of a probe set. To that end we select two groups of probe sets
Group A2: Probe sets that contain exactly two G-stack probes,
Group B2: Probe sets containing no G-stack probes.
Group B2 is chosen randomly, but contains exactly the same number of probe sets as in Group A2 (numbers of probe sets are listed in Table 1). We remove the two G-stack probes from Group A2 and two randomly selected probes from each probe set in B2. Hence there are two new normalizations, one where the G-stack probes in A2 have been masked and one where the random probes in B2 have been masked. We then examine how removing these probes affects the parameters discussed below. Since exactly the same number of probes has been removed in each case, any overall differences in the magnitudes of the changes will show the effect of the G-stacks. We have chosen to eliminate two probes as a similar analysis eliminating one probe did not produce a clear difference between the groups. We have also applied different schemes for selecting probes on the basis of their intensity within a set of CEL files (described in Supplementary Methods and Supplementary Figures S1–S3) and found similar effects to those described below.
Parameters measured
We have investigated the effects of G-stack probes using three different parameters; the normalized expression levels, the fold change and the correlation among the affected probe sets. In the first case we only examine the effect of using the A2 and B2 groups. In the latter two cases, which are of more biological significance, we also examine how they change between probe sets with different numbers of G-stack probes in them. In the case of comparing the varying number of G-stack probes we use one normalization where all the G-stack probes have been masked.
Expression levels
Normalized expression levels on their own are typically used for quality control purposes [for example MA plots initially introduced for cDNA microarrays by Dudoit et al. (25)]. In a similar vein, we compare the difference between the corrected normalized expression levels for groups A2 and B2 and their original normalized expression levels as a function of the original normalized expression level.
Fold change
A commonly measured parameter is the fold change, which we define here as FC(i) = y1(i) − y2(i), where i is the i-th gene and y1(i), y2(i) are the means of the logarithm of expression levels for two different conditions.
Rigorous tests of statistical significance may be used to determine differential expression, but an absolute minimum fold change is still often used as a cut off when selecting differentially expressed genes (26). In the case of the data set being examined here the fold change is taken between those samples from patients with ischaemic or non-ischaemic cardiomyopathy.
The fold change is computed for the A2 and B2 groups described above and scatter plots drawn of the difference between the fold change using the new and the original normalizations as a function of the fold change computed using the original normalization. Similar plots were drawn using probe sets with the same number of G-stack probes to determine the effect of varying the number of G-stack probes.
Correlations between expression levels
Co-expression of genes across conditions has been used as a fundamental principle in functional annotation and determining genes involved in common processes (27) and has been a key assumption in inferring interactions between gene products in Systems Biology (28). Upward biases in correlations due to G-stack probes being present in two probe sets could imply functional associations that are not present and could make it more difficult to identify actual functionally relevant clusters of genes or introduce extra false positives in the inference of gene product interactions.
Pearson correlations are computed for every pair of probe sets in the A2 and B2 groups described above and plots drawn of the difference between the correlations using the new and the original normalizations as a function of the correlation computed using the original normalization. Similar plots were drawn using pairs of probe sets with the same number of G-stack probes to determine the effect of varying the number of G-stack probes.
RESULTS
Expression levels
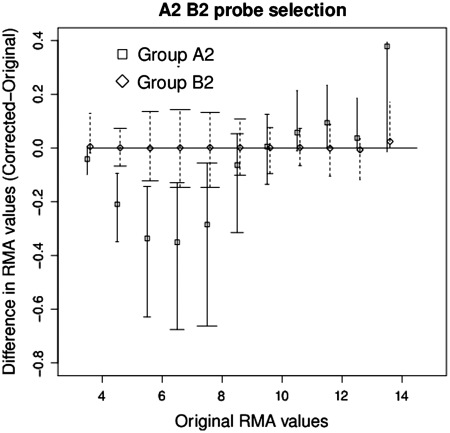
Figure 1 illustrates the changes in expression levels over all the CEL files in GSE1869 for the groups A2 and B2, where A2 are the probe sets with two G-stack probes in them, B2 is a randomly selected list of probe sets without any G-stack probe and where B2 is the same size as A2. We see a non-linear pattern of variation for group A2 that is consistent with the interpretation that the G-stack probes that have been eliminated in A2 have a fixed and moderately high intensity. Probe sets in A2 where the non-G-stack probes have intensities that are less than this will be biased upwards and those above will be biased downwards. On the other hand group B2, while having a large variance, shows no evidence for any overall bias.
Figure 1.
Plot comparing change in expression values in the data set GSE1869, before and after removal of two probes, of the probe sets in groups A2 and B2. The central values represent the median while the bars indicate the upper and lower quartiles. The width of the end bars reflect the number of data points (widest for the most numerous, shortest for the least).
Fold change
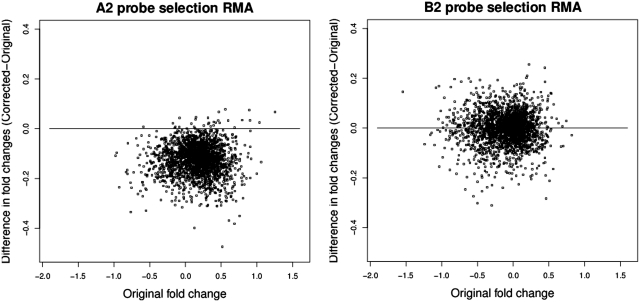
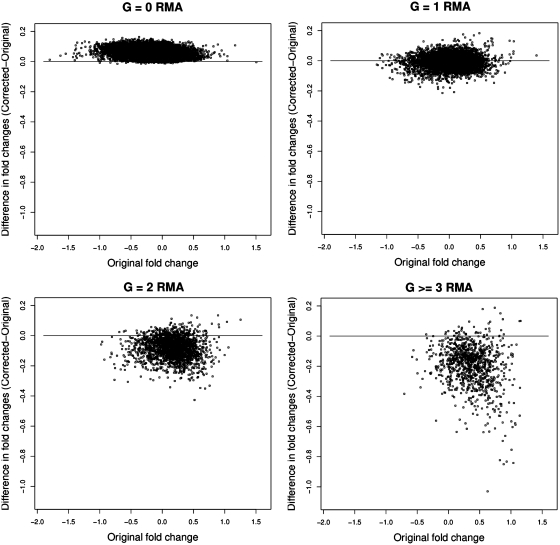
In Figure 2, we plot the difference between the fold change with and without the masked probes against the fold change with the masked probes included for groups A2 and B2. While there is a substantial variation in B2 there is no evidence of a bias. On the other hand, there is clear evidence for bias in A2. In Figure 3 we plot how the fold change behaves for probe sets with different number of G-stack probes in them, so for example the sub-plot labelled G = 1 represents the change in the fold change for probe sets that have precisely one G-stack probe. Equivalently the sub-plot labelled G ≥ 3 represent those probe sets that have three or more G-stack probes in them. The biased impact of the changes, increasing with the removal of increasing numbers of G-stack probes, is evident. We also note that the G = 0 data exhibits a small amount of bias in the opposite direction to the others, while G = 1 exhibits no obvious bias.
Figure 2.
Scatter plots comparing the change in fold change, before and after removal of two probes, of the probe sets in (i) group A2 (ii) group B2.
Figure 3.
Scatter plots of the difference in fold change values of probe sets before and after removal of G-stack probes. The individual figures represent the change in fold change values for those probe sets that have 0, 1, 2 and 3 or greater G-stack probes in them.
Analysis of correlation between expression levels
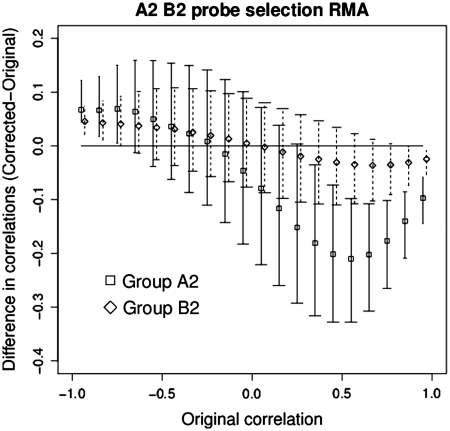
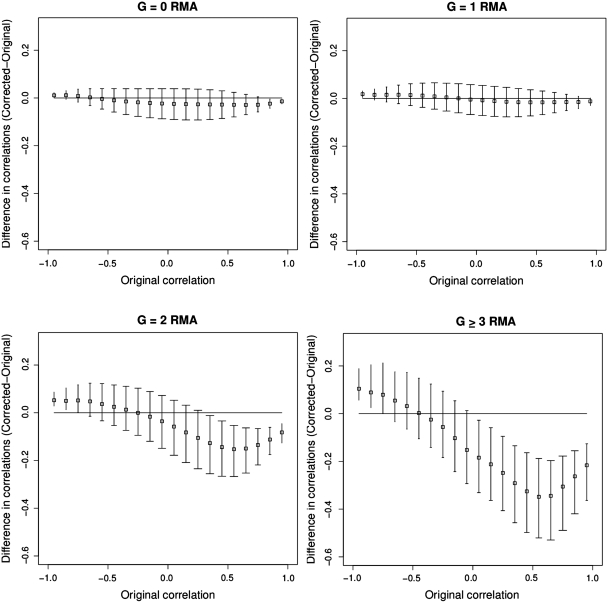
In Figure 4, we plot the difference between the correlations with and without the masked probes against the correlations with the masked probes included for all pairs of probe sets in groups A2 and B2. The removal of random probes in a probe set will increase the noise and hence in group B2 we see evidence of the magnitude of correlation decreasing when we remove the probes. In A2 we see a significantly larger and asymmetric effect. We note that this effect is most noticeable for original correlations in the range 0.4–0.7. In Figure 5 we plot how the correlation behaves for probe sets with different number of G-stack probes in them. The biased impact of the changes, increasing with the removal of 2 or more G-stack probes, is evident. A possible source of bias in A2 may be that the affected probe sets are more functionally related to each other than a random collection of probe sets. To this end, we computed the probability of over-representation for all relevant Gene Ontology (GO) terms (31) for the Biological Process (BP) and Molecular Function (MF) ontologies for A2 and B2. Using the Kolmogorov–Smirnov test, we found significantly over-represented GO terms in BP and MF had similar distributions in A2 and B2.
Figure 4.
Plot comparing the change in correlation, before and after removal of two probes, of the probe sets in groups A2 and group B2. The central points indicate the median. The bars indicate the upper and lower quartiles. The width of the end bars reflect the number of data points (widest for the most numerous, shortest for the least).
Figure 5.
The change in correlations among the expression values of probe sets before and after removal of G-stack probes. Each figure plots the change in correlations for those probe sets that have exactly 0, 1, 2 and 3 or more G-stack probes in them. The central points indicate the median. The bars indicate the upper and lower quartiles. The width of the end bars reflect the number of data points (widest for the most numerous, shortest for the least).
Estimating the extent of bias among other HG_U133A data
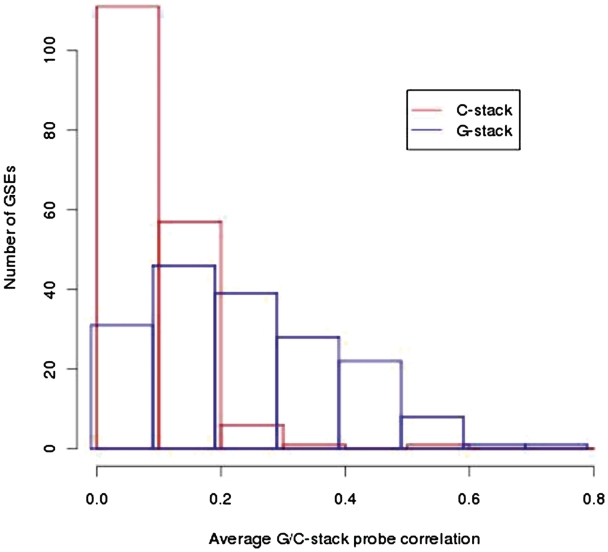
As determined previously, the G-stack bias is variable across individual experiments (8) and hence we employ a proxy to estimate the size of the bias for other experiments. The proxy is computed as follows: 1000 G-stack probes are randomly selected from probe sets with only one G-stack in them. We call this set of probes Gr. For each of 176 HG_U133A data sets (experiments) deposited at GEO [the same selection that has been used in previous analyses (8),(9)], we compute the following
where [α] represents an individual CEL file,  is the expression level for the i-th probe from CEL file [α] and R[α] is the average of the log of the expression levels over all non-control probes (i.e. biologically relevant probes) for that CEL file. The correlation ρij over all CEL files between probes of Gr in a data set is computed and the average of ρij for all i ≠ j is calculated. In order to provide a control, we computed similarly defined average correlations for each of the above experiments using 1000 randomly selected probes with runs of four cytosines. In Figure 6 we plot a histogram of the resulting 176 averages. It is notable that the average correlation for the C-stacks is much closer to zero, though it is noticeable that the average correlation in both cases is almost always positive.
Figure 6.
A histogram of the average correlation between G-stack and C-stack probes for 176 HG_U1333A GeneChip data sets deposited at GEO. For clarity the G-stack probes are displaced slightly to the left.
In addition to GSE1869, another six data sets were selected with a range of average correlations and CEL file numbers. Their average G-stack correlations are shown in Table 2. The above analyses were repeated for each data set. The final plots are shown in the Supplementary Data (http://gene.cs.rhul.ac.uk/Gstack). GSE1869 represents an extremum with a very high average G-stack correlation, however we see evidence for G-stack bias for smaller average G-stack correlations. We note that GSE2395 has an average G-stack correlation of 0.41 and still exhibits a noticeable bias (GSE2018, with an average G-stack correlation of 0.30 exhibits no noticeable bias). Assuming the proxy used here is indicative of the bias for each data set from Figure 6 this indicates that ∼15% of HG_U133A data sets in GEO are susceptible to G-stack bias.
Table 2.
The data sets examined and their average G-stack probe correlation
Different normalizations
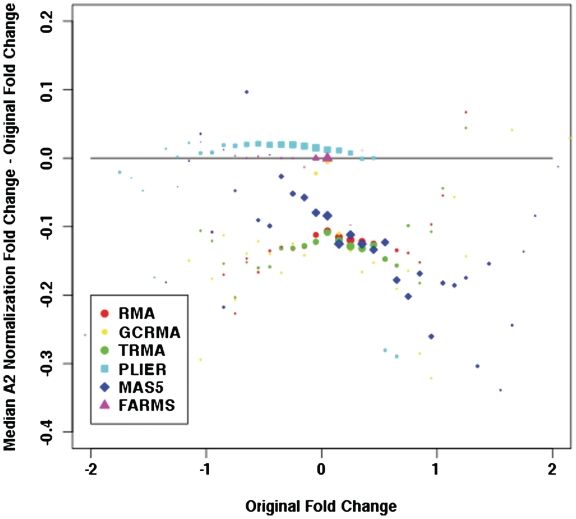
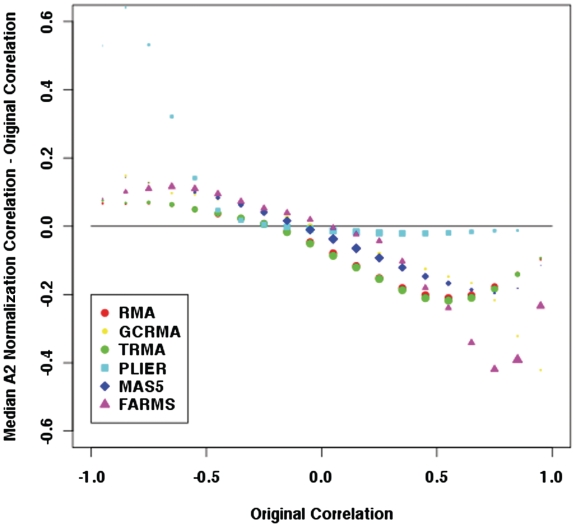
In order to determine if the observed impact of G-stacks is an artefact of the RMA algorithm, the above procedures were repeated using the normalization pipelines gcRMA, tRMA, MAS5, FARMS and PLIER, in particular focussing on the bias in the fold change and correlation in group A2. In both cases, the differences were binned and medians computed (ignoring bins where there are less than 20 entries). In Figure 7 we plot the binned medians of the difference in the fold changes for the different normalizations. We note that the biases for gcRMA, tRMA and MAS5 are similar to RMA while the bias is smaller for FARMS and PLIER, although there is a sharp increase for original fold changes that are greater than 1.4 (we note also the significant change in the range of original fold changes). In Figure 8 we plot the binned medians for the difference in correlations and we find that RMA, gcRMA, tRMA, MAS5 and FARMS exhibit a similar bias for larger positive correlations. Again PLIER exhibits a much smaller bias, though we note that there is a noticeable large bias for large negative correlations.
Figure 7.
A comparison of the medians of change in fold change between different normalizations in group A2. The areas of the points are proportional to the number of observations in each bin.
Figure 8.
A comparison of the medians of change in correlations between different normalizations in group A2. The areas of the points are proportional to the number of observations in each bin.
DISCUSSION
In this article, we have demonstrated that probes containing G-stacks can bias the normalized expression levels in the HG_U133A Affymetrix GeneChip.
We see a complex pattern of bias for normalized expression levels and evidence of significant effects in fold change estimates, for probe sets with two or more probes, which indicates that the reported fold change will be biased for the probe sets with G-stacks in them. We found no evidence of a systematic shift when we performed a differential expression analysis with ANOVA (data not shown). However, fold changes are still typically used as a filter in determining differentially expressed genes from microarrays. In studies of psychiatric disorders in post-mortem brain tissues, fold changes have a significantly reduced range (less than two) so biases such as this are significant (29,30). As 14% of the probe sets in the HG_U1333A GeneChip have two or more G-stack probes the cumulative effect could well be significant for other experiments.
Changes in the correlation become very noticeable for probe sets with two or more G-stack probes among them. The tendency is for correlations between probe sets with G-stacks in them to be over-estimated and the effect is at a maximum for correlations in the range of 0.4–0.7. Although the average correlation in the A2 group is strongly positive, ∼1% of correlations are less than −0.75 (this compares with ∼8% having correlations greater than 0.75). Extreme correlations are likely to reflect chance variations in probe values and removal of probes leads, in both cases, to a reduction in correlation magnitude (an effect akin to regression towards the mean). A possible source of bias in A2 may be that the affected probe sets are more functionally related to each other than a random collection of probe sets. To this end, we computed the probability of over-representation for all relevant GO terms (31) for the BP and MF ontologies for A2 and B2. Using the Kolmogorov–Smirnov test, we found significantly over-represented GO terms in BP and MF had similar distributions in A2 and B2, indicating that this possible bias is not significant.
The cumulative bias in other data sets for clustering in particular could again be significant, not only for individual experiments but for analyses based on multiple experiments such as the web service GOBO, which use a subset of HG_U1333A data sets relevant to breast cancer (32).
The RMA normalization procedure can have unexpected effects as it explicitly uses information about levels from probes that do not belong to the same probe set to generate the final summarized expression level for a given probe set. We have already noted that while the G = 1 fold change in Figure 3 exhibits little bias, the G = 0 fold change exhibits a small bias in the opposite direction to the fold change for G = 2 and G ≥ 3. Naively, one would expect no bias (or variation) occuring for the G = 0 data. This is consistent with an interpretation that the RMA normalization (probably at the background correction step as it attempts to model all of the probe data for each individual CEL file as the sum of a noise-based distribution and a signal-based distribution and hence subtract the estimated noise) effectively removes the bias for the G = 1 probe sets but cannot compensate for the bias for probe sets where G > 1. This has the side effect that a small bias in the opposite direction is introduced for the much larger group of G = 0 probe sets. Likewise, one would expect the group A2 plots in Figures 2 and 4 to be the same as the G = 2 subplots in Figures 3 and 5, respectively. However, in the two cases the normalization is different (i.e. either removing a subset of G-stack probes or all of them) which is sufficient to introduce small differences between them.
By repeating the analysis on a small subset of experiments we have estimated that ∼15% of the HG_U133A data sets submitted to GEO are susceptible to significant G-stack bias. This is predicated on the mild assumption that the average G-stack probe correlation is a reasonable proxy.
From comparisons with other normalizations it is apparent that the commonly employed normalizations (MAS5, RMA and gcRMA) are all susceptible to bias from G-stacks. On the other hand, less well-known normalizations such as FARMS and PLIER, which are not necessarily tuned to eliminate G-stacks, can ameliorate the bias due to G-stacks. This suggests that an appropriately modified normalization could minimize the G-stack bias without having to necessarily mask the G-stacks probes. Nonetheless, for those data sets where the G-stack probes are introducing a substantial bias, simply eliminating these probes from the normalization procedure can circumvent such biases, with the quid pro quo being an increase in the overall noise.
While we have focussed on one type of GeneChip, from other studies G-stack probes on other types of GeneChip for a range of mammals also exhibit anomalously high correlations (9) and hence it is likely that they will exhibit a bias in the normalized data as well. We have concentrated on probes with runs of exactly four guanines but it is clear that the effect will also occur for probes with runs of five or more guanines as well. Finally, other effects such as blurring (33) or hybridization of very homologous transcripts will also affect the normalized data.
Given the range of this type of data now publicly available it seems clear that a substantial re-analysis of these data sets should be carried out to determine the effect of G-stacks and outliers in general.
SUPPLEMENTARY DATA
Supplementary Data are available at NAR Online: Supplementary Methods, Supplementary Figures S1–S3.
FUNDING
University of Sindh (NO.SU/PLAN/F.SCH/611 to F.N.M. in part) Funding for open access charge: Paid for by hosting universities.
Conflict of interest statement. None declared.
Supplementary Material
ACKNOWLEDGEMENTS
The authors would like to express their thanks to Sepp Hochreiter, Ulrich Bodenhofer, Noura Chelbat and Djork-Arné Clevert for useful discussions on the FARMS normalization pipeline.
REFERENCES
- 1.Stalteri M, Harrison A. Interpretation of multiple probe sets mapping to the same gene in Affymetrix GeneChips. BMC Bioinformatics. 2007;8:13. doi: 10.1186/1471-2105-8-13. [DOI] [PMC free article] [PubMed] [Google Scholar]
- 2.Memon F, Owen A, Sanchez-Graillet O, Upton G, Harrison A. Identifying the impact of G-Quadruplexes on Affymetrix 3' Arrays using Cloud Computing. J. Integ. Bioinform. 2010;7:111. doi: 10.2390/biecoll-jib-2010-111. [DOI] [PubMed] [Google Scholar]
- 3.Irizarry R, Bolstad B, Collin F, Cope L, Hobbs B, Speed T. Summaries of Affymetrix GeneChip probe level data. Nucleic Acids Res. 2003;31:e15. doi: 10.1093/nar/gng015. [DOI] [PMC free article] [PubMed] [Google Scholar]
- 4.Irizarry R, Wu Z, Jaffee H. Comparison of Affymetrix GeneChip expression measures. Bioinformatics. 2006;22:789. doi: 10.1093/bioinformatics/btk046. [DOI] [PubMed] [Google Scholar]
- 5.Geller S, Gregg J, Hagerman P, Rocke D. Transformation and normalization of oligonucleotide microarray data. Bioinformatics. 2003;19:1817. doi: 10.1093/bioinformatics/btg245. [DOI] [PubMed] [Google Scholar]
- 6.Do J, Choi D. Normalization of microarray data: single-labeled and dual-labeled arrays. Mol. Cell. 2006;22:254. [PubMed] [Google Scholar]
- 7.Wu C, Zhao H, Baggerly K, Carta R, Zhang L. Short oligonucleotide probes containing G-stacks display abnormal binding affinity on Affymetrix microarrays. Bioinformatics. 2007;23:2566. doi: 10.1093/bioinformatics/btm271. [DOI] [PubMed] [Google Scholar]
- 8.Upton G, Langdon W, Harrison A. G-spots cause incorrect expression measurement in Affymetrix microarrays. BMC Genomics. 2008;9:613. doi: 10.1186/1471-2164-9-613. [DOI] [PMC free article] [PubMed] [Google Scholar]
- 9.Memon FN, Upton GJG, Harrison AP. A comparative study of the impact of G-Stack probes on various Affymetrix GeneChips of Mammalia. J. Nucleic Acids. 2010;2010:489736. doi: 10.4061/2010/489736. [DOI] [PMC free article] [PubMed] [Google Scholar]
- 10.Walton SP, Mindrinosa MN, Davis RW. Analysis of hybridization on the molecular barcode GeneChip microarray. Biochem. Biophy. Res. Commun. 2006;348:689–696. doi: 10.1016/j.bbrc.2006.07.108. [DOI] [PubMed] [Google Scholar]
- 11.Burge S, Parkinson GN, Hazel P, Todd AK, Neidle S. Quadruplex DNA: sequence, topology and structure. Nucleic Acids Res. 2006;34:5402–5415. doi: 10.1093/nar/gkl655. [DOI] [PMC free article] [PubMed] [Google Scholar]
- 12.Gellert M. Helix formation by guanylic acid. Proc. Natl Acad. Sci. USA. 1962;48:2013–2018. doi: 10.1073/pnas.48.12.2013. [DOI] [PMC free article] [PubMed] [Google Scholar]
- 13.Sen D, Gilbert W. Formation of parallel four-stranded complexes by guanine-rich motifs in DNA and its implications for meiosis. Nature. 1988;334:364–366. doi: 10.1038/334364a0. [DOI] [PubMed] [Google Scholar]
- 14.Langdon W, Upton G, Harrison A. Probes containing runs of guanines provide insights into the biophysics and bioinformatics of Affymetrix GeneChips. Briefings in Bioinformatics. 2009;10:259–277. doi: 10.1093/bib/bbp018. [DOI] [PubMed] [Google Scholar]
- 15.Li C, Wong WH. Model-based analysis of oligonucleotide arrays: expression index computation and outlier detection. Proc. Natl Acad. Sci. USA. 2001;98:31–36. doi: 10.1073/pnas.011404098. [DOI] [PMC free article] [PubMed] [Google Scholar]
- 16.Bolstad BM, Irizarry RA, Speed TP. A comparison of normalization methods for high density oligonucleotide array data based on variance and bias. Bioinformatics. 2003;19:185–193. doi: 10.1093/bioinformatics/19.2.185. [DOI] [PubMed] [Google Scholar]
- 17.Naef F, Magnasco M. Solving the riddle of the bright mismatches: labeling and effective binding in oligonucleotide arrays. Phy. Rev. E. 2003;68:011906. doi: 10.1103/PhysRevE.68.011906. [DOI] [PubMed] [Google Scholar]
- 18.Giorgi FM, Bolger AM, Lohse M, Usadel B. Algorithm-driven artifacts in median polish summarization of microarray data. BMC Bioinformatics. 2010;11:553. doi: 10.1186/1471-2105-11-553. [DOI] [PMC free article] [PubMed] [Google Scholar]
- 19.Hubbell E, Liu W-M, Mei R. Robust estimators for expression analysis. Bioinformatics. 2002;18:1585–1592. doi: 10.1093/bioinformatics/18.12.1585. [DOI] [PubMed] [Google Scholar]
- 20.Hochreiter S, Clevert D-A, Obermayer K. A new summarization method for Affymetrix probe level data. Bioinformatics. 2006;22:943–949. doi: 10.1093/bioinformatics/btl033. [DOI] [PubMed] [Google Scholar]
- 21.Barrett T, Troup DB, Wilhite SE, Ledoux P, Rudnev D, Evangelista C, Kim IF, Soboleva A, Tomashevsky M, Edgar R. NCBI GEO: mining tens of millions of expression profiles–database and tools update. Nucleic Acids Res. 2006;35(Database issue):D760–D765. doi: 10.1093/nar/gkl887. [DOI] [PMC free article] [PubMed] [Google Scholar]
- 22.Kittleson MM, Minhas KM, Irizarry RA, Ye SQ, Edness G, Breton E, Conte JV, Tomaselli G, Garcia JGN, Hare JM. Gene expression analysis of ischemic and nonischemic cardiomyopathy: shared and distinct genes in the development of heart failure. Physiol. Genomics. 2005;21:299–307. doi: 10.1152/physiolgenomics.00255.2004. [DOI] [PubMed] [Google Scholar]
- 23.Hammond JP, Broadley MR, Craigon DJ, Higgins J, Emmerson ZF, Townsend HJ, White PJ, May ST. Using genomic DNA-based probe-selection to improve the sensitivity of high-density oligonucleotide arrays when applied to heterologous species. Plant Methods. 2005;1:10. doi: 10.1186/1746-4811-1-10. [DOI] [PMC free article] [PubMed] [Google Scholar]
- 24.Cambon AC, Khalyfa A, Cooper NGF, Thompson CM. Analysis of probe level patterns in Affymetrix microarray data. BMC Bioinformatics. 2007;8:146. doi: 10.1186/1471-2105-8-146. [DOI] [PMC free article] [PubMed] [Google Scholar]
- 25.Dudoit S, Yang Y, Callow M, Speed T. Statistical methods for identifying differentially expressed genes in replicated cDNA microarray experiments. Statistica Sinica. 2002;12:111–139. [Google Scholar]
- 26.Patterson TA, Lobenhofer EK, Fulmer-Smentek SB, Collins PJ, Chu TM, Bao W, Fang H, Kawasaki ES, Hager J, Tikhonova IR, et al. Performance comparison of one-color and two-color platforms within the Microarray Quality Control (MAQC) project. Nat. Biotechnol. 2006;24:1140–1150. doi: 10.1038/nbt1242. [DOI] [PubMed] [Google Scholar]
- 27.Eisen MB, Spellman PT, Brown PO, Botstein D. Cluster analysis and display of genome-wide expression patterns. Proc. Natl Acad. Sci. USA. 1998;95:14863–14868. doi: 10.1073/pnas.95.25.14863. [DOI] [PMC free article] [PubMed] [Google Scholar]
- 28.Altman R. Whole-genome expression analysis: challenges beyond clustering. Current Opin. Struct. Biol. 2001;11:340–347. doi: 10.1016/s0959-440x(00)00212-8. [DOI] [PubMed] [Google Scholar]
- 29.Iwamoto K, Kakiuchi C, Bundo M, Ikeda K, Kato T. Molecular characterization of bipolar disorder by comparing gene expression profiles of postmortem brains of major mental disorders. Mol. Psy. 2004;9:406–416. doi: 10.1038/sj.mp.4001437. [DOI] [PubMed] [Google Scholar]
- 30.Ryan MM, Lockstone HE, Huffaker SJ, Wayland MT, Webster MJ, Bahn S. Gene expression analysis of bipolar disorder reveals downregulation of the ubiquitin cycle and alterations in synaptic genes. Mol. Psychiatr. 2006;11:965–978. doi: 10.1038/sj.mp.4001875. [DOI] [PubMed] [Google Scholar]
- 31.Harris M, Clark J, Ireland A, Lomax J, Ashburner M, Foulger R, Eilbeck K, Lewis S, Marshall B, Mungall C, et al. The Gene Ontology (GO) database and informatics resource. Nucleic Acids Res. 2004;32:D258–D261. doi: 10.1093/nar/gkh036. [DOI] [PMC free article] [PubMed] [Google Scholar]
- 32.Ringnér M, Fredlund E, Häkkinen J, Borg A, Staaf J. GOBO: Gene Expression-Based Outcome for Breast Cancer Online. PLoS ONE. 2011;6:e17911. doi: 10.1371/journal.pone.0017911. [DOI] [PMC free article] [PubMed] [Google Scholar]
- 33.Upton G, Sanchez-Graillet O, Rowsell J, Arteaga-Salas J, Graham N, Stalteri M, Memon F, May S, Harrison A. On the causes of outliers in Affymetrix GeneChip data. Briefings Funct. Genom. Proteom. 2009;8:199. doi: 10.1093/bfgp/elp027. [DOI] [PubMed] [Google Scholar]
Associated Data
This section collects any data citations, data availability statements, or supplementary materials included in this article.


