


Abstract
For efficient DNA cleavage, the Type III restriction endonuclease EcoP15I communicates with two inversely oriented recognition sites in an ATP-dependent process. EcoP15I consists of methylation (Mod) and restriction (Res) subunits forming a multifunctional enzyme complex able to methylate or to cleave DNA. In this study, we determined by different analytical methods that EcoP15I contains a single Res subunit in a Mod2Res stoichiometry. The Res subunit comprises a translocase (Tr) domain carrying functional motifs of superfamily 2 helicases and an endonuclease domain with a PD..D/EXK motif. We show that the isolated Tr domain retains ATP-hydrolyzing activity and binds single- and double-stranded DNA in a sequence-independent manner. To localize the regions of DNA binding, we screened peptide arrays representing the entire Res sequence for their ability to interact with DNA. We discovered four DNA-binding regions in the Tr domain and two DNA-binding regions in the endonuclease domain. Modelling of the Tr domain shows that these multiple DNA-binding regions are located on the surface, free to interact with DNA. Interestingly, the positions of the DNA-binding regions are conserved among other Type III restriction endonucleases.
INTRODUCTION
Type III restriction endonucleases (REase) are composed of two different subunits: Mod, which recognizes and methylates DNA, and Res, which facilitates enzyme movement on the DNA, and catalyses ATP hydrolysis and DNA restriction. The Mod subunit can occur as a homodimer working as DNA methyltransferase (MTase) (1,2). The stoichiometry of the REase EcoP15I was earlier determined as Mod2Res2 (3).
Type III REase EcoP15I recognizes the asymmetric nucleotide sequence 5′ CAGCAG and needs two recognition sites in head-to-head orientation to cut DNA efficiently (4). These sites can be several thousands of base pairs apart and under standard conditions cleavage occurs 24–28 bp in 3′-direction from one of them (3,5,6). However, very conflicting data exist about the movement of EcoP15I between remote DNA sites. DNA cleavage needs the communication of two EcoP15I molecules which have bound their recognition sequences. To elucidate how they find each other, models were suggested involving DNA translocation (7), passively by diffusion formed DNA loops followed by limited DNA translocation (8,9) or 1D diffusion along the DNA between both recognition sites (10–13). Regardless of the nature of EcoP15I movement, blocking of DNA restriction by Lac repressor or Escherichia coli HU protein bound between the two recognition sites underlines the crucial role of physical contact between EcoP15I enzymes interacting with each other before DNA cleavage (13,14).
Results obtained from limited proteolysis experiments and mass spectrometry showed that the Res subunit of EcoP15I is comprised of two stable domains connected by a flexible linker (5). According to these experiments, the N-terminal part (amino acids 40–705) of EcoP15I Res subunit appears to be the motor or translocase domain (Tr) containing conserved helicase motifs, whereas the C-terminal part (amino acids 729–966) is the endonuclease domain (E) carrying the active site responsible for DNA cleavage. Sequence alignments revealed that the Res subunit of Type III restriction enzymes as well as DNA and RNA helicases share a number of common motifs mainly responsible for ATP binding and hydrolysis. Therefore, Type III restriction enzymes were included in the T3R family of superfamily 2 (SF2) helicases (15–19).
In this work, we re-examined the subunit composition of EcoP15I REase and present strong evidence for a heterotrimeric Mod2Res stoichiometry. While sequence-specific DNA recognition of EcoP15I REase is known to occur via the two Mod subunits, biochemical characteristics of the Res subunit have not been thoroughly studied. We focused on the biochemical analysis of the Tr domain of EcoP15I Res subunit. Therefore, we isolated the Tr domain and examined it for its ability to hydrolyse ATP and to bind DNA. Finally, using an array with 20-mer peptides representing the amino acid sequence of the entire Res subunit, we localized several regions in both domains of the Res subunit able to bind DNA non-specifically. These regions are intermingled with the predicted conserved helicase motifs and their positions show conservation in other Type III Res subunits from the REBASE database (20). Modelling of the Tr domain using the partial structure of the Type I REase EcoR124I (21) shows that the DNA-binding regions are positioned on its surface.
MATERIALS AND METHODS
Reagents
Type II restriction enzymes, T4 polynucleotide kinase, T4 ligase were obtained from New England Biolabs. Phusion Hot Start polymerase was purchased from Finnzyme, Prestained Protein Molecular Weight Marker from Fermentas and sinefungin from Sigma-Aldrich. [γ-32P] ATP and [α-32P] ATP were purchased from Hartmann Analytic GmbH. Synthetic oligonucleotides were supplied by Sigma-Aldrich or by BioTez Berlin-Buch GmbH.
Purification of EcoP15I wild-type
EcoP15I was expressed using pQEP15 that encodes the EcoP15I operon providing an untagged Mod subunit and a C-terminally His6-tagged Res subunit. Purification was carried out as described previously except that we up-scaled the bacterial culture to 500 ml (22). Purest fractions from a heparin sepharose column (∼4 mg EcoP15I) were pooled and concentrated to give a final volume of 0.5 ml using Vivaspin 500 (Sartorius Stedim Biotech GmbH, Göttingen). In addition, the protein was purified using size exclusion chromatography on Superdex 200 column (GE Healthcare) equilibrated with 20 mM HEPES–NaOH pH 8.0, 200 mM NaCl, 1 mM EDTA, 1 mM 2-mercaptoethanol. The concentrate was loaded on two connected Superdex 200 10/300 columns (48 ml) and EcoP15I was eluted with the equilibration buffer at a flow rate of 0.4 ml/min in 0.5 ml fractions. Central fractions of the two main peaks were pooled, concentrated to 0.5 ml (peak 1: 0.8 mg; peak 2: 1 mg) and size exclusion chromatography was repeated. To obtain appropriate EcoP15I amounts necessary for our analyses, this procedure was performed several times. For determination of the EcoP15I subunit stoichiometry by densitometry, 2 µg from the fractions representing peaks 1 and 2, respectively, were analysed by electrophoresis on a 10% SDS–polyacrylamide gel and stained with SERVA Blue G (SERVA, Heidelberg). Protein bands were digitally recorded on CCD camera Bio Doc Analyser (Biometra GmbH, Göttingen). Images were taken without editing and ensuring a linear intensity scale. Staining intensity of the Mod and Res subunit was quantified using Phoretix 1D (Phoretix International, Newcastle) and relative protein mass was calculated assuming a linear relation between staining intensity and protein mass. According to the sequence of our expression plasmid, theoretical molar masses of ∼74.4 and 112 kg/mol for the Mod and the Res subunit, respectively, were calculated.
Cloning and over-expression of the EcoP15I Tr enzyme variant (amino acids 1–705)
The EcoP15I Tr enzyme variant was constructed using pQEP15 plasmid DNA (22), carrying the DNA sequence coding for the EcoP15I wt enzyme as template, and primers P15-H-fw 5′ pAGATCTCATCACCATCACCATC and P15-H-rev 5′ pTCGTTCTGTTTCTTCGAGCATGA. After the PCR reaction, the DNA product was ligated to form circular plasmids and after sequencing, digested with FspI. The FspI-derived DNA fragment was excised, gel-purified and ligated to the FspI-cleaved pQEP15 vector. Finally, the construct was verified by DNA-sequencing. The Tr domain mutant was purified from E. coli JM109 cells transformed with the respective recombinant DNA clone (in the presence of Mod). Cells were grown in 4 l of LB medium containing ampicillin (100 µg/ml) at 37°C until OD600 of 0.5. After induction with 0.1 mM IPTG, cells were incubated at 18°C for 16 h. Harvested cells were resuspended in sonication buffer (50 mM NaH2PO4 pH 8.0; 2 M NaCl; 20 mM 2-mercaptoethanol) with addition of protease inhibitor (Roche) and disrupted by sonication on ice. The lysate was centrifuged twice at 14 000g for 30 min. The supernatant was incubated on ice with 1 ml Ni–NTA beads (Qiagen) for 1 h and placed in polypropylene columns. The column was washed twice with 10 ml sonication buffer, and then successively with 10 ml wash buffer (50 mM NaH2PO4 pH 6.0; 2 M NaCl; 10% glycerol; 20 mM 2-mercaptoethanol; 0.1% Triton X-100) and 10 ml wash buffer including 30 mM imidazole. Protein was eluted from the column in 0.75 ml fractions with washing buffer containing 110 mM imidazole. Fractions with the highest enzyme concentrations were pooled and dialysed for 4 h against buffer A (20 mM Tris–HCl pH 7.4, 1 mM EDTA, 7 mM 2-mercaptoethanol) containing 200 mM NaCl. Protein was loaded onto a heparin agarose column (GE Healthcare), which had been previously equilibrated with buffer A, and eluted by a 0–1 M NaCl gradient in 0.5 ml fractions. In addition, proteins were purified using size exclusion chromatography on Superdex 200 column (GE Healthcare). Proteins were dialysed against buffer containing 20 mM Tris–HCl pH 7.6, 400 mM NaCl, 1 mM EDTA, 7 mM 2-mercaptoethanol, 50% glycerol and stored at −20°C.
Cloning and over-expression of the EcoP15I MTase
A plasmid expressing EcoP15I MTase was constructed using the pMT15 plasmid DNA, carrying the DNA sequence of the wild-type EcoP15I enzyme as template (14) and primers 5-Mod2-EcoP15 5′pGGCCCGGATCCAAAAAAGAAACGATTTTTTC and 3-Mod-EcoP15 5′pCGCGCGGATCCGTTCCTCACCACCAAATCTAA. After the PCR reaction, the gel purified DNA product was cleaved with BamHI and ligated with the BamHI/BglII digested pQE-16 vector (Qiagen). E. coli JM109 cells were transformed with the EcoP15I-mod DNA-construct that had been sequenced before. EcoP15I-MTase was over-expressed as previously described for the EcoP15I wild-type enzyme (22). The purification follows the protocol for the Tr mutant, except that the protein pool after the Ni–NTA column was dialysed over night against buffer A containing 100 mM NaCl, then diluted 1:2 with buffer A (without NaCl) and loaded onto a heparin agarose column. This C-terminally His-tagged version of the MTase has a molar mass of 75.4 kg/mol.
Second-derivative UV absorption spectroscopy
Experiments were performed in a Jasco V-560 UV-VIS spectrophotometer equipped with a double monochromator at 2.0-nm bandwidth and using a scanning speed of 10 nm/min and a data pitch of 0.2 nm. After baseline measurement with the corresponding solvent, the Suprasil ultra-micro cuvette (Hellma, Germany) was cleaned and dried and an absorbance spectrum of 120 µl sample was recorded. In order to denature the enzyme, a 1.75 µM solution of EcoP15I was incubated with 6 M GuaHCl for 1 h at room temperature prior to analysis. As model compounds for the aromatic amino acids 0.654 mM N-acetyl-tyrosine ethyl ester in 55% methanol, 4.62 mM N-acetyl-phenylalanine ethyl ester in 6 M GuaHCl and 0.124 mM Melittin (a peptide from bee venom containing one tryptophan residue as the only aromatic amino acid) in 6 M GuaHCl were used according to the method of Levine and Federici (23). Second-derivatives of the absorbance spectra were calculated by the Spectra Analysis software delivered with the photometer. Multi-component analysis was performed by fitting a linear combination of the three model compound spectra to the second-derivative spectrum of EcoP15I by minimizing the quadratic deviation between measured and calculated spectra with the solver function of Microsoft Excel.
Analytical ultracentrifugation of EcoP15I REase and EcoP15I MTase
Sedimentation velocity experiments were carried out in a Beckman Coulter ProteomeLab XL-I analytical ultracentrifuge at 20°C and 23 000–40 000 rpm in 3 or 12 mm double sector centerpieces filled with 100 or 400 µl, respectively. The data were analysed using the SEDFIT program package providing a model for diffusion corrected differential sedimentation coefficient distributions [c(s) distributions] (24). Experimental s-values were corrected to s20,W using the partial specific volumes calculated from the amino acid composition (25). Sedimentation equilibrium experiments were performed in a Beckman Optima XL-A analytical ultracentrifuge at 4°C in standard 3- or 12-mm double sector centerpieces filled with 40 or 150 µl sample, respectively. The samples were spun at 4000, 6000, 9000 and 12 000 rpm until no change in the concentration gradients could be observed for at least 12 h. Scans of the last 12 h were averaged and molar masses were determined using the BPCFIT software as described in (26). Baseline offset was set to the buffer absorbance measured in each cell near the meniscus after sedimenting the protein for 8 h at 44 000 rpm at the end of the experiment. Analytical ultracentrifugation experiments were performed in a buffer containing 20 mM HEPES–NaOH pH 8.0, 200 mM NaCl, 1 mM EDTA, 1 mM 2-mercaptoethanol and absorbance was detected at 280 nm. At lower protein concentrations (≤0.4 µM), when absorbance had to be measured at 230 nm, 20 mM Tris–HCl pH 8.0, 200 mM NaCl, 0.1 mM 2-mercaptoethanol was used. All experiments were carried out in An-50 Ti rotors. Protein concentrations were determined spectrophotometrically using the absorption coefficients at 280 nm calculated from the amino acid composition (27).
Determination of EcoP15I specific activity
Restriction activity of EcoP15I was tested by incubation of 300 ng HindIII-linearized pUC19 DNA (0.51 pmol EcoP15I recognition sites) in Lac buffer [10 mM Tris–HCl pH 8.0, 10 mM Mg(OAc)2, 10 mM KCl, 0.1 mM EDTA, 0.1 mM DTT, 5 µg/ml bovine serum albumin] and in the presence of 2 mM ATP and with increasing enzyme amounts at 37°C for 1 h in a total volume of 20 µl. The smallest EcoP15I amount yielding maximum DNA cleavage was used to calculate the enzyme units per mg protein following the definition that one unit is the amount of enzyme cleaving 1 µg DNA in 50 µl in 1 h at 37°C.
Assays for EcoP15I ATPase activity
The Tr variant or EcoP15I wt (1 pmol) was incubated with the amount of DNA representing 1.33 pmol EcoP15I recognition sites in a total volume of 10 µl, containing Lac buffer, 100 µM ATP and 33 nM [α-32P] ATP at 37°C. The reaction was stopped after 5, 10, 15, 30, or 60 min by addition of EDTA to a final concentration of 50 mM. Reaction products were analysed by thin-layer chromatography on PEI cellulose (Merck) in 0.375 M potassium phosphate (pH 3.5). The ATPase activity was quantified by determining the conversion of ATP to ADP using a PhosphoImager SI and ImageQuant software (Molecular Dynamics).
Electrophoretic mobility shift assay and KD(app) value determination
HPLC-purified oligonucleotides (60-mer) were purchased from BioTez Berlin-Buch GmbH (for nucleotide sequence see Supplementary Figure S5). DNA was radioactively labelled at its 5′-end using [γ-32P] ATP and T4 polynucleotide kinase. DNA (0.05 pmol) carrying one or no EcoP15I recognition site was incubated for 10 min at room temperature in a reaction volume of 10 µl containing 10 mM Tris–HCl pH 8.5, 100 mM NaCl, 5 mM CaCl2, 0.1 mg/ml BSA, 1 mM ATP, 10 µM sinefungin and 10% glycerol with increasing concentrations of enzyme. Samples were subsequently analysed by 4% native polyacrylamide gel electrophoresis in 1× TBE containing 5 mM CaCl2 at 4°C. The same CaCl2 concentration was present in the gel. Results were visualized by phosphoimaging and processed using ImageQuant software (Molecular Dynamics). KD(app) values were calculated by determining the enzyme concentration at which 50% of total amount of DNA was bound by the protein. KD(app) values were determined according to Carey (1991) calculating the decrease of substrate DNA (28).
Peptide array experiments
For testing DNA binding by EcoP15I Res subunit peptides, we used the following synthetic oligonucleotides: KW30-1, 5′-CGTAATCGTACCCAGCAGATATCGGTACCG-3′ as ssDNA, KW30-1c, 5′-CGGTACCGATATCTGCTGGGTACGATTACG-3′, which together with KW30-1 formed specific dsDNA (the EcoP15I recognition sequence is underlined), and KW30-0, 5′-CGTAATCGTACCGAACCGATATCGGTACCG-3′ with KW30-0c, 5′-CGGTACCGATATCGGTTCGGTACGATTACG-3′, as non-specific dsDNA. The oligonucleotides were 5′ labelled with [γ-32P] ATP using T4 polynucleotide kinase and purified by size exclusion chromatography on Probequant columns (GE Healthcare). The cellulose membranes with bound peptides were obtained from JPT Peptide Technologies GmbH. They were activated by rinsing the membrane with methanol for 5 min and then pre-incubated for 1 h in 100 mM maleic acid, 150 mM NaCl, 1% blocking reagent (Roche), pH 7.5, followed by three washing steps in EcoP15I-binding buffer (10 mM Tris–HCl, pH 8.5, 100 mM NaCl, 10 mM MgCl2) for 10 min. The membrane was incubated with 50 pmol of 5′ [γ-32P]-labelled 30-mer DNA in a total volume of 10 ml EcoP15I-binding buffer. After two washes in 10 ml EcoP15I-binding buffer, the membrane was air-dried and exposed to a phosphorimager screen. The amount of radioactivity bound to each spot was quantified using Phosphorimager SI and ImageQuant software (Molecular Dynamics). Quantification of DNA binding included determination of the signal-to-noise ratio for each peptide spot determined by dividing the spot signal value by the signal average. The signal average was calculated by dividing the sum of all signal values on the membrane by the total number of peptide spots. We considered the spots reactive when the signal-to-noise ratio was >2. To compare the data from different experiments, serial dilutions of a [14C] standard were included. Peptide spots were stripped of bound radioactive oligonucleotides by extensive washing in 1 M K2HPO4, pH 8.0.
RESULTS
Size exclusion chromatography of REase EcoP15I
The EcoP15I stoichiometry had been determined earlier to be a stable Mod2Res2 hetero-tetramer (3). It has been claimed recently, however, that in order to clarify the role of ATP hydrolysis in the mode of action of Type III restriction enzymes, the subunit stoichiometry has to be confirmed (29). To determine the subunit composition of EcoP15I we co-expressed its Mod and Res subunits in E. coli and purified the enzyme by Ni–NTA agarose (binding His-tagged Res subunit) and heparin sepharose chromatography. Densitometric analysis of Coomassie-stained SDS–PAGE revealed that our protein preparation contained <1% of contaminating proteins. The presence of aggregates or a moderate excess of free subunits, however, cannot be ruled out by this method. Therefore, and since it has been reported that over-expression and purification of the Type III restriction enzyme PstII resulted in a heterogeneous mixture containing one of the subunits in excess (30), we added size exclusion chromatography on Superdex 200 to the purification scheme. Figure 1A shows that EcoP15I eluted in two peaks. To separate proteins of both peaks, the central fractions in each case were run again on Superdex 200. Protein fractions from the dashed area (Figure 1B) were analysed on SDS–PAGE and subunits were quantified densitometrically assuming a linear relationship between protein mass and colour intensity. Whereas the ratio between Mod and Res subunit was around 1 in peak 1, it reproducibly changed to 1.8 in peak 2 (Figure1B). Determining the specific restriction activity we found that the protein corresponding to peak 2 had an ∼6-fold higher specific EcoP15I activity compared to that of peak 1 and therefore is the active EcoP15I REase which was very stable over at least a year. The catalytic superiority of the protein corresponding to peak 2 over the protein in peak 1 could be confirmed by investigating their cleavage activity as a function of enzyme concentration and their ATP-hydrolyzing activity (Supplementary Figures S1 and S2). From the Mod:Res ratio of 1.8 in peak 2, we assume an enzyme stoichiometry of Mod2Res. The enzyme showed cleavage specificity on substrates with different DNA recognition site constellations as expected (Supplementary Figure S3). Notably, an addition of purified EcoP15I MTase (Mod2) to fractions of peak 1 led to an increase of peak 2 (data not shown) suggesting that peak 1 corresponds to protein species trapped on the way of active enzyme assembly which are prone to form aggregates. For a comparison, we quantified the EcoP15I subunit composition of various earlier preparations expressed under control of the native promoter from the low-copy number plasmid pACYC177 without affinity tag (14) and found a Mod:Res ratio of 1.8 ± 0.15 (data not shown).
Figure 1.

Size exclusion chromatography of REase EcoP15I on Superdex-200. (A) After affinity chromatography on Ni–NTA resin and heparin sepharose, EcoP15I was run on two connected 24 ml Superdex 200 columns. (B) Central fractions of peaks 1 and 2, respectively, were collected separately, and size exclusion chromatography on Superdex 200 columns was repeated. From the separated peaks central fractions (dashed) were run on SDS–polyacrylamide gels and Mod and Res protein bands were quantified densitometrically. Molar ratios between Mod and Res subunit are mean values of 26–30 independent fractions deriving from different enzyme preparations.
Second-derivative UV spectroscopic analysis of subunit composition of EcoP15I
Inspection of the amino acid composition of the Mod and Res subunits of EcoP15I showed that the subunits differ markedly in aromatic amino acid composition (Table 1). Whereas the Tyr:Trp and Phe:Trp ratio of the Mod subunit are 4.1 and 4.4, respectively, the corresponding ratios for Res are 10.0 and 14.3. Therefore, determination of the aromatic amino acid composition of EcoP15I should give information about the Mod:Res stoichiometry of the enzyme. This can be achieved by a multicomponent analysis of a second-derivative UV absorption spectrum of the denatured protein with a linear combination of model compound spectra for the three aromatic amino acids (23). Utilization of second-derivative spectra virtually eliminates the contributions of light scattering and disulfide bond absorption, allowing for a more accurate determination of aromatic amino acid content. Absorbance spectra of EcoP15I, denatured with 6 M GuaHCl, and of the model compounds were measured and second-derivatives were calculated using the photometer software. Multicomponent analysis using least-squares fitting of a linear combination of the model compound spectra to the EcoP15I spectrum yielded a Tyr:Phe:Trp ratio of 5.5:6.9:1 (Figure 2A). This ratio is very similar to the one that can be calculated from amino acid composition of Mod2Res (Table 1). To check which Mod:Res ratios are compatible with our data, we calculated theoretical spectra of Mod2Res, Mod2Res2 and ModRes2 from the model compound spectra (Figure 2B) and fitted them to the experimental spectrum of EcoP15I. As expected from the fit where the concentrations of Tyr, Phe and Trp were varied individually (Figure 2A), best results were obtained for Mod2Res (Figure 2C). In the case of Mod2Res2 the deviation is higher but might be still within experimental error (Figure 2D). A ModRes2 stoichiometry, however, can be ruled out, since the deviation from the experimentally derived spectrum, especially ∼290 nm, where the second derivative spectra of Tyr and Trp have opposite signs (Tyr positive and Trp negative, Figure 2B), is far beyond the accuracy of the measurement (Figure 2E).
Table 1.
Aromatic amino acid composition of EcoP15I as determined by second-derivative UV spectroscopy or as calculated from amino acid sequence for different Mod:Res stoichiometries
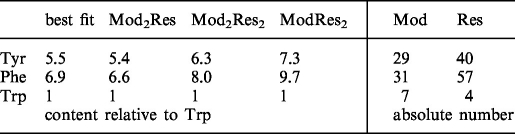 |
Figure 2.

Examination of aromatic amino acid composition of EcoP15I by second-derivative UV spectroscopy. (A) Multicomponent analysis of the second-derivative of an UV absorbance spectrum of EcoP15I in 6 M GuaHCl (solid black line) with a linear combination of second-derivative spectra of model compounds for the three aromatic amino acids. The best fit (dashed grey line) resulted in a ratio of Tyr:Phe:Trp of 5.5:6.9:1, very similar to the ratio expected for a Mod2Res stoichiometry (Table 1). (B) Second-derivative spectra of the model compounds used for the analysis shown in panel A [Melittin (solid black line), N-acetyl-tyrosine ethyl ester (dashed and dotted black line) and N-acetyl-phenylalanine ethyl ester (dashed grey line)]. From the second derivative spectra of the model compounds theoretical spectra were calculated that correspond to the aromatic amino acid composition of (C) Mod2Res, (D) Mod2Res2 and (E) ModRes2, respectively, and were fitted (dashed grey lines) to the experimental spectrum of EcoP15I (solid black line). For clarity in panels C–E only the wavelength interval most sensitive to Tyr:Trp ratio ∼290 nm is shown.
Analytical ultracentrifugation revealed a Mod2Res stoichiometry of EcoP15I
To confirm results obtained by size exclusion chromatography and spectroscopy, stoichiometry of EcoP15I was also investigated by analytical ultracentrifugation. First, sedimentation velocity experiments were carried out in a concentration range of 0.1–6.9 µM (concentrations calculated for a Mod2Res stoichiometry, Figure 3A and B). From the asymmetry of the c(s) distributions at higher protein concentrations it is obvious that more than one species is present (Figure 3A). In addition s20,W at the maximum of the c(s) distribution increased from 10.7 to 12.4 S, when the protein concentration was increased from 1.2 to 6.9 µM. This is a clear indication for a fast oligomerization reaction (31). Since buffer absorbance at 230 nm decreased the signal to noise ratio, experiments at lower protein concentrations were performed under the same salt conditions but in the absence of EDTA using 20 mM Tris–HCl pH 8.0, 200 mM NaCl and 0.1 mM 2-mercaptoethanol. In a concentration range from 0.1 to 0.4 µM EcoP15I a single symmetrical peak was obtained with s20,W = 10.3 S (Figure 3B). The diffusion broadening of a sedimenting boundary can be used to get information about the molar mass of the sedimenting species, e.g. by c(M) analysis which is implemented in the program SEDFIT (24). At a concentration of 0.2 µM EcoP15I c(M) analysis yielded a molar mass of 252 ± 19 kg/mol. This corresponds to the molar mass of a Mod2Res complex, for which a value of 261 kg/mol can be calculated from the amino acid composition. Therefore, at protein concentrations <0.4 µM, EcoP15I most probably forms heterotrimers, for which a frictional ratio of 1.4 can be calculated from the sedimentation coefficient. Since spherical hydrated proteins are expected to yield a frictional ratio of 1.1 to 1.2 (32), this observation suggests that Mod2Res has an elongated shape and/or contains disordered loops.
Figure 3.

Characterization of the oligomerization state of the REase EcoP15I and the MTase M.EcoP15I using sedimentation velocity experiments in an analytical ultracentrifuge. (A) At higher concentrations [1.2 µM (0.31 mg/ml black line), 3.3 µM (red line), 6.9 µM (light blue line)] EcoP15I yielded asymmetric c(s) distributions and s20,W increased with increasing protein concentration. (B) At lower EcoP15I concentrations [0.1 µM (0.03 mg/ml black line), 0.2 µM (red line), 0.4 µM (light blue line)] the c(s) distributions were no longer asymmetrical and a sedimentation coefficient s20,W = 10.3 S was obtained. (C) Investigation of central fractions of peak 1 obtained after twofold size exclusion chromatography (Figure 1B) at low protein concentrations [0.03 mg/ml (black line), 0.05 mg/ml (red line), 0.11 mg/ml (light blue line)]. (D) Characterization of the DNA-MTase Mod2 at 1.8 µM (black line), 4.9 µM (red line) and 12.2 µM (light blue line). A sedimentation coefficient s20,w = 6.8 S was obtained independent of the protein concentration used. Experiments in (A) and (D) were performed at 23 000 rpm and in (B) and (C) at 35 000 rpm.
Given the results above, sedimentation equilibrium experiments should allow a direct and independent determination of the molar mass of EcoP15I REase. Three different concentrations of EcoP15I were spun at four different rotor speeds, and after equilibrium was reached concentration profiles were measured at 230 or 280 nm, respectively. At the lowest protein concentration (0.2 µM), where in sedimentation velocity experiments a single species was observed, global fitting of a single exponential to the concentration profiles at all four rotor speeds yielded a molar mass of 280 ± 22 kg/mol (Figure 4A), which is consistent with the formation of Mod2Res heterotrimers. This result does not exclude that the protein exists as a ModRes2 complex, which would correspond to a molar mass of 298 kg/mol. However, this subunit composition could be ruled out by second-derivative spectroscopy (see above and Figure 2E). To exclude the possibility that the results of sedimentation equilibrium centrifugation of EcoP15I at low protein concentration are also compatible with a Mod2Res2 stoichiometry, we show that theoretical concentration gradients calculated with the molar mass set to 372 kg/mol clearly deviate systematically from the measured data (Figure 4B).
Figure 4.

Determination of REase EcoP15I subunit composition by sedimentation equilibrium centrifugation. Concentration gradients of 0.2 µM EcoP15I were measured at 4000 rpm (green), 6000 rpm (cyan), 9000 rpm (black) and 12 000 rpm (red). (A) Global fitting of the data with a model of a single species using the program package BPCfit (26) yielded a molar mass of 280 ± 22 kg/mol (solid lines) implying a Mod2Res stoichiometry. (B) Calculation of the concentrations gradients with molar mass set to 372 kg/mol (solid lines) corresponding to the molar mass of Mod2Res2. The lower panels show the difference between the calculated and the measured values as a function of radial position (residuals).
At higher protein concentrations (1.2 and 4.9 µM) analysis of the sedimentation equilibrium data using a model of a single species yielded molar masses of 320 ± 25 kg/mol and 360 ± 30 kg/mol, respectively (data not shown). This increase in apparent molar mass with increasing protein concentration is a clear indication of an oligomerization reaction and is consistent with the results of the sedimentation velocity experiments, where an increase in sedimentation coefficient with protein concentration was observed (Figure 3A). Since our EcoP15I preparation contained only a single species at low protein concentrations, which could be shown by sedimentation velocity analysis (Figure 3B), the increase in molar mass observed here could not be accompanied by a change in Mod:Res subunit ratio. Fitting of the data obtained at all four rotor speeds and at concentrations of 1.2 and 4.9 µM EcoP15I with the simplest model of a monomer/dimer equilibrium of Mod2Res yielded a dimerization constant of ∼104–105/M (data not shown). Therefore, a concentration as high as 1 mM Mod2Res would be needed to shift this equilibrium to >90% dimer and get an equivalent molar mass. Since the concentrations where functional assays were performed were considerably lower than the concentrations at which we observed protein oligomerization, this process should not contribute to EcoP15I activity.
Additionally, we used sedimentation velocity experiments to get information about the nature of the protein fraction, which we were able to separate from the most active form of EcoP15I by twofold size exclusion chromatography and which exhibited a Mod:Res stoichiometry of 1:1 (Figure 1B, peak 1). It showed a very broad distribution of sedimentation coefficients ranging from ∼5 to 20 S (Figure 3C). With increasing protein concentration (0.03–0.11 mg/ml) the c(s) distribution shifted slightly to higher values. Even if the proteins were perfectly spherical, the highest s-values observed would correspond to a molar mass of ∼500 kg/mol. Therefore, this fraction is highly inhomogeneous and contains even at low protein concentrations higher aggregates.
In contrast to the complex situation of the REase, EcoP15I MTase showed a single species sedimenting with an s20,W of 6.8 S in sedimentation velocity experiments independent of the protein concentration used (Figure 3D). Analysis of the diffusion broadening of the sedimentation boundary using the c(s) analysis in SEDFIT (24), yielded a molar mass of ∼145 kg/mol, which fits the expected mass of a EcoP15I MTase dimer of 151 kg/mol. This is consistent with the formation of Mod2 homodimers as previously observed by size exclusion chromatography (33). Interestingly, for the EcoP15I MTase dimer a frictional ratio of 1.44 can be calculated from the sedimentation coefficient. Therefore, the shape of the protein seems to deviate substantially from a sphere, which suggests an elongated shape and/or the presence of unstructured loops.
Cloning and purification of the EcoP15I Tr domain
As described earlier (34), and also in our expression construct the efficient production of EcoP15I Res subunit in E. coli was dependent on the co-expression of the Mod subunit. To unravel functions of the Res subunit in general and to test the prediction that the N-terminal Tr domain is responsible for the motor functions, we constructed a truncated form of EcoP15I comprising the complete Mod subunit and amino acids 1–705 of the Res subunit representing the Tr domain (Supplementary Figure S4A). We over-expressed and purified the C-terminally 6xHis-tagged protein complex as described in ‘Materials and Methods’ section.
During EcoP15I wt enzyme purification, we found Res always eluting together with Mod. This probably reflects a very strong protein–protein interaction between Mod and Res. In the case of the Tr domain we expected that lack of a significant part of the protein could possibly weaken the strength of this intermolecular interaction. We therefore used high salt concentrations in all buffers during purification on Ni–NTA agarose to remove the Mod subunit. The high content of Tr domain (molar mass ∼81 kg/mol) in the soluble protein fraction and the degree of protein purity after two-step purification procedure is shown in Supplementary Figure S4B. In early eluting fractions of the second purification step on heparin agarose column both Mod and Tr domain were found (Supplementary Figure S4B, lane 3). However, in later fractions only the Tr domain was present (Supplementary Figure S4B, lane 4). We obtained 6.5 mg Tr domain per litre of cell culture with a purity of ∼99%.
Notably, under the same high-salt conditions as used for the purification of the Tr domain, the Mod and the Res subunit of the full-length enzyme did not dissociate (data not shown). Therefore, separation of the Tr domain and the Mod subunit indicates that the E domain of the Res subunit, which is missing in the truncated enzyme, participates in interaction with the Mod subunit.
Mod subunit facilitates the ATP hydrolysis by Tr domain
To show that it is the Tr domain within the Res subunit that harbours the catalytic centre for ATP-hydrolysis, we incubated the purified protein in the presence and absence of the Mod subunit with [α-32P] ATP, and observed its conversion to ADP and Pi by subsequent thin layer chromatography. The data were compared with results obtained for EcoP15I wt and the rate of spontaneous [α-32P] ATP decay (Figure 5). We found that EcoP15I wt after 5 min of incubation with single-stranded M13mp18 DNA showed only about one third of its ATPase activity in comparison to double-stranded pUC19 plasmid DNA, which corresponded approximately to 60 pmol ATP/min/pmol enzyme. Hydrolysis rates obtained for the Tr domain were low for both types of DNA, but nevertheless at least three times higher than for samples without enzyme (spontaneous ATP decay). Interestingly, ATP hydrolysis by the Tr domain was increased in the presence of Mod subunit. In the case of ssDNA, the increase was high enough that the rate of ATP hydrolysis with 44 pmol ATP/min/pmol enzyme almost reached the rate obtained for EcoP15I in the presence of dsDNA. However, in the presence of dsDNA Mod-induced increase of Tr catalysed ATP hydrolysis did not exceed 13 pmol ATP/min/pmol enzyme.
Figure 5.

ATPase activity of Tr domain. Amounts of ssDNA M13mp18 with four EcoP15I recognition sites (A) or dsDNA pUC19 with three EcoP15I recognition sites (B) providing 1.33 pmol EcoP15I recognition sites (0.79 µg DNA) were incubated with 1 pmol EcoP15I (filled squares), 1 pmol Mod + Tr domain (empty squares), 1 pmol Tr domain (triangles) or without enzyme (nc, diamonds). Error bars indicate deviation from the mean of the values from two independent experiments. Lines between data points are drawn just to guide the eye.
Tr domain of EcoP15I Res subunit interacts with single- and double-stranded DNA in a sequence-independent manner
To test whether the Tr domain is able to bind to DNA, electrophoretic mobility shift assays were carried out using protein fractions only with the Tr domain as well as those with the Mod subunit in addition. We found that the Tr domain can bind to ss and dsDNA (Supplementary Figure S5). The affinity to dsDNA, regardless of the presence of an EcoP15I recognition site, is ∼2-fold stronger than to ssDNA (Table 2). Whereas the Tr domain affinity to ssDNA was the same as that of EcoP15I wt, the interaction of the Tr domain with site-containing dsDNA was ∼8-fold weaker than that of the EcoP15I wt enzyme (Table 2). Notably, the presence of Mod did not markedly alter the KD(app) values of the Tr interactions. Therefore, the endonuclease (E) domain seems to significantly contribute to the DNA-binding affinity of EcoP15I.
Table 2.
KD(app) values for DNA binding by the Tr domain and the Tr domain together with the Mod subunit in comparison with EcoP15I wt
|
KD(app) value [nM] |
|||
|---|---|---|---|
| dsDNA (one site) | dsDNA (no site) | ssDNA | |
| Tr | 128 | 93 | 268 |
| Mod + Tr | 121 | 160 | 346 |
| EcoP15I wt | 16 | 37 | 267 |
To estimate the KD(app) values, dsDNA 60-mer containing one or no EcoP15I recognition site and ssDNA 60-mer were incubated with increasing concentrations of EcoP15I wt or Tr domain without and with Mod subunit. The KD(app) values are mean values of 3–12 independent experiments.
EcoP15I Res subunit contains several extended DNA-binding regions mapped by synthetic peptide arrays
To identify the regions in the Res subunit that are in contact with DNA, we constructed synthetic membrane-bound peptide arrays representing the entire sequence of the subunit in 191 20-mer peptides overlapping by 15 amino acids (20/15) to screen them for their ability to bind DNA. Two double-stranded (with and without EcoP15I recognition site) and one single-stranded, radioactively labelled synthetic DNAs (each 30-nt long) were incubated for 1 h with the membrane in the presence of Mg2+ ions. This assay revealed a number of peptides in the Res subunit which were able to bind DNA. As the experiments with all three DNAs gave very similar results, we present only the membrane where specific dsDNA was bound (Figure 6A). Notably, we identified four distinct DNA-binding sites within the Tr domain and two additional ones within the E domain. The quantitative representation of the data for all three DNAs is shown in Figure 6B. Nearly all peptides which bound to DNA showed no preference for the type of DNA used (ds versus ss, site-containing versus non-site DNA), indicating that all those interactions are independent of the EcoP15I recognition sequence and the type of DNA.
Figure 6.

DNA binding to the Res subunit. (A) Peptide array (20/15) comprising EcoP15I Res subunit amino acid sequence in 191 20-mer peptides. Neighbouring peptides overlap by 15 amino acids. The membrane-bound peptides were incubated with radioactively labelled specific dsDNA of 30-bp length. The N-terminal and C-terminal peptides are in positions A1 and J11, respectively. (B) Quantitative representation of the radioactivity bound to the peptide array after incubation with specific dsDNA (white bars), nonspecific dsDNA (black bars) and ssDNA (grey bars).
These first experiments were performed with a single membrane, repeatedly used, after extensive stripping procedures. To avoid misinterpretation of DNA–peptide interaction resulting from normal abrasion of the membrane, we resynthesized the detected DNA-binding regions in three independent arrays of 13-mer peptides overlapping by 10 amino acids (13/10). First, this allowed us to narrow down the identified regions and, second, to use separate membranes for each type of DNA. By this method we confirmed four DNA-binding peptides in the Tr domain and two in the E domain that bound all tested DNA substrates with similar affinity (Supplementary Figure S6). Even though the detected peptides are distributed throughout the whole Res primary sequence, the most extended and strongest binding region was located C-terminally in the Tr domain between amino acids 637 and 670. All peptides within the identified DNA-binding regions contain a high number of arginine and lysine residues, which varies from 3 to even 9 out of 20. To show that their ability to bind nucleic acid is not only the result of their positive charge, we screened the array for peptides with similar numbers of these amino acids. In result, we found 10 other peptides with positively charged amino acids content on the level of 25–30%, which did not show any affinity to DNA, e.g. peptides representing amino acids 126–145 or 531–550 (Figure 6A, B6 and F7).
Support for the functional importance of the identified regions in the native enzyme individually cannot be provided by mutagenesis because of (i) multiple occurrence and extension of these regions and (ii) additional DNA-binding contribution of the Mod subunits in the holo-enzyme. Nevertheless, to get an idea of the position of these DNA interaction peptides we performed a multiple alignment of EcoP15I Res with other Type IIIA REases (Supplementary Figure S7) using ClustalW (35). Interestingly, the alignment showed that the spacing of positively charged amino acids within the DNA-binding regions follows a similar pattern in the aligned proteins. This is most remarkable for the peptide region with the strongest DNA interaction (amino acids 637–670) where a stretch of positively charged residues every two amino acids most pronounced in BceSI and StyLTI may be indicative of a β-strand with a positive surface. In addition, we included the Type I restriction subunit structure (HsdR) of EcoR124I (21) within the Tr region to this alignment because Type I enzymes share sequence motifs with Type III enzymes within their motor domains (17). The alignment was used to build a coarse structural model of the EcoP15I Tr domain including the ATP bound in the EcoR124I structure using MODELLER (36) and it was refined by energy minimization with the YASARA NOVA forcefield (37). The model building could not be extended into the E domain because we did not find any protein structure to base the model on. In contrast to the conserved functional SF2 helicase motifs located in the centre of this structural model and engaged via invariant amino acid residues in numerous contacts to the ATP, the DNA-binding regions identified by the peptide arrays are on the surface free to interact with DNA (Supplementary Figure S8).
DISCUSSION
After co-expression of Mod and Res subunits of EcoP15I in E. coli, we had to use size exclusion chromatography in addition to two steps of affinity purification in order to separate the active enzyme from higher aggregates and excess subunits. Since our purification scheme included a Ni–NTA agarose step, and only the Res subunit was His-tagged, we enriched complexes containing this subunit. Whereas densitometric analysis of SDS–PAGE revealed a Mod2Res stoichiometry of the active enzyme, the highly heterogeneous fraction which eluted earlier from size exclusion chromatography showed a Mod:Res ratio of 1:1. Addition of purified Mod2 to the latter fraction led to the formation of new active Mod2Res. In order to re-examine the subunit ratio of the active enzyme, we additionally used second-derivative UV absorption spectroscopy as well as sedimentation velocity and sedimentation equilibrium experiments in an analytical ultracentrifuge. All four independent experimental approaches yielded a Mod2Res stoichiometry. Furthermore, our second-derivative UV absorption spectroscopy analysis rules out a ModRes2 stoichiometry (Table 1 and Figure 2) while sedimentation equilibrium data were not in accordance with a Mod2Res2 composition of EcoP15I (Figure 4B). At higher concentrations the enzyme presumably dimerizes to form (Mod2Res)2, a complex expected to form on DNA immediately before cleavage. The presence of only two Res subunits in this active complex is very interesting from a mechanistic point of view, since this exactly matches the number of phosphodiester bonds to be cleaved.
Previously Janscak et al. (3) reported a Mod2Res2 stoichiometry for EcoP15I using analytical ultracentrifugation and quantitative densitometry of SDS–PAGE. Mod and Res subunits were over-expressed together in E. coli and in the purification scheme the flow-through of an anion exchange column was purified by heparin sepharose chromatography without including a consecutive size exclusion chromatography step which would allow for the removal of potential aggregates or excess subunits. Additionally, their analytical ultracentrifugation analysis was performed at enzyme concentrations, where we could show that partial oligomerization of EcoP15I takes place. These two facts might explain the higher sedimentation coefficient and higher molar mass they observed for their protein preparation.
A similar heterogeneity of enzyme species as we observed after over-expression of EcoP15I was seen for the Type III restriction enzyme PstII (30). In this case, the authors reported a significant loss of Res subunit during purification (38) and designated their preparation ‘PstII mix’ with an overall Mod to Res ratio of about 3:1. In the presence of Triton X-100 the ‘PstII mix’ eluted in size exclusion chromatography in a broad peak (30). The authors assumed a distribution of species from Mod2Res2 down to Mod2 according to apparent molecular weights deduced from the elution of standard proteins. This is in conflict with their gel densitometric analysis of the corresponding fractions which yielded Mod:Res ratios of 2:1 to 9:1, none of the fractions showed a 1:1 stoichiometry. In the light of our finding that both EcoP15I Mod2Res and Mod2 deviate significantly from the shape of a sphere, whereas the standard proteins used to calibrate a column usually do not, PstII enzyme species may be shifted to elution volumes which correspond to higher apparent molecular weights. Therefore, in the case of PstII the active species could also be Mod2Res, which would be in excellent agreement with the Mod:Res subunit ratio of 2:1 determined by gel densitometry for active PstII in the study of Sears and Szczelkun (30).
Efficient synthesis and stability of the EcoP15I Res subunit is dependent on the expression of the Mod subunit (34). For this reason, we have studied a C-terminal deletion construct of Res which we could separate from Mod2. In this study, we provide first experimental evidence that this Tr domain of the EcoP15I Res subunit directly contacts the DNA. We report that it binds single- and double-stranded DNA and that DNA binding is independent of the presence of the EcoP15I DNA recognition sequence (Supplementary Figure S5 and Table 2). This is a known feature among translocases related to their diverse in vivo functions (39,40). We succeeded in separating the Tr domain from the Mod subunit by heparin agarose chromatography probably because of weakened protein–protein interactions between EcoP15I subunits due to the missing E domain. In fact, by using synthetic peptide arrays, we were able to identify two regions in the E domain that contribute to the interface(s) with the Mod subunit (our unpublished data).
In vitro ATPase activity of the isolated Tr domain is low in the presence of single- or double-stranded specific DNA and in both cases increases when the Mod subunit is present (Figure 5), which itself has no intrinsic ATPase activity (data not shown). This clearly establishes an interaction of Mod with the Tr domain alone. Surprisingly, the stimulation of ATPase activity by Mod is more pronounced in the presence of single-stranded DNA (Figure 5A). The amount of ATP hydrolysed by the Mod–Tr complex in this process is only slightly smaller than the values reached by the complete enzyme bound to dsDNA (Figure 5B). Thus, the E domain does not only stabilize the interaction of Res with Mod2 but also enhances the preferential interaction of EcoP15I with DNA duplexes.
The KD(app) value for the interaction of the complete restriction enzyme with double-stranded DNA is ∼16-fold lower than for single-stranded DNA. In contrast, the isolated Tr domain alone exhibits only a 2-fold difference in the affinity to both DNAs (Table 2). Surprisingly, the presence of the Mod subunit does not facilitate DNA binding by the Tr domain. Such behaviour can be explained by the relatively weak affinity of Mod2 itself to site-containing oligonucleotide duplexes of ∼1–2 µM (33, our unpublished data). DNA-binding affinity increases ∼100-fold to 16 nM upon assembly with the full-length Res subunit (Table 2), most probably due to a significant conformational change of Mod2.
Peptide scans were successfully used to identify DNA-binding sites of the Type II REase EcoRII (41) that could be perfectly confirmed by the 3D crystal and co-crystal structure of the protein (42,43). Out of the four DNA-binding regions that have been discovered by us within the Tr domain of EcoP15I, none covered the sequence of predicted DNA-binding motifs Ia, IV and V (17). The two regions in the E domain showing affinity to DNA are localized between amino acids 777–798 and 931–943 on both sides of the catalytic centre responsible for DNA cleavage (Supplementary Figure S7). The identified conserved DNA-binding peptides are intermingled with the functional helicase motifs in the primary sequence although in the structural model they are at the surface of the protein domain. Unfortunately, the region with the highest DNA-binding affinity (amino acids 637–670) and the E domain could not be covered by the structural model. For the HsdR subunit of Type I REase EcoR124II a DNA-binding affinity in the range of KD = 200 nM had been estimated earlier (44). Recently, Roberts et al. (45) concluded from investigations of DNA sequence requirements for ATPase activity of the Type I REase EcoKI that the Res subunit must also contact DNA.
In conclusion, this study shows that EcoP15I is a heterotrimer consisting of two Mod and only one Res subunit. For the first time we present experimental data that the Tr domain of the EcoP15I Res subunit, which is thought to be involved in ATP-dependent enzyme movement, makes direct contacts to DNA that do not depend on the EcoP15I recognition sequence. We show that ATP-hydrolyzing activity resides in the Tr domain and that this activity is increased in the presence of the Mod subunit. The DNA-binding regions within the Res subunit, as identified by peptide arrays, represent sequences apparently conserved in Type III restriction enzymes that might aid communication between remote sites. Due to its ability to hydrolyse ATP, the Tr domain could act as a transient clamp to bind and release DNA segments. The identified DNA-binding regions at the surface of the EcoP15I Tr domain (Supplementary Figure S8) may form the necessary interface allowing an energy-efficient movement on the DNA.
SUPPLEMENTARY DATA
Supplementary Data are available at NAR Online: Supplementary Figures S1–S8.
FUNDING
European Union Marie Curie Research Training Network “DNA Enzymes” and Universitäre Forschungsförderung of Charité - Universitätsmedizin Berlin. Funding for open access charge: Charité – Universitätsmedizin Berlin.
Conflict of interest statement. None declared.
Supplementary Material
ACKNOWLEDGEMENTS
The authors thank Prof Dr Alfred Pingoud and Dr Martin Raftery for critical reading of the manuscript, Lidia Litz for excellent technical assistance and Prof Dr Claus Urbanke for valuable discussions. KHW is an Early Stage Researcher appointed by European Union Marie Curie Research Training Network ‘DNA Enzymes’.
REFERENCES
- 1.Bourniquel AA, Bickle TA. Complex restriction enzymes: NTP-driven molecular motors. Biochimie. 2002;84:1047–1059. doi: 10.1016/s0300-9084(02)00020-2. [DOI] [PubMed] [Google Scholar]
- 2.Tock MR, Dryden DT. The biology of restriction and anti-restriction. Curr. Opin. Microbiol. 2005;8:466–472. doi: 10.1016/j.mib.2005.06.003. [DOI] [PubMed] [Google Scholar]
- 3.Janscak P, Sandmeier U, Szczelkun MD, Bickle TA. Subunit assembly and mode of DNA cleavage of the type III restriction endonucleases EcoP1I and EcoP15I. J. Mol. Biol. 2001;306:417–431. doi: 10.1006/jmbi.2000.4411. [DOI] [PubMed] [Google Scholar]
- 4.Meisel A, Bickle TA, Kruger DH, Schroeder C. Type III restriction enzymes need two inversely oriented recognition sites for DNA cleavage. Nature. 1992;355:467–469. doi: 10.1038/355467a0. [DOI] [PubMed] [Google Scholar]
- 5.Wagenfuhr K, Pieper S, Mackeldanz P, Linscheid M, Kruger DH, Reuter M. Structural domains in the type III restriction endonuclease EcoP15I: characterization by limited proteolysis, mass spectrometry and insertional mutagenesis. J. Mol. Biol. 2007;366:93–102. doi: 10.1016/j.jmb.2006.10.087. [DOI] [PubMed] [Google Scholar]
- 6.Mucke M, Reich S, Moncke-Buchner E, Reuter M, Kruger DH. DNA cleavage by type III restriction-modification enzyme EcoP15I is independent of spacer distance between two head to head oriented recognition sites. J. Mol. Biol. 2001;312:687–698. doi: 10.1006/jmbi.2001.4998. [DOI] [PubMed] [Google Scholar]
- 7.Reich S, Gossl I, Reuter M, Rabe JP, Kruger DH. Scanning force microscopy of DNA translocation by the Type III restriction enzyme EcoP15I. J. Mol. Biol. 2004;341:337–343. doi: 10.1016/j.jmb.2004.06.031. [DOI] [PubMed] [Google Scholar]
- 8.Crampton N, Yokokawa M, Dryden DT, Edwardson JM, Rao DN, Takeyasu K, Yoshimura SH, Henderson RM. Fast-scan atomic force microscopy reveals that the type III restriction enzyme EcoP15I is capable of DNA translocation and looping. Proc. Natl. Acad. Sci. USA. 2007;104:12755–12760. doi: 10.1073/pnas.0700483104. [DOI] [PMC free article] [PubMed] [Google Scholar]
- 9.Crampton N, Roes S, Dryden DT, Rao DN, Edwardson JM, Henderson RM. DNA looping and translocation provide an optimal cleavage mechanism for the type III restriction enzymes. EMBO J. 2007;26:3815–3825. doi: 10.1038/sj.emboj.7601807. [DOI] [PMC free article] [PubMed] [Google Scholar]
- 10.van Aelst K, Toth J, Ramanathan SP, Schwarz FW, Seidel R, Szczelkun MD. Type III restriction enzymes cleave DNA by long-range interaction between sites in both head-to-head and tail-to-tail inverted repeat. Proc. Natl. Acad. Sci. USA. 2010;107:9123–9128. doi: 10.1073/pnas.1001637107. [DOI] [PMC free article] [PubMed] [Google Scholar]
- 11.Ramanathan SP, van Aelst K, Sears A, Peakman LJ, Diffin FM, Szczelkun MD, Seidel R. Type III restriction enzymes communicate in 1D without looping between their target sites. Proc. Natl. Acad. Sci. USA. 2009;106:1748–1753. doi: 10.1073/pnas.0807193106. [DOI] [PMC free article] [PubMed] [Google Scholar]
- 12.Szczelkun MD, Friedhoff P, Seidel R. Maintaining a sense of direction during long-range communication on DNA. Biochem. Soc. Trans. 2010;38:404–409. doi: 10.1042/BST0380404. [DOI] [PMC free article] [PubMed] [Google Scholar]
- 13.Raghavendra NK, Rao DN. Unidirectional translocation from recognition site and a necessary interaction with DNA end for cleavage by Type III restriction enzyme. Nucleic Acids Res. 2004;32:5703–5711. doi: 10.1093/nar/gkh899. [DOI] [PMC free article] [PubMed] [Google Scholar]
- 14.Meisel A, Mackeldanz P, Bickle TA, Kruger DH, Schroeder C. Type III restriction endonucleases translocate DNA in a reaction driven by recognition site-specific ATP hydrolysis. EMBO J. 1995;14:2958–2966. doi: 10.1002/j.1460-2075.1995.tb07296.x. [DOI] [PMC free article] [PubMed] [Google Scholar]
- 15.Gorbalenya AE, Koonin EV, Donchenko AP, Blinov VM. Two related superfamilies of putative helicases involved in replication, recombination, repair and expression of DNA and RNA genomes. Nucleic Acids Res. 1989;17:4713–4730. doi: 10.1093/nar/17.12.4713. [DOI] [PMC free article] [PubMed] [Google Scholar]
- 16.Gorbalenya AE, Koonin EV. Endonuclease (R) subunits of type-I and type-III restriction-modification enzymes contain a helicase-like domain. FEBS Lett. 1991;291:277–281. doi: 10.1016/0014-5793(91)81301-n. [DOI] [PubMed] [Google Scholar]
- 17.McClelland SE, Szczelkun MD. The type I and III restriction endonucleases: Structural elements in the molecular motors that process DNA. In: Pingoud A, editor. Restriction Endonucleases. Vol. 14. Berlin Heidelberg: Springer-Verlag; 2004. pp. 111–135. [Google Scholar]
- 18.Singleton MR, Wigley DB. Modularity and specialization in superfamily 1 and 2 helicases. J. Bacteriol. 2002;184:1819–1826. doi: 10.1128/JB.184.7.1819-1826.2002. [DOI] [PMC free article] [PubMed] [Google Scholar]
- 19.Fairman-Williams ME, Guenther UP, Jankowsky E. SF1 and SF2 helicases: family matters. Curr. Opin. Struct. Biol. 2010;20:313–324. doi: 10.1016/j.sbi.2010.03.011. [DOI] [PMC free article] [PubMed] [Google Scholar]
- 20.Roberts RJ, Vincze T, Posfai J, Macelis D. REBASE–a database for DNA restriction and modification: enzymes, genes and genomes. Nucleic Acids Res. 2010;38:D234–D236. doi: 10.1093/nar/gkp874. [DOI] [PMC free article] [PubMed] [Google Scholar]
- 21.Lapkouski M, Panjikar S, Janscak P, Smatanova IK, Carey J, Ettrich R, Csefalvay E. Structure of the motor subunit of type I restriction-modification complex EcoR124I. Nat. Struct. Mol. Biol. 2009;16:94–95. doi: 10.1038/nsmb.1523. [DOI] [PubMed] [Google Scholar]
- 22.Moncke-Buchner E, Mackeldanz P, Kruger DH, Reuter M. Overexpression and affinity chromatography purification of the Type III restriction endonuclease EcoP15I for use in transcriptome analysis. J. Biotechnol. 2004;114:99–106. doi: 10.1016/j.jbiotec.2004.06.014. [DOI] [PubMed] [Google Scholar]
- 23.Levine RL, Federici MM. Quantitation of aromatic residues in proteins: model compounds for second-derivative spectroscopy. Biochemistry. 1982;21:2600–2606. doi: 10.1021/bi00540a004. [DOI] [PubMed] [Google Scholar]
- 24.Schuck P. Size-distribution analysis of macromolecules by sedimentation velocity ultracentrifugation and lamm equation modeling. Biophys. J. 2000;78:1606–1619. doi: 10.1016/S0006-3495(00)76713-0. [DOI] [PMC free article] [PubMed] [Google Scholar]
- 25.Durchschlag H. Specific volumes of biological macromolecules and some other molecules of biological interest. In: Hinz H, editor. Thermodynamic Data for Biochemistry and Biotechnology. Berlin, Heidelberg: Springer; 1986. pp. 45–128. [Google Scholar]
- 26.Witte G, Urbanke C, Curth U. Single-stranded DNA-binding protein of Deinococcus radiodurans: a biophysical characterization. Nucleic Acids Res. 2005;33:1662–1670. doi: 10.1093/nar/gki310. [DOI] [PMC free article] [PubMed] [Google Scholar]
- 27.Pace CN, Vajdos F, Fee L, Grimsley G, Gray T. How to measure and predict the molar absorption coefficient of a protein. Protein Sci. 1995;4:2411–2423. doi: 10.1002/pro.5560041120. [DOI] [PMC free article] [PubMed] [Google Scholar]
- 28.Carey J. Gel retardation. Methods Enzymol. 1991;208:103–117. doi: 10.1016/0076-6879(91)08010-f. [DOI] [PubMed] [Google Scholar]
- 29.Szczelkun MD. Translocation, switching and gating: potential roles for ATP in long-range communication on DNA by Type III restriction endonucleases. Biochem. Soc. Trans. 2011;39:589–594. doi: 10.1042/BST0390589. [DOI] [PMC free article] [PubMed] [Google Scholar]
- 30.Sears A, Szczelkun MD. Subunit assembly modulates the activities of the Type III restriction-modification enzyme PstII in vitro. Nucleic Acids Res. 2005;33:4788–4796. doi: 10.1093/nar/gki788. [DOI] [PMC free article] [PubMed] [Google Scholar]
- 31.Brown PH, Balbo A, Schuck P. Characterizing protein-protein interactions by sedimentation velocity analytical ultracentrifugation. Curr. Protoc. Immunol. 2008;Chapter 18:Unit 18.15. doi: 10.1002/0471142735.im1815s81. [DOI] [PubMed] [Google Scholar]
- 32.Lebowitz J, Lewis MS, Schuck P. Modern analytical ultracentrifugation in protein science: a tutorial review. Protein Sci. 2002;11:2067–2079. doi: 10.1110/ps.0207702. [DOI] [PMC free article] [PubMed] [Google Scholar]
- 33.Ahmad I, Rao DN. Interaction of EcoP15I DNA methyltransferase with oligonucleotides containing the asymmetric sequence 5′-CAGCAG-3′. J. Mol. Biol. 1994;242:378–388. doi: 10.1006/jmbi.1994.1588. [DOI] [PubMed] [Google Scholar]
- 34.Redaschi N, Bickle TA. Posttranscriptional regulation of EcoP1I and EcoP15I restriction activity. J. Mol. Biol. 1996;257:790–803. doi: 10.1006/jmbi.1996.0202. [DOI] [PubMed] [Google Scholar]
- 35.Larkin MA, Blackshields G, Brown NP, Chenna R, McGettigan PA, McWilliam H, Valentin F, Wallace IM, Wilm A, Lopez R, et al. Clustal W and Clustal X version 2.0. Bioinformatics. 2007;23:2947–2948. doi: 10.1093/bioinformatics/btm404. [DOI] [PubMed] [Google Scholar]
- 36.Enswar N, Marti-Renom MA, Webb BMMS, Eramian DSMPUaSA. Current Protocols in Bioinformatics. John Wiley & Sons, Inc.; 2006. Comparative Protein Structure Modeling with MODELLER; pp. 5.6.1–5.6.30. [Google Scholar]
- 37.Krieger E, Koraimann G, Vriend G. Increasing the precision of comparative models with YASARA NOVA–a self-parameterizing force field. Proteins. 2002;47:393–402. doi: 10.1002/prot.10104. [DOI] [PubMed] [Google Scholar]
- 38.Sears A, Peakman LJ, Wilson GG, Szczelkun MD. Characterization of the Type III restriction endonuclease PstII from Providencia stuartii. Nucleic Acids Res. 2005;33:4775–4787. doi: 10.1093/nar/gki787. [DOI] [PMC free article] [PubMed] [Google Scholar]
- 39.Singleton MR, Dillingham MS, Wigley DB. Structure and mechanism of helicases and nucleic acid translocases. Annu. Rev. Biochem. 2007;76:23–50. doi: 10.1146/annurev.biochem.76.052305.115300. [DOI] [PubMed] [Google Scholar]
- 40.Singleton MR, Dillingham MS, Gaudier M, Kowalczykowski SC, Wigley DB. Crystal structure of RecBCD enzyme reveals a machine for processing DNA breaks. Nature. 2004;432:187–193. doi: 10.1038/nature02988. [DOI] [PubMed] [Google Scholar]
- 41.Reuter M, Schneider-Mergener J, Kupper D, Meisel A, Mackeldanz P, Kruger DH, Schroeder C. Regions of endonuclease EcoRII involved in DNA target recognition identified by membrane-bound peptide repertoires. J. Biol. Chem. 1999;274:5213–5221. doi: 10.1074/jbc.274.8.5213. [DOI] [PubMed] [Google Scholar]
- 42.Zhou XE, Wang Y, Reuter M, Mucke M, Kruger DH, Meehan EJ, Chen L. Crystal structure of type IIE restriction endonuclease EcoRII reveals an autoinhibition mechanism by a novel effector-binding fold. J. Mol. Biol. 2004;335:307–319. doi: 10.1016/j.jmb.2003.10.030. [DOI] [PubMed] [Google Scholar]
- 43.Golovenko D, Manakova E, Tamulaitiene G, Grazulis S, Siksnys V. Structural mechanisms for the 5′-CCWGG sequence recognition by the N- and C-terminal domains of EcoRII. Nucleic Acids Res. 2009;37:6613–6624. doi: 10.1093/nar/gkp699. [DOI] [PMC free article] [PubMed] [Google Scholar]
- 44.Zinkevich V, Popova L, Kryukov V, Abadjieva A, Bogdarina I, Janscak P, Firman K. The HsdR subunit of R.EcoR124II: cloning and over-expression of the gene and unexpected properties of the subunit. Nucleic Acids Res. 1997;25:503–511. doi: 10.1093/nar/25.3.503. [DOI] [PMC free article] [PubMed] [Google Scholar]
- 45.Roberts GA, Cooper LP, White JH, Su TJ, Zipprich JT, Geary P, Kennedy C, Dryden DT. An investigation of the structural requirements for ATP hydrolysis and DNA cleavage by the EcoKI Type I DNA restriction and modification enzyme. Nucleic Acids Res. 2011;39:7667–7676. doi: 10.1093/nar/gkr480. [DOI] [PMC free article] [PubMed] [Google Scholar]
Associated Data
This section collects any data citations, data availability statements, or supplementary materials included in this article.