

Abstract
E2F transcription factors are known to be important for timely activation of G1/S and G2/M genes required for cell cycle progression, but transcriptional mechanisms for deactivation of cell cycle-regulated genes are unknown. Here, we show that E2F7 is highly expressed during mid to late S-phase, occupies promoters of G1/S-regulated genes and represses their transcription. ChIP-seq analysis revealed that E2F7 binds preferentially to genomic sites containing the TTCCCGCC motif, which closely resembles the E2F consensus site. We identified 89 target genes that carry E2F7 binding sites close to the transcriptional start site and that are directly repressed by short-term induction of E2F7. Most of these target genes are known to be activated by E2Fs and are involved in DNA replication, metabolism and DNA repair. Importantly, induction of E2F7 during G0-G1/S resulted in S-phase arrest and DNA damage, whereas expression of E2F7 during G2/M failed to disturb cell cycle progression. These findings provide strong evidence that E2F7 directly controls the downswing of oscillating G1/S genes during S-phase progression.
INTRODUCTION
Since the discovery of E2F nearly 25 years ago as a biochemical activity able to bind the Adenovirus E2 promoter and control the expression of genes involved in S-phase, a considerable amount of information has accumulated in support of a pivotal role for this protein family in the temporal control of gene expression during the cell cycle (1). Since that time, eight E2F family members have been identified in mammals (2). The classical E2Fs (E2F1-6) regulate transcription of their target genes when bound to their promoters as dimers with a DP protein, whereas atypical E2Fs (E2F7-8) bind to promoters as homodimers or heterodimers without DP (3–5). At the structural level, the similitude of the atypical E2Fs with the classical E2Fs is limited to its DNA-binding domains (DBD), and here the atypical E2Fs are further distinguished from its relatives by possessing two DBD rather than one (6–11).
Many studies have detailed the role for E2F activities in controlling gene expression at G1/S, involving the activation of genes encoding DNA replication proteins, enzymes responsible for DNA biosynthesis, proteins that assemble to form functional origin complexes and kinases that are involved in activation of DNA replication. In addition to this role for E2F, a substantial number of E2F-induced genes are normally regulated at G2 of the cell cycle, encoding proteins known to function in mitosis (12–15). Consistent with these observations, global gene expression profiling and genome-wide promoter occupancy studies [chromatin immunopreciptation (ChIP)-on ChIP and ChIP-sequencing] have confirmed that many genes that are crucial for proper cell cycle progression are bona fide targets of E2F1, E2F4 and E2F6 (13,16–19). Despite the considerable progress that has been made toward understanding how classical E2Fs regulate the cell cycle, the identity of genes regulated by atypical E2Fs is still unknown.
To obtain a complete understanding of the role of the atypical E2Fs in cell cycle control, it will require the identification of the full range of E2F target genes. One issue that may complicate attempts to determine the role of the individual E2Fs is that loss of one family member may lead to compensation by another, either as a result of increased levels of one family member for the other or replacement of one family member for the other at particular promoters. In fact, previous studies show that long-term loss of E2F7 leads to compensatory function by E2F8 and vice versa to ensure cell viability and survival of the organism (20). Furthermore, we and others demonstrated the existence of a direct transcriptional feedback loop between E2F7/8 and E2F1 (20,21). Therefore, we have taken an unbiased approach of ChIP in combination with sequencing (ChIP-seq) that allows the identification of in vivo binding sites for E2F7 without altering the ratios of the E2Fs to each other. E2F8 target genes could not be determined, because all commercial and home-made antibodies against E2F8 were not of sufficient quality to perform ChIP-seq assays. To validate the obtained E2F7 targets and to determine their functional significance, we generated inducible E2F7 cell lines and evaluated the direct effects of short-term induction of E2F7 on target gene expression and cell cycle progression.
MATERIALS AND METHODS
Generation of cell lines
Mouse E2F7 cDNA (Reference sequence: NM_178609.4) was amplified with primers that introduced a HindIII site at the 5′ and a BamHI site at the 3′-end, using Pfu polymerase (Fermentas). The cDNA was then cloned into the pEGFP-N3 plasmid (Invitrogen) using a double digestion with these two enzymes, followed by ligation with T4 ligase (Fermentas), in such a way that a C-terminal E2F7-EGFP fusion protein would be transcribed. In addition to wild-type E2F7, we used a E2F7 cDNA with both DNA binding domains mutated as described previously (20), which served as a negative control. Subsequently, EGFP, E2F7-EGFP and E2F7-DBD mutant-EGFP were digested out from the pEGFP plasmid by a double enzymatic digestion with HindIII and XhoI, and subsequently ligated into the pcDNA4/TO plasmid (Invitrogen) using T4 ligase. Successful cloning was confirmed with sequencing (Baseclear, Leiden, The Netherlands). Tet repressor-expressing HeLa cells (T-REx HeLa, Invitrogen) were transfected with these constructs, and stable clones were established by Zeocin selection (Invitrogen, 300 µg ml−1). The cells were cultured in DMEM containing 10% Tet System Approved fetal bovine serum (Clontech). Overexpression was induced by adding 0.2 µg ml−1 doxycycline (Sigma) to the cell culture medium. Cells were synchronized by serum starvation followed by hydroxyurea block as following: first near-confluent cells were cultured for 36 h in serum-deprived medium (0.5% FBS). Then, cells were subcultured and allowed to attach to the culture dishes in DMEM containing 10% FBS for 3 h. Subsequently, 2 mM hydroxyurea (Sigma Aldrich) was added to the medium for 16 h to arrest cells at the onset of S phase. Cells were released from the HU block by washing three times with PBS and adding fresh medium containing 10% FBS. In an additional experiment, cells were synchronized in G0 by reducing the concentration of FBS to 0.1% for 72 h. Subsequently, the serum concentration was increased to 10% to allow cell cycle reentry.
E2f7loxP/loxP E2f8loxP/loxP mouse embryonic fibroblasts were isolated and maintained as described previously (20). Immortalization with retroviral constructs containing Myc and Ras61L was performed as described previously (20,22). The immortalized lines were then treated with retrovirus containing the Cre recombinase to generate E2f7/8 double knockout cells, according to standard methods (23).
Flow cytometry
For measurement of DNA contents, cells were trypsinized, washed with PBS, fixed with 70% ethanol and stored at 4°C up to 1 week. Cells were washed twice with PBS, and then reconstituted in PBS containing 20 µg ml−1 propidium iodide, 250 µg ml−1 RNase A and 0.1% bovine serum albumin (BSA). Staining and quantification of γ-H2AX was done according to the protocol described by MacPhail et al. (24). Briefly, cells were fixed with ethanol, permeabilized with 0.1% Triton X-100 and stained with a rabbit polyclonal antibody directed against γ-H2AX (NB 100-2280, Novus Biologicals). After washing, cells were incubated for 1 h with anti-rabbit conjugated to Dylight 649 (711-495-152, Jackson Laboratories). After rewashing, cells were stained with 1 µg ml−1 4′,6-diamidino-2-phenylindole (DAPI), and analyzed immediately on a flow cytometer. All samples were analyzed on a BD FACS Canto II or a FACScan flow cytometer. Cell cycle analysis was done using FlowJo 7.6.
Quantitative PCR and microarray
Isolation of RNA, cDNA synthesis and qPCR were performed as previously described (25). Gene expression was calculated using a ΔΔCt method adapted for multiple-reference gene correction (26). All samples were corrected for two reference genes: β-Actin, and 18S ribosomal RNA. Primer sequences are provided in Supplementary Table S7.
Gene expression microarrays were performed using human 70-mer oligos (Operon, Human V2 AROS) spotted onto Codelink activated slides (Surmodics USA). RNA amplifications, labeling and hybridizations were performed on an automated system (Caliper Life Sciences NV/SA, Belgium) with 3 µg total RNA from each sample, as previously described (27). Hybridizations were done on a HS4800PRO system (Tecan Benelux B.V.B.A.) using 1000 ng labeled cRNA per channel. Hybridized slides were scanned on an Agilent scanner (G2565BA) at 100% laser power, 30% PMT. After automated data extraction using Imagene 8.0 (BioDiscovery), printtip Loess normalization was performed on mean spot-intensities (28). Four biological replicates of vehicle- and doxycycline-treated samples were compared. Half of the replicates were labeled with Cy5 against control RNA (Cy3) on dual channel arrays; the second half was analyzed with opposite dye labeling.
Data were analyzed using ANOVA (MAANOVA, version 1.41). In a fixed-effect analysis, sample, array and dye effects were modeled. P-values were determined by a permutation F2-test, in which residuals were shuffled 5000 times globally. Genes with P < 0.05 after FDR correction and cut-off m value (2log fold change) of ±0.25 were considered significantly changed. The up- or down-regulated transcripts in doxycycline-treated samples were analyzed using the DAVID and PANTHER gene ontology tools (29–31). Data from the microarray study are available at the Gene Expression Omnibus, accession number GSE33448.
Chromatin immunoprecipitation and ChIP-sequencing
ChIP was performed according to Millipore's EZ ChIP protocol, with the following specifications: cells were crosslinked for 10 min by 1% freshly made formaldehyde. Crosslinking was stopped by 5 min of 100 mM glycine. Cells were then washed twice with PBS, and scraped in 1 ml of ChIP lysis buffer. Lysates were sonicated for 8 min at maximum power on a Covaris S2 (Covaris). For ChIP-qPCR 1 million cells were used for each reaction; for ChIP-seq, 25 million cells were used for each reaction. IPs were performed using BSA-blocked Fast Flow Agarose G beads (Millipore, 16-266). A rabbit polyclonal E2F7 antibody (sc-66870, Santa Cruz) was used for immunoblotting (1:1000), conventional ChIP (1 µg per reaction) and ChIP-seq (10 µg per reaction).
To improve signal-to-noise ratios in the ChIP-seq experiments, a double-IP protocol was used. Antibody–chromatin complexes were eluted from the beads using 200 µl of buffer containing 1% SDS and 100 mM NaHCO3, and dissolved in 10 ml of ChIP dilution buffer. The IP was then repeated with 5 µg antibody, and processed according to the EZ ChIP protocol. Library construction and sequencing were performed as described previously (32). Briefly, immunoprecipitated chromatin was sheared, end-repaired, sequencing adaptors were ligated and the library was amplified by ligation mediated PCR (LMPCR). After LMPCR, the library was purified and checked for the proper size range and for the absence of adaptor dimers on a 2% agarose gel, barcoded and sequenced on SOLiD/AB sequencer in multiplexed way to produce 50-bp long reads. Sequencing reads were mapped against the reference genome (hg19 assembly, NCBI build 37) using BWA package (33). Multiple reads mapping to same location and strand have been collapsed to single read and only uniquely placed reads were used for peak-calling. Cisgenome (34) was used for peak-calling from the ChIP-seq data. Motif analysis was performed using CisModule function (35), using the following parameters: motif number K = 15, mean motif length Lambda = 10, maximal motif length allowed = 18, Initial motif length = 10, initial module size D = 3.0, module length = 100, order of background Markov chain = 3, MCM iteration = 500. A combination of custom PERL and R scripts and Cisgenome functions were used for additional data analysis. Data from the ChIP-seq study are available at the Gene Expression Omnibus, accession number GSE32673.
Immunoblotting
Cells were harvested by washing twice with PBS, and scraped in a lysis buffer containing 50 mM Tris-HCl, 1 mM EDTA, 150 mM NaCl, 0.25% deoxycholic acid, 1% Nonidet-P40, and protease inhibitors (Roche). Cells were lysed on ice for 20 min, and centrifuged for 10 min at 12 000g. The supernatants were then immunoblotted with standard SDS-PAGE techniques. The following antibodies were used: E2F7 (Santa Cruz sc-66870), E2F1 (sc-193), GFP (sc-9996), RAD51 (sc-8349), α-Tubulin (Sigma-Aldrich T5168), γ-Tubulin (T6557), mouse IgG HRP-linked whole Ab (GE Healthcare, NA931), rabbit IgG HRP-linked whole Ab (NA934). Visualization was done by ECL (GE Healthcare RPN2106) and exposure to a film (GE Healthcare).
RESULTS
Genome-wide mapping of E2F7 binding sites
To identify novel E2F7 binding sites in promoters of target genes, we performed ChIP-seq experiments. Given that E2F7 expression is regulated in a cell cycle-dependent manner (6,7), we first determined when E2F7 protein levels peak during the cell cycle to provide sufficient enrichment required for ChIP-seq experiments. To this end, HeLa cells were synchronized at the beginning of S-phase by arresting cells in the presence of hydroxyurea (HU). Upon removal of the drug, these cells then progress through S-phase, G2, and mitosis, as evaluated by propidium iodide staining and flow cytometry (Supplementary Figure S1). Immunoblotting showed that E2F7 protein levels peaked at 4–6 h after HU removal, when cells are in mid to late S-phase (Figure 1A). For comparison, E2F1 protein levels peaked at 0–4 h during early S-phase and decreased afterward, when E2F7 accumulates maximally. These findings are in line with a feedback mechanism between these two transcription factors, where E2F1 activates E2F7 expression and E2F7 represses E2F1 expression (20). Utilizing siRNAs targeting against either E2F7 or E2F1, we confirmed antibody specificity (data not shown). Based on these expression data, cell lysates were harvested 6 h after HU release to perform ChIP-seq experiments with an antibody specific for endogenous human E2F7. A sequencing library was created, and after mapping and filtering, 5 647 197 unique reads were used for peak calling. In addition, we sequenced a parallel sample of input DNA from the same cells as a control to ensure that enriched sites are not an artifact of the processing and sequencing. Thus, ChIP peak scores were normalized corresponding input peak scores during the peak calling algorithm, resulting in 1107 significantly enriched E2F7 peaks. Almost 50% of the filtered peaks were located within 1 kb from annotated transcription start sites (Supplementary Figure S2). A distance of maximum 5 kb up- or downstream from a transcription start site was taken as a cut-off for identification of putative E2F7 target genes. Gene ontology (GO) analysis on the 737 genes identified this way (Supplementary Table S1) showed highest fold enrichments for pathways related to DNA metabolism, repair and replication (Supplementary Table S2). In fact, every enriched category was directly related to the cell cycle, with the exception of the GO clusters ‘mRNA splicing’ and ‘Pre-mRNA processing’. Among the 737 genes identified, many known E2F target genes were present, such as CDC6, MCM2 and RAD51 (Figure 1B and Supplementary Table S1).
Figure 1.

Identification of E2F7 target genes by ChIP-seq analysis. (A) E2F7 and E2F1 immunoblots on HU-synchronized HeLa cells. Alpha-Tubulin immunoblots served as loading control. (B) Examples of E2F7 ChIP peaks near transcription start sites of three different genes. Chromosome coordinates are indicated above the peaks. The bottom tracks show UTRs, coding regions, and introns indicated by thin or thick boxes, and lines respectively. The direction of transcription is from left to right in all shown genes. (C) ChIP-qPCR confirmation of a panel of target genes in HU-synchronized HeLa cells. ChIPs were performed using an E2F7 antibody or non-immune IgGs as controls. ChIP qPCR on a non-specific region 700 bp upstream of E2F binding sites of the E2F1 promoter (E2F1 exon 1) served as negative control for unspecific binding. Graphs represent average ± SD (n = 2) (D) Position weight matrix of highest overrepresented motif within E2F7 peaks compared with random DNA regions. (E) Distribution of the E2F7 binding motif among ChIP-seq peaks, based on proximity to nearest transcription start site (TSS).
We confirmed binding of E2F7 to promoters of these genes specifically during S-phase using ChIP followed by quantitative PCR (Figure 1C). Interestingly, we found that E2F7 occupied the promoters of E2F1, E2F2, E2F3 and E2F8 as well as its own promoter, supporting our previous studies showing that atypical E2Fs can regulate the transcription of the classical activator E2Fs (Supplementary Table S1) (6,20). Recent ChIP-seq studies showed that E2F4 binds to promoters of all E2Fs and all pocket proteins (18). Here, we found that E2F7 also occupied the promoter of p107 (RBL1), but not the promoters of other pocket proteins or other classical E2F repressors (E2F4-6).
E2F7 binds to the consensus E2F site
A de novo motif search of E2F7-enriched DNA regions yielded a motif closely resembling the classic E2F-binding consensus sequence TTTSSCGC (Figure 1D). In total, 15 motifs were found, of which 7 were enriched >2-fold over random DNA regions (Supplementary Table S3). Without exception, these seven motifs are known binding sites for other transcription factors, such as NF-Y and SP1. A motif resembling the classic consensus E2F binding site showed by far the highest enrichment (6-fold; Figure 1D and Supplementary Table S3). Single or multiple copies of this E2F7 binding site motif were present in 70% of the peaks located within 5 kb from a transcriptional start site, but only in 20% of the more distant peaks (Figure 1E).
E2F7 represses transcription of G1/S genes
To complement the ChIP-seq studies described above, we overexpressed E2F7 and analyzed the global gene expression by microarrays. We generated HeLa cell lines stably expressing doxycycline-inducible E2F7 constructs tagged with enhanced green fluorescent protein (EGFP). Cell lines containing only EGFP constructs, or E2F7 with mutated DNA binding domains (DBDmutant) construct served as negative controls. In absence of doxycycline, stably transfected E2F7 cell lines did not show increased E2F7 mRNA levels compared to EGFP only cell lines, confirming that the inducible expression system was not leaky (Figure 2A). A robust increase in E2F7 protein was seen as soon as 4 h after initiation of doxycycline treatment (Figure 2B). To identify direct targets of E2F7, we induced E2F7 expression for 8 h, when E2F7 protein just reached maximum levels without yet reducing protein levels of E2F1, a known direct target of E2F7 (Figure 2B) (20). Thus indirect transcriptional effects through an E2F1 feedback loop could be ruled out. Given the strong enrichment of E2F7 on promoters of genes involved in DNA replication, we performed expression studies in an HU-synchronized cell population. HeLa cells were treated for 16 h with HU and during the last 8 h of the HU-synchronization E2F7 expression was induced by adding doxycycline. We then performed gene expression analysis on four biological replicates of doxycycline- versus vehicle-treated cells by microarrays. Three hundred and thirty-four transcripts were significantly decreased, whereas only 80 were increased (Supplementary Table S4). GO analysis of the down-regulated transcripts showed that the most strongly enriched pathways were related to the cell cycle, especially DNA replication, repair, and metabolism (Supplementary Table S5). Analysis of the upregulated transcripts yielded no significantly enriched pathways.
Figure 2.

Validation of E2F7 target genes by microarray analysis after doxycycline-induced E2F7 overexpression. (A) qPCR analysis for E2F7 gene expression in cell lines stably expressing doxycycline inducible E2F7-EGFP (E2F7), E2F7-DBDmut-EGFP (DBDmut), or EGFP alone, cultured either with doxycycline (DOXY) or vehicle for 24 h. Data represent average ± SEM (n = 3), asterisks indicate P < 0.05 versus vehicle (B) GFP and E2F1 immunoblots on HeLa cell lysates harvested at different time points after doxycycline-induced E2F7-EGFP expression. Immunoblotting for γ-tubulin served as loading control. (C) Venn diagram to show overlap between down- (red) and upregulated (green) transcripts identified by gene expression microarray after 8 h E2F7 overexpression and transcripts related to genes with a E2F7 ChIP peak (blue) within 5 kb from their transcription start site (TSS). (D) Percentages of genes containing a ChIP peak within 5 kb from the TSS, categorized according to regulation in gene expression microarray after E2F7 overexpression, i.e., downregulated (DOWN), no change (NC), or upregulated (UP). Error bars represent standard deviation of 1000 randomized datasets with resampled gene names. Triple asterisk indicates P < 0.001 calculated from permutation test. (E) Heat map of PANTHER gene ontology enrichments in microarray and ChIP-seq showing similar enrichments of gene ontology clusters. Only clusters with Benjamini scores <0.05 were considered significantly enriched.
To determine whether there is an overlap between E2F7 targets identified in our ChIP-seq and microarray experiments, we performed comparative analysis on both data sets. Remarkably, 89 transcripts (27%) that were downregulated after E2F7 overexpression also had an E2F7 peak within 5 kb from its transcription start site, whereas upregulated genes showed no overlap (Figure 2C and D). These genome-wide studies provide strong evidence that E2F7 acts strictly as a transcriptional repressor. The widespread overlap in targets points to the high degree of specificity achieved in our ChIP-sequencing and microarray experiments. On the basis of these findings, we propose that these 89 transcripts are the top E2F7 gene targets (Table 1). Importantly, the expression of the majority of these E2F7 target genes are known to be regulated at G1/S phase of the cell cycle (Table 1), suggesting that E2F7 is critical to down-regulate these genes during late S-phase, at the time of the cell cycle when E2F7 accumulates maximally (Figure 1A). Functional annotation on the overlapping target genes derived from both genome-wide studies confirmed again a strong enrichment for gene products known to be involved in DNA replication, metabolism and repair (Figure 2E and Supplementary Table S6). Interestingly, both microarray and ChIP-seq experiments showed enrichment of target genes involved in mRNA processing and regulation of splicing (e.g. DHX15, HNRNPD and several SFRS isoforms), suggesting a regulatory role for E2F7 in controlling mRNA splicing, as described previously for E2F1 (36).
Table 1.
Identification of top E2F7 target genes by combination of ChIP-seq and gene expression microarray
| Gene symbol | Peak mRNA | E2F7 motifs | Gene symbol | Peak mRNA | E2F7 motifs | Gene symbol | Peak mRNA | E2F7 motifs |
|---|---|---|---|---|---|---|---|---|
| DNA replication and metabolism | Cell cyle regulation | Miscellaneous/unknown | ||||||
| CDC6 | G1/Sa,b | 2 | CCNE1 | G1/Sa,b,c | 0 | ARGLU1 | 1 | |
| CDC7 | G1/Sa,b | 4 | CCNE2 | G1/Sa,b | 11 | ATAD2 | G1/Sb | 1 |
| CDT1 | 1 | CDKN1A | 3 | C3orf58 | 3 | |||
| CHAF1B | G1/Sa,b | 1 | E2F3 | 7 | CDCA7 | 4 | ||
| DBF4 | 1 | E2F7 | 1 | CDCA7L | 3 | |||
| DTL | G1/Sb | 3 | E2F8 | G1/Sa,b | 3 | CREBZF | 1 | |
| DUT | 2 | WEE1 | G2/Ma,b | 2 | DEK | 8 | ||
| FEN1 | G1/Sa,b,c | 1 | FBXL3 | 1 | ||||
| GINS2 | 1 | Nucleobase, nucleotide and nucleoside biosynthesis | GPD2 | 2 | ||||
| MCM2 | G1/Sa,b | 1 | DHFR | Sa | 1 | GPR180 | 3 | |
| MCM3 | G1/Sb,c | 5 | GMPS | 1 | KBTBD2 | 2 | ||
| MCM4 | G1/Sb,c | 3 | MTHFD1 | G1/Sb | 2 | KITLG | 3 | |
| MCM6 | G1/Sa,b,c | 0 | KPNB1 | M/G1a | 2 | |||
| MCM7 | G1/Sc | 5 | Chromatin organization | LUC7L2 | 3 | |||
| ORC1L | G1/Sa,b | 2 | ASF1B | G2/Mb | 3 | MLF1IP | G2/Mb | 3 |
| PCNA | G1/Sa,b,c | 4 | CBX3 | M/G1a | 1 | MTAP | 4 | |
| POLA1 | G1/Sa,c | 1 | DNMT1 | G1/Sc | 0 | NUP160 | 2 | |
| POLD2 | 0 | HELLS | G1/Sb | 2 | PLCXD1 | 0 | ||
| PRIM1 | Sa | 1 | YEATS4 | G1/Sb | 3 | PLSCR1 | 2 | |
| PSMC3IP | 2 | RHEB | 2 | |||||
| RBBP4 | 1 | RNA processing/splicing | SCML1 | 4 | ||||
| RFC2 | Sa | 3 | DHX15 | 2 | SERTAD4 | 1 | ||
| RFC4 | Sa | 2 | EXOSC9 | G1/Sb | 1 | SIVA1 | 3 | |
| HNRNPD | 3 | STARD7 | 0 | |||||
| DNA repair | HNRPDL | 1 | TCF19 | 2 | ||||
| BLM | G1/Sb | 3 | INTS7 | 3 | TMEM194A | 2 | ||
| CHEK1 | 3 | SLBP | G1/Sa,b,c | 2 | TMPO | G2/Ma,b | 1 | |
| EXO1 | G1/Sa,b | 2 | TNFAIP8 | 4 | ||||
| FANCI | 2 | Cytoskeleton organization | UBE2T | 0 | ||||
| FANCL | 2 | FBXO5 | G1/Sb | 7 | ||||
| MSH2 | G1/Sa | 3 | RANBP1 | 3 | ||||
| MSH6 | G1/Sb,c | 3 | SAC3D1 | 2 | ||||
| RPA2 | G1/Sa,b | 2 | SPC25 | 1 | ||||
| UNG | G1/Sa,b | 0 | TUBA1B | 2 | ||||
| USP1 | G1/Sa,b | 2 | TUBB | G2/Ma,b | 2 | |||
Peak mRNA indicates whether mRNA levels of the depicted genes peak during specific cell cycle stages, according to at least one of three different publications: aWhitfield et al. (38); bBar-Joseph et al. (42); or cIshida et al. (12). Third column indicates the number of E2F7 binding motifs in ChIP-seq peaks within 5 kb from the TSS of depicted genes. Gene names and complete overview of associated GO terms of each gene can be found in Supplementary Table S6.
We then used quantitative PCR analysis to assess the effect of acute induction of E2F7 on the transcription of target genes in a time-dependent manner. We took advantage of our inducible cell lines containing either wild-type E2F7 or E2F7-DBD-mutant. The cell lines were synchronized by HU block and during the last hours of HU synchronization E2F7 was induced by adding doxycycline for 4, 8 or 12 h. As seen in Figure 3A, the expression of transcripts involved in DNA replication or DNA repair started already to decrease after 4 h of doxycycline treatment. Previous studies demonstrated that E2F1, E2F2 and E2F3 control expression of genes involved in DNA replication as well as mitosis and cytokinesis (12–14). We therefore examined the expression of a panel of genes implicated in mitosis/cytokinesis, but failed to detect a significant decrease in gene expression after E2F7 induction (Figure 3A). Induction of E2F7 DBD mutant in HeLa cells had no effect on E2F target gene expression (Figure 3A and Supplementary Figure S3). These results confirmed our genome-wide studies showing that transcripts involved in DNA replication, metabolism and repair are direct targets of E2F7, whereas mitotic or cytokinetic genes are not regulated by E2F7.
Figure 3.

E2F7 represses transcription of G1/S but not G2/M genes. (A) Gene expression of G1/S- and G2/M-regulated genes involved in DNA replication, DNA repair and mitosis at different time point after doxycycline (DOXY) dependent induction E2F7-EGFP (E2F7) or E2F7-DBDmut-EGFP in HU arrested cells, analyzed by qPCR. Graphs represent average ± SEM (n = 3). Asterisks indicate P < 0.05 versus its corresponding 0 h time point. (B) FACS plots show that cells treated with doxycycline or vehicle were in G2 9 h after HU release; green overlay indicates percentage of E2F7-GFP positive cells versus all propidium iodide stained cells. Gene expression analysis similar as in A was performed on G1/S- and G2/M-regulated genes in cells harvested 9 h after HU release and doxycycline treatment. Data represent average ± SEM (n = 3); asterisks indicate P < 0.05 versus vehicle. (C) Gene expression analysis of G1/S- and G2/M-regulated genes in Myc/Ras transformed wild-type and E2f7−/−E2f8−/− mouse embryonic fibroblasts (MEFs) by qPCR. Data represent average ± SEM (n = 5); Asterisks indicate P < 0.05 versus wild-type. (D) FACS plots showing a dramatic increase in 4 n Myc/Ras transformed wild-type and E2f7−/−E2f8−/− MEFs after 16 h of nocodazole (250 ngml−1) Gene expression analysis of G1/S-regulated genes in the MEFs of indicated genotypes by qPCR. Data represent average ± SEM (n = 3); Asterisks indicate P < 0.05 versus wild-type.
One possibility for the failure of E2F7 to repress G2/M genes might be that we performed our studies in HU-arrested cells. We, therefore, induced expression of E2F7 during G2/M phase at the time when mitotic/cytokinetic gene products such as CCNB1, PLK1, and ECT2 accumulate maximally (37–39). To this end, cells were first synchronized by HU, and then released from the HU-block for 9 h, and E2F7 expression was induced during the last 9 h. About 70% of the cells treated with doxycycline were in G2/M phase of the cell cycle and expressed E2F7-EGFP (Figure 3B). Quantitative PCR analysis revealed that mRNA levels of CCNB1, PLK1 and ECT2 (Figure 3B), as well as Aurora kinase A and RACGAP1 (data not shown) were again not downregulated by E2F7 overexpression. In contrast, RAD51 and E2F1 mRNA were significantly decreased 9 h after hydroxyurea release. Consistent with these findings, we found that E2F7 overexpression in asynchronously growing cells resulted in downregulation of G1/S genes but not G2/M genes (Supplementary Figure S3).
Given the above observations, we examined whether genetic disruption of E2f7 increases expression of G1/S genes but not G2/M genes. Previous studies showed that E2F8 can compensate for the loss of E2f7 (20). We, therefore, generated E2f7−/− E2f8−/− mouse embryonic fibroblasts and measured gene expression on a panel of G1/S and G2/M genes by quantitative PCR. Messenger RNA levels of G1/S genes were ∼3-fold increased compared to wild-type cells, whereas mRNA levels of G2/M genes were not affected or only modestly increased (Figure 3C).
Subsequently, we studied whether the increased expression of the G1/S genes was maintained during the later phases of the cell cycle. To this end, we arrested wild-type and E2f7−/− E2f8−/− mouse embryonic fibroblasts at the onset of M-phase with 16 h of nocodazole treatment. Again, expression of Cdc6, Cdt1 and Mcm2 was significantly increased in the E2f7−/− E2f8−/− cells (Figure 3D).
From these results, we conclude that E2F7 directly represses the expression of specific G1/S genes involved in DNA replication, metabolism and repair.
E2F7 overexpression leads to S-phase arrest
Given the above observation, we hypothesize that E2F7 overexpression might impair DNA replication. To test this possibility, we induced E2F7 expression in a synchronized population of cells stimulated to progress through the cell cycle. We synchronized cells in G1/S by serum deprivation followed by restimulation with medium containing 10% serum and HU. Cells were then washed and incubated with medium lacking HU and harvested at various times following HU release. E2F7 expression was induced by adding doxycycline to the medium 12 h before the HU release. Cell cycle progression was monitored by flow cytometry (Figure 4A). Strikingly, E2F7 overexpression arrested cells in early S-phase, indicating that E2F7 has an important role in regulating DNA replication. As expected, cells treated with vehicle and cells expressing the doxycycline inducible E2F7-DBD mutant progressed normally through the cell cycle and passed through a complete round of DNA replication within 9 h after HU release.
Figure 4.

Timed E2F7 overexpression results in a severe DNA replication defect. (A) Flow cytometric analysis of DNA content of propidium iodide (PI)-stained cells, which were induced to express E2F7-EGFP (E2F7 DOXY) or E2F7-DBDmutant-EGFP (DBDmut DOXY) during the last 12 h of HU-synchronization (−12 h HU). Vehicle treated cells containing the E2F7-EGFP (E2F7 vehicle) served as an additional control. (B) Flow cytometric analysis on HU-synchronized cells, where E2F7-EGFP expression was induced at the time point of HU release (0 h HU). (C) Flow cytometric analysis on cells synchronized by 72-h serum starvation (0.1% fetal bovine serum), where E2F7-EGFP expression was induced 24 h before serum addition (10% fetal bovine serum; −24 h serum).
To investigate whether E2F7 overexpression also affects G2/M progression, we induced E2F7 expression at a later time point by adding doxycycline at the onset of hydroxyurea release (Figure 4B). Despite robust induction of E2F7 protein during G2/M (Supplementary Figure S4A), cell cycle progression was not disturbed, supporting our previous observation that E2F7 function is not critical for regulating transcription of G2/M genes.
To evaluate whether E2F7 overexpression also affects entry of quiescent cells into the cell cycle, we induced E2F7 expression in serum starved cells and found that cells enter the cell cycle but arrested in S-phase when cells were stimulated by serum addition (Figure 4C). Consistent with these observations, E2F7 overexpression in asynchronized cells dramatically reduced the number of phospho-histone-3 (PH3) positive cells, underscoring that E2F7 overexpression induces an S-phase arrest and thereby prevents entry into G2/M (Supplementary Figure S4B and C). To ensure that the observed S-phase accumulation was not a cell type-specific event of our inducible HeLa cell lines, we transfected asynchronously growing 293 T kidney epithelial cells with E2F7 (Supplementary Figure S5). In line with our previous results, we observed a clear S-phase accumulation.
We observed that a small population of E2F7 overexpressing cells continued to pass through the cell cycle, but E2F7-EGFP flow cytometry analysis revealed that this population was composed of low expressing E2F7 cells (Supplementary Figure S6). Together these studies suggest that E2F7 controls S-phase progression through repressing E2F target genes involved in DNA replication and metabolism.
E2F7 overexpression results in DNA damage
Given the overrepresentation of DNA repair genes in the list of E2F7 target genes generated from our genome-wide studies, we determined whether E2F7 overexpression would cause DNA damage. We show that induction E2F7 for 24 h resulted in increased DNA double-strand breaks, analyzed by flow cytometric quantification of fluorescent γ-H2AX staining (Figure 5A and B). Consistent with this observation, immunoblotting revealed that protein levels of Rad51—a pivotal factor to repair double strand breaks by homologous recombination—were markedly decreased upon E2F7 overexpression (Figure 5C). Previous work indicated that γ-H2AX is also activated in apoptotic cells (40). To examine whether E2F7 overexpression causes cells to undergo apoptosis, we performed Annexin V staining and calculated the rate of apoptotic cells by flow cytometry. E2F7 induction for 24 h did not increase the number of apoptotic cells at the time when increased DNA damage was detected by γ-H2AX staining (Figure 5D). However, at 48 h after E2F7 induction, we observed increased numbers of apoptotic cells. In line with these findings, in cells synchronized by serum starvation and stimulated to enter the cell cycle by serum addition, we detected a rising sub-G1 peak between 36 and 48 h after E2F7 induction by PI flow cytometry analysis (Figure 4D). These results indicate that long term E2F7 overexpression can cause apoptosis, possibly due to the accumulation of DNA damage.
Figure 5.
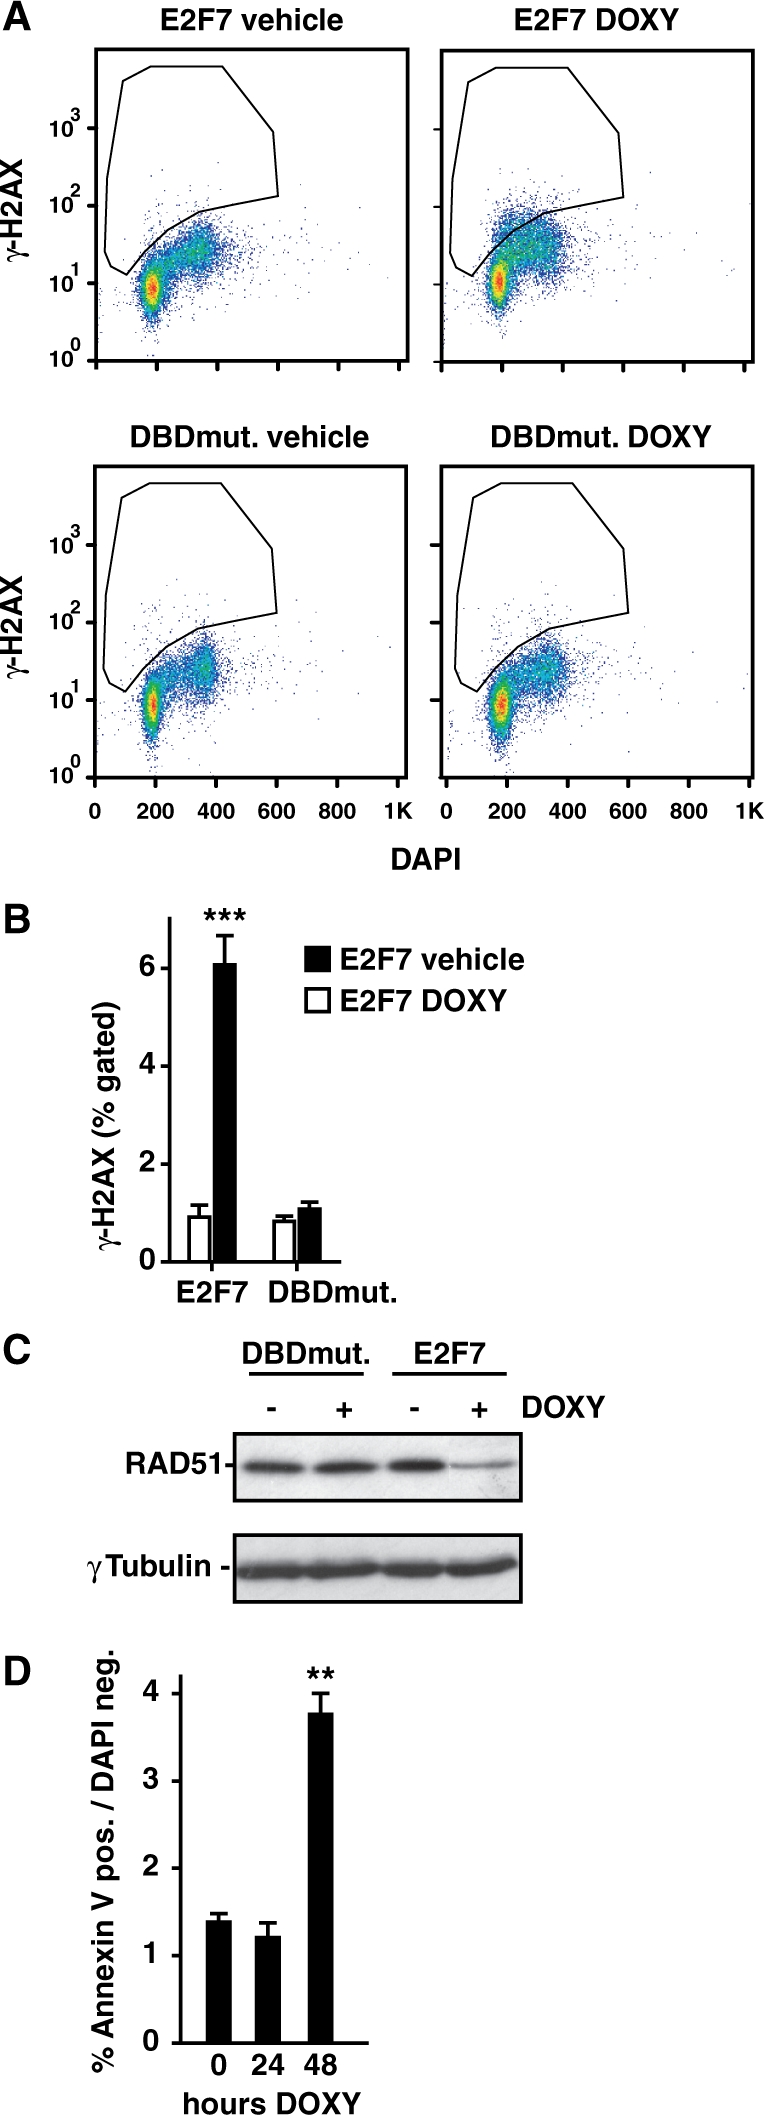
E2F7 overexpression causes DNA damage. (A) Flow cytometric analysis of asynchronously growing cells, where E2F7 or E2F7 DBD-mutant expression was induced for 24 h by adding doxycycline. Vehicle treated cells were used as controls. Cells were labeled with DAPI and antibodies against γ-H2AX a marker for DNA damage. (B) Quantification of γ-H2AX staining, showing average percentage of gated cells with γ-H2AX signal above background level. Data represent average ± SEM (n = 3–4). Triple asterisk indicates P < 0.0005 versus E2F7 Wt vehicle. (C) RAD51 immunoblots on lysates of asynchronized cells, where E2F7 or E2F7 DBD-mutant expression was induced for 24 h by adding doxycycline. γ-Tubulin immunoblotting served as loading control. (D) Quantification of flow cytometric analysis of Annexin V and DAPI staining on asynchronized cells, where E2F7 expression was induced for 24 or 48 h by adding doxcycline. Apoptotic cells were counted as Annexin positive and DAPI negative cells. Data represent average ± SEM (n = 3); double asterisk indicates P < 0.005 versus vehicle.
DISCUSSION
Here, we have identified novel genomic binding sites for the E2F7 transcription factor in promoters of mammalian cells using ChIP-seq technology. However, the binding of a transcriptional regulator to the promoter region of a gene suggests that the factor has regulatory effects on the gene, but it is also possible that the factor does not fully or even partially control the gene. For this reason, we have identified a set of genes where E2F7 binding correlates with reduced gene expression after short term induction of E2F7. The data derived from these two independent genome-wide approaches were combined and resulted in a list of 89 genes, which we consider as the top E2F7 target genes and that encode gene products involved predominantly in DNA replication, metabolism and DNA repair. Inducible E2F7 overexpression arrested cells in S-phase, providing strong evidence for an important role for E2F7 in controlling S-phase progression through transcriptional repression of its target genes. These findings are supported by our previous studies showing that ablation of atypical E2Fs in MEFs accelerates S-phase progression (20). Because, E2F7 expression is regulated in a cell cycle-dependent manner, the genome-wide studies were performed in synchronized cell populations, to achieve maximal expression of E2F7 and sufficient enrichment on its targets. A possible disadvantage of this approach is that we select for E2F7 target genes regulated during S-phase and might miss E2F7 target genes that are not expressed during this cell cycle phase.
We have identified TTCCCGCC as the predominant E2F7 binding motif. This motif closely resembles the classic E2F binding motif TTTSSCGC, where S is either a C or a G. Over 70% of all ChIP peaks mapping within 5 kb from a transcription start site contained at least one repeat of this motif. This percentage was even higher when considering only the 89 genes that were also down-regulated after E2F7 overexpression (90%). Our data are in contrast with recent studies utilizing promoter occupancy assays, which revealed that only a very small percentage of the regions bound in vivo by E2F1, E2F4 or E2F6 contained consensus E2F motifs, suggesting that classical E2Fs are recruited in vivo predominantly to non-consensus binding sites (16–19). We retrieved a relatively low number of E2F7-enriched regions in the ChIP-seq analysis, about 10-fold lower than reported numbers of peaks in ChIP-seq studies on E2F1 and E2F4 binding (17,18). Apart from differences in methodology or antibody characteristics, this could be explained by different binding properties of atypical E2Fs compared to E2F-DP heterodimers. In vitro protein–DNA binding studies suggested different binding specificity for combinations of E2F-DP (41). It is conceivable that E2F7/8 homo- and heterodimers also have unique DNA binding characteristics.
A substantial number of the E2F7 target genes have been previously linked to E2F function. A role for E2F1, E2F2 and E2F3a in activation several of these DNA replication, metabolism and repair genes has been well established (23). Strikingly, the transcription of the majority of these E2F target genes is repressed directly by E2F7, suggesting that E2F7 counterbalances the transcription of E2F target genes activated by E2F1-3 a. Previous studies have shown that the transcription of these E2F target genes oscillates during the cell cycle with peak levels during the G1/S phase transition (12,38,42). Our studies show that protein levels of E2F7 accumulate maximally at mid to late S-phase coinciding with the time when the expression of E2F target genes declines. In line with this, our previous studies demonstrated that transcription of E2F target genes such as Cdc6 increased acutely during S and G2 when atypical E2Fs were deleted in synchronized MEFs (20). Together, these findings suggest that classical E2F activators are essential for the upswing in the oscillating pattern of the cell cycle-specific expression of G1/S genes, whereas the atypical E2Fs contribute directly to the downswing.
Previous work has demonstrated that E2F activators also control transcription of G2/M-regulated genes encoding proteins known to function in mitosis (12–15). We provide substantial evidence that the expression of G2/M-regulated genes is not controlled directly by E2F7. First, we show that induction of E2F7 during S-G2/M does not disturb cell cycle progression, whereas induction of E2F7 expression during G0 or G1/S arrested cells in S-phase. Second, E2F7 protein levels dramatically decrease during G2/M indicating that E2F7 is not relevant during this phase of the cell cycle. Third, overexpression of an E2F7 degradation-resistant mutant that is highly expressed during G2/M failed to block cell cycle progression during mitosis (B. Westendorp and A. de Bruin, unpublished data). Finally, our genome-wide studies revealed that the majority of the G2/M genes are not repressed by E2F7 and do not contain E2F7 binding sites in their promoters. These observations are supported by a previous study showing that E2F1 but not E2F7 bound to promoters of CDC2 and CCNA2, two G2/M-regulated genes (7). However, it is possible that manipulation of E2F7 expression levels has indirect effects on the regulation of G2/M through altering expression of G1/S genes. In fact, we observed that long term overexpression of E2F7 down-regulated expression of both G1/S and G2/M genes, suggesting that E2F7-mediated repression of E2F activators leads subsequently to decreased expression of G2/M genes. This is in line with work from Zhu et al. (14) demonstrating that E2F activators link the control of G1/S and G2/M transcription.
Our experiments also demonstrate that E2F7 represses directly important players in the DNA damage response—most notably RAD51, CHEK1 and the BRCA1 and -2 genes. In line with this, E2F7 overexpression caused a marked increase in DNA damage. Consistent with these observations, Zalmas et al. (21) showed that inactivation of atypical E2Fs prevents cell cycle effects that occur in response to DNA damage. Negative feedback regulation of DNA repair is essential, which is illustrated by studies that demonstrate that inappropriate expression of the E2F7 targets such as RAD51 and BLM contribute to genomic instability (43,44). Furthermore, increased levels of many DNA repair genes in tumors are often associated with poor prognosis (45,46).
Our previous microarray analysis on E2f7−/−E2f8−/− mouse embryos demonstrated deregulation of predominately gene products known to be activated in response to stresses, including hypoxia, nutrient deprivation and apoptosis (20). In contrast, our current genome-wide studies in human cells show that E2F7 is critical for controlling transcription of G1/S genes and we observed no enrichment for genes involved in cellular stress responses. This discrepancy is most likely related to fact that E2f7−/−E2f8−/− embryos show multifocal severe E2F1-dependent apoptosis and vascular defects. In addition, genetic disruption of atypical E2fs in mice leads to a severe placental phenotype (G. Leone, personal communication), indicating that oxygen and nutrient supply is reduced in E2f7−/−E2f8−/− embryos resulting in activation of a cellular stress response, as we have previously described in Rb deficient mice (47,48). Furthermore, we have deleted atypical E2fs in the liver utilizing albumin-cre transgenic mice and found that the majority of the top E2F7 targets were upregulated in postnatal livers of E2f7−/−E2f8−/− mice (S. Pandit and A. de Bruin, unpublished data). These findings point towards a direct role of E2F7 to control transcription of G1/S genes rather than regulating stress related genes.
SUPPLEMENTARY DATA
Supplementary Data are available at NAR Online: Supplementary Tables 1–8, Supplementary Figures 1–6, Supplementary Methods and Supplementary Reference [20].
FUNDING
Funding for open access charge: Utrecht University.
Conflict of interest statement. None declared.
Supplementary Material
ACKNOWLEDGEMENTS
The authors thank R. Medema and R. Klompmaker for helpful comments on the experimental data and advice on generation of overexpression cell lines. G. Leone for providing E2f7/8 knockout mice. M. Westendorp—Van de Bovenkamp, I. Thurlings, W.J. Bakker and B.G.M.W Weijts are thanked for critically reviewing the manuscript.
REFERENCES
- 1.Reichel R, Kovesdi I, Nevins JR. Developmental control of a promoter-specific factor that is also regulated by the E1A gene product. Cell. 1987;48:501–506. doi: 10.1016/0092-8674(87)90200-5. [DOI] [PubMed] [Google Scholar]
- 2.Van Den Heuvel S, Dyson NJ. Conserved functions of the pRB and E2F families. Nat. Rev. Mol. Cell Biol. 2008;9:713–724. doi: 10.1038/nrm2469. [DOI] [PubMed] [Google Scholar]
- 3.Attwooll C, Lazzerini Denchi E, Helin K. The E2F family: specific functions and overlapping interests. EMBO J. 2004;23:4709–4716. doi: 10.1038/sj.emboj.7600481. [DOI] [PMC free article] [PubMed] [Google Scholar]
- 4.Dimova DK, Dyson NJ. The E2F transcriptional network: old acquaintances with new faces. Oncogene. 2005;24:2810–2826. doi: 10.1038/sj.onc.1208612. [DOI] [PubMed] [Google Scholar]
- 5.Chen HZ, Tsai SY, Leone G. Emerging roles of E2Fs in cancer: an exit from cell cycle control. Nat. Rev. Cancer. 2009;9:785–797. doi: 10.1038/nrc2696. [DOI] [PMC free article] [PubMed] [Google Scholar]
- 6.De Bruin A, Maiti B, Jakoi L, Timmers C, Buerki R, Leone G. Identification and characterization of E2F7, a novel mammalian E2F family member capable of blocking cellular proliferation. J. Biol. Chem. 2003;278:42041–42049. doi: 10.1074/jbc.M308105200. [DOI] [PubMed] [Google Scholar]
- 7.Di Stefano L, Jensen MR, Helin K. E2F7, a novel E2F featuring DP-independent repression of a subset of E2F-regulated genes. EMBO J. 2003;22:6289–6298. doi: 10.1093/emboj/cdg613. [DOI] [PMC free article] [PubMed] [Google Scholar]
- 8.Logan N, Delavaine L, Graham A, Reilly C, Wilson J, Brummelkamp TR, Hijmans EM, Bernards R, La Thangue NB. E2F-7: a distinctive E2F family member with an unusual organization of DNA-binding domains. Oncogene. 2004;23:5138–5150. doi: 10.1038/sj.onc.1207649. [DOI] [PubMed] [Google Scholar]
- 9.Logan N, Graham A, Zhao X, Fisher R, Maiti B, Leone G, La Thangue NB. E2F-8: an E2F family member with a similar organization of DNA-binding domains to E2F-7. Oncogene. 2005;24:5000–5004. doi: 10.1038/sj.onc.1208703. [DOI] [PubMed] [Google Scholar]
- 10.Christensen J, Cloos P, Toftegaard U, Klinkenberg D, Bracken AP, Trinh E, Heeran M, Di Stefano L, Helin K. Characterization of E2F8, a novel E2F-like cell-cycle regulated repressor of E2F-activated transcription. Nucleic Acids Res. 2005;33:5458–5470. doi: 10.1093/nar/gki855. [DOI] [PMC free article] [PubMed] [Google Scholar]
- 11.Maiti B, Li J, De Bruin A, Gordon F, Timmers C, Opavsky R, Patil K, Tuttle J, Cleghorn W, Leone G. Cloning and characterization of mouse E2F8, a novel mammalian E2F family member capable of blocking cellular proliferation. J. Biol. Chem. 2005;280:18211–18220. doi: 10.1074/jbc.M501410200. [DOI] [PubMed] [Google Scholar]
- 12.Ishida S, Huang E, Zuzan H, Spang R, Leone G, West M, Nevins JR. Role for E2F in control of both DNA replication and mitotic functions as revealed from DNA microarray analysis. Mol. Cell. Biol. 2001;21:4684–4699. doi: 10.1128/MCB.21.14.4684-4699.2001. [DOI] [PMC free article] [PubMed] [Google Scholar]
- 13.Ren B, Cam H, Takahashi Y, Volkert T, Terragni J, Young RA, Dynlacht BD. E2F integrates cell cycle progression with DNA repair, replication, and G(2)/M checkpoints. Genes Dev. 2002;16:245–256. doi: 10.1101/gad.949802. [DOI] [PMC free article] [PubMed] [Google Scholar]
- 14.Zhu W, Giangrande PH, Nevins JR. E2Fs link the control of G1/S and G2/M transcription. EMBO J. 2004;23:4615–4626. doi: 10.1038/sj.emboj.7600459. [DOI] [PMC free article] [PubMed] [Google Scholar]
- 15.Polager S, Kalma Y, Berkovich E, Ginsberg D. E2Fs up-regulate expression of genes involved in DNA replication, DNA repair and mitosis. Oncogene. 2002;21:437–446. doi: 10.1038/sj.onc.1205102. [DOI] [PubMed] [Google Scholar]
- 16.Xu XQ, Bieda M, Jin VX, Rabinovich A, Oberley MJ, Green R, Farnham PJ. A comprehensive chip-chip analysis of E2F1, E2F4, and E2F6 in normal and tumor cells reveals interchangeable roles of E2F family members. Genome Res. 2007;17:1550–1561. doi: 10.1101/gr.6783507. [DOI] [PMC free article] [PubMed] [Google Scholar]
- 17.Cao AR, Rabinovich R, Xu M, Xu X, Jin VX, Farnham PJ. Genome-wide analysis of transcription factor E2F1 mutant proteins reveals that N- and C-terminal protein interaction domains do not participate in targeting E2F1 to the human genome. J. Biol. Chem. 2011;286:11985–11996. doi: 10.1074/jbc.M110.217158. [DOI] [PMC free article] [PubMed] [Google Scholar]
- 18.Lee BK, Bhinge AA, Iyer VR. Wide-ranging functions of E2F4 in transcriptional activation and repression revealed by genome-wide analysis. Nucleic Acids Res. 2011;39:3558–3573. doi: 10.1093/nar/gkq1313. [DOI] [PMC free article] [PubMed] [Google Scholar]
- 19.Rabinovich A, Jin VX, Rabinovich R, Xu X, Farnham PJ. E2F in vivo binding specificity: Comparison of consensus versus nonconsensus binding sites. Genome Res. 2008;18:1763–1777. doi: 10.1101/gr.080622.108. [DOI] [PMC free article] [PubMed] [Google Scholar]
- 20.Li J, Ran C, Li E, Gordon F, Comstock G, Siddiqui H, Cleghorn W, Chen HZ, Kornacker K, Liu CG, et al. Synergistic function of E2F7 and E2F8 is essential for cell survival and embryonic development. Dev. Cell. 2008;14:62–75. doi: 10.1016/j.devcel.2007.10.017. [DOI] [PMC free article] [PubMed] [Google Scholar]
- 21.Zalmas LP, Zhao X, Graham AL, Fisher R, Reilly C, Coutts AS, La Thangue NB. DNA-damage response control of E2F7 and E2F8. EMBO Rep. 2008;9:252–259. doi: 10.1038/sj.embor.7401158. [DOI] [PMC free article] [PubMed] [Google Scholar]
- 22.Sharma N, Timmers C, Trikha P, Saavedra HI, Obery A, Leone G. Control of the P53-P21(CIP1) axis by E2f1, E2f2, and E2f3 is essential for G(1)/S progression and cellular transformation. J. Biol. Chem. 2006;281:36124–36131. doi: 10.1074/jbc.M604152200. [DOI] [PubMed] [Google Scholar]
- 23.Wu L, Timmers C, Maiti B, Saavedra HI, Sang L, Chong GT, Nuckolls F, Giangrande P, Wright FA, Field SJ, et al. The E2F1-3 transcription factors are essential for cellular proliferation. Nature. 2001;414:457–462. doi: 10.1038/35106593. [DOI] [PubMed] [Google Scholar]
- 24.Macphail SH, Banath JP, Yu Y, Chu E, Olive PL. Cell cycle-dependent expression of phosphorylated histone H2AX: reduced expression in unirradiated but not X-irradiated G1-phase cells. Radiat. Res. 2003;159:759–767. doi: 10.1667/rr3003. [DOI] [PubMed] [Google Scholar]
- 25.Van Dijk-Ottens M, Vos IH, Cornelissen PW, De Bruin A, Everts ME. Thyroid hormone-induced cardiac mechano growth factor expression depends on beating activity. Endocrinology. 2010;151:830–838. doi: 10.1210/en.2009-0520. [DOI] [PubMed] [Google Scholar]
- 26.Vandesompele J, De Preter K, Pattyn F, Poppe B, Van Roy N, De Paepe A, Speleman F. Accurate normalization of real-time quantitative RT-PCR data by geometric averaging of multiple internal control genes. Genome Biol. 2002;3:RESEARCH0034. doi: 10.1186/gb-2002-3-7-research0034. [DOI] [PMC free article] [PubMed] [Google Scholar]
- 27.Roepman P, Wessels LF, Kettelarij N, Kemmeren P, Miles AJ, Lijnzaad P, Tilanus MG, Koole R, Hordijk GJ, Van Der Vliet PC, et al. An expression profile for diagnosis of lymph node metastases from primary head and neck squamous cell carcinomas. Nat. Genet. 2005;37:182–186. doi: 10.1038/ng1502. [DOI] [PubMed] [Google Scholar]
- 28.Yang YH, Dudoit S, Luu P, Lin DM, Peng V, Ngai J, Speed TP. Normalization for cDNA microarray data: a robust composite method addressing single and multiple slide systematic variation. Nucleic Acids Res. 2002;30:E15. doi: 10.1093/nar/30.4.e15. [DOI] [PMC free article] [PubMed] [Google Scholar]
- 29.Thomas PD, Campbell MJ, Kejariwal A, Mi HY, Karlak B, Daverman R, Diemer K, Muruganujan A, Narechania A. PANTHER: a library of protein families and subfamilies indexed by function. Genome Res. 2003;13:2129–2141. doi: 10.1101/gr.772403. [DOI] [PMC free article] [PubMed] [Google Scholar]
- 30.Thomas PD, Kejariwal A, Guo N, Mi H, Campbell MJ, Muruganujan A, Lazareva-Ulitsky B. Applications for protein sequence-function evolution data: MRNA/protein expression analysis and coding SNP scoring tools. Nucleic Acids Res. 2006;34:W645–W650. doi: 10.1093/nar/gkl229. [DOI] [PMC free article] [PubMed] [Google Scholar]
- 31.Huang Da W, Sherman BT, Lempicki RA. Systematic and integrative analysis of large gene lists using DAVID bioinformatics resources. Nat. Protoc. 2009;4:44–57. doi: 10.1038/nprot.2008.211. [DOI] [PubMed] [Google Scholar]
- 32.Mokry M, Hatzis P, De Bruijn E, Koster J, Versteeg R, Schuijers J, Van De Wetering M, Guryev V, Clevers H, Cuppen E. Efficient double fragmentation Chip-Seq provides nucleotide resolution protein-DNA binding profiles. PLos One. 2010;5:E15092. doi: 10.1371/journal.pone.0015092. [DOI] [PMC free article] [PubMed] [Google Scholar]
- 33.Li H, Durbin R. Fast and accurate short read alignment with burrows-wheeler transform. Bioinformatics. 2009;25:1754–1760. doi: 10.1093/bioinformatics/btp324. [DOI] [PMC free article] [PubMed] [Google Scholar]
- 34.Ji H, Jiang H, Ma W, Johnson DS, Myers RM, Wong WH. An integrated software system for analyzing Chip-Chip and Chip-Seq data. Nat. Biotechnol. 2008;26:1293–1300. doi: 10.1038/nbt.1505. [DOI] [PMC free article] [PubMed] [Google Scholar]
- 35.Zhou Q, Wong WH. Cismodule: de novo discovery of cis-regulatory modules by hierarchical mixture modeling. Proc. Natl Acad. Sci. USA. 2004;101:12114–12119. doi: 10.1073/pnas.0402858101. [DOI] [PMC free article] [PubMed] [Google Scholar]
- 36.Merdzhanova G, Edmond V, De Seranno S, Van Den Broeck A, Corcos L, Brambilla C, Brambilla E, Gazzeri S, Eymin B. E2F1 controls alternative splicing pattern of genes involved in apoptosis through upregulation of the splicing factor SC35. Cell Death Differ. 2008;15:1815–1823. doi: 10.1038/cdd.2008.135. [DOI] [PubMed] [Google Scholar]
- 37.Uchiumi T, Longo DL, Ferris DK. Cell cycle regulation of the human polo-like kinase (PLK) promoter. J. Biol. Chem. 1997;272:9166–9174. doi: 10.1074/jbc.272.14.9166. [DOI] [PubMed] [Google Scholar]
- 38.Whitfield ML, Sherlock G, Saldanha AJ, Murray JI, Ball CA, Alexander KE, Matese JC, Perou CM, Hurt MM, Brown PO, et al. Identification of genes periodically expressed in the human cell cycle and their expression in tumors. Mol. Biol. Cell. 2002;13:1977–2000. doi: 10.1091/mbc.02-02-0030.. [DOI] [PMC free article] [PubMed] [Google Scholar]
- 39.Saito S, Tatsumoto T, Lorenzi MV, Chedid M, Kapoor V, Sakata H, Rubin J, Miki T. Rho exchange factor ECT2 is induced by growth factors and regulates cytokinesis through the N-terminal cell cycle regulator-related domains. J. Cell. Biochem. 2003;90:819–836. doi: 10.1002/jcb.10688. [DOI] [PubMed] [Google Scholar]
- 40.De Feraudy S, Revet I, Bezrookove V, Feeney L, Cleaver JE. A minority of foci or pan-nuclear apoptotic staining of gammah2ax in the s phase after UV damage contain DNA double-strand breaks. Proc. Natl Acad. Sci. USA. 2010;107:6870–6875. doi: 10.1073/pnas.1002175107. [DOI] [PMC free article] [PubMed] [Google Scholar]
- 41.Tao Y, Kassatly RF, Cress WD, Horowitz JM. Subunit composition determines E2F DNA-binding site specificity. Mol. Cell. Biol. 1997;17:6994–7007. doi: 10.1128/mcb.17.12.6994. [DOI] [PMC free article] [PubMed] [Google Scholar]
- 42.Bar-Joseph Z, Siegfried Z, Brandeis M, Brors B, Lu Y, Eils R, Dynlacht BD, Simon I. Genome-wide transcriptional analysis of the human cell cycle identifies genes differentially regulated in normal and cancer cells. Proc. Natl Acad. Sci. USA. 2008;105:955–960. doi: 10.1073/pnas.0704723105. [DOI] [PMC free article] [PubMed] [Google Scholar]
- 43.Mirzaei H, Syed S, Kennedy J, Schmidt KH. Sgs1 truncations induce genome rearrangements but suppress detrimental effects of BLM overexpression in Saccharomyces cerevisiae. J. Mol. Biol. 2011;405:877–891. doi: 10.1016/j.jmb.2010.11.035. [DOI] [PMC free article] [PubMed] [Google Scholar]
- 44.Richardson C, Stark JM, Ommundsen M, Jasin M. Rad51 overexpression promotes alternative double-strand break repair pathways and genome instability. Oncogene. 2004;23:546–553. doi: 10.1038/sj.onc.1207098. [DOI] [PubMed] [Google Scholar]
- 45.Al-Ejeh F, Kumar R, Wiegmans A, Lakhani SR, Brown MP, Khanna KK. Harnessing the complexity of DNA-damage response pathways to improve cancer treatment outcomes. Oncogene. 2010;29:6085–6098. doi: 10.1038/onc.2010.407. [DOI] [PubMed] [Google Scholar]
- 46.Ciccia A, Elledge SJ. The DNA damage response: making it safe to play with knives. Mol. Cell. 2010;40:179–204. doi: 10.1016/j.molcel.2010.09.019. [DOI] [PMC free article] [PubMed] [Google Scholar]
- 47.Wu L, De Bruin A, Saavedra HI, Starovic M, Trimboli A, Yang Y, Opavska J, Wilson P, Thompson JC, Ostrowski MC, et al. Extra-embryonic function of Rb is essential for embryonic development and viability. Nature. 2003;421: 942–947. doi: 10.1038/nature01417. [DOI] [PubMed] [Google Scholar]
- 48.De Bruin A, Wu L, Saavedra HI, Wilson P, Yang Y, Rosol TJ, Weinstein M, Robinson ML, Leone G. Rb function in extraembryonic lineages suppresses apoptosis in the CNS of Rb-deficient mice. Proc. Natl Acad. Sci. USA. 2003;100:6546–6551. doi: 10.1073/pnas.1031853100. [DOI] [PMC free article] [PubMed] [Google Scholar]
Associated Data
This section collects any data citations, data availability statements, or supplementary materials included in this article.