

Abstract
The Burden of Obstructive Lung Disease (BOLD) initiative provides standardised estimates of the burden of chronic obstructive pulmonary disease (COPD) worldwide. We estimate the current and future economic burden of COPD in Reykjavik, Iceland and Bergen, Norway using data from the BOLD initiative.
Data on utilisation of healthcare resources were gathered from the BOLD survey, existing literature and unit costs from national sources. Economic data were applied to a Markov model using transition probabilities derived from Framingham data. Sensitivity analyses were conducted varying unit costs, utilisation and prevalence of disease.
The cost of COPD was €478 per patient per yr in Iceland and €284 per patient per yr in Norway. The estimated cumulative costs of COPD for the population aged ≥40 yrs, were €130 million and €1,539 million for the following 10 yrs in Iceland and Norway, respectively. Costs of COPD accounted for 1.2 and 0.7% of healthcare budgets in Iceland and Norway, respectively. Sensitivity analyses showed estimates were most sensitive to changes in exacerbation frequency.
COPD has a significant economic burden in both Iceland and Norway and will grow in the future. Interventions aimed at avoiding exacerbations will have the most impact on costs of COPD over the next 20 yrs.
Keywords: Chronic obstructive pulmonary disease, computer simulation, cost of illness, disease progression, Iceland, Markov chains, Norway
The burden of chronic obstructive pulmonary disease (COPD) is considerable [1]. To fully understand the implications of this chronic condition, the burden of illness also needs to be described in terms of societal economic consequences.
The Obstructive Lung Disease in Northern Sweden (OLIN) studies [2] estimated that, in 1999, the annual cost of COPD was €1,448 per patient aged 28–80 yrs. COPD was defined as forced expiratory volume in 1 s (FEV1)/forced vital capacity (FVC) <0.7 without bronchodilator. Other cost-of-illness studies have been register-based studies that ignore undiagnosed patients [3, 4].
There are several difficulties related to cost-of illness studies. First, estimates become outdated quickly, as unit costs, treatment patterns and prevalence of diseases change. Secondly, the methods to survey complex chronic diseases are both time-consuming and expensive. Finally, results in different studies are subject to considerable variation (e.g. [5] versus [6]). Thus, the comparison between surveys and countries is questionable [7].
A supplement to cost-of-illness studies is disease modelling with predicted economic estimates as an outcome. Cost evaluations can be carried out as simulations, entering prevalence and progression rates from existing literature and combining them with utilisation rates and costs of services (unit costs). However, previous health economic COPD models [8–11] have mainly used incomplete transition probabilities from the Lung Health Study [12], or unpublished probabilities from the OLIN studies in Northern Sweden [8].
The Burden of Obstructive Lung Disease (BOLD) initiative is a multicentre international study aiming to estimate the burden of COPD worldwide [13]. COPD prevalence is estimated using current guidelines from The Global Initiative for Chronic Obstructive Lung Disease (GOLD) [14], and data have already been published for the first 12 sites [1]. As a part of the BOLD initiative, an economic model [15] has been developed using data from the Framingham Heart Study [16] as basis for modelling disease progression.
Using prevalence and cost data from the Icelandic (Reykjavik) and Norwegian (Bergen) BOLD sites, our aim was to estimate and compare the economic burden of COPD in these two Nordic countries. We have used the BOLD health economic model to estimate current and future costs of COPD in Iceland and Norway. Limiting the study to these two countries enables a more comprehensive presentation of the simulations and a more thorough discussion of the results. The viewpoint of our analyses has been at the society level.
METHODS
Population
The BOLD study has been comprehensively described elsewhere [13]. All participating sites provided population-based random samples from non-institutionalised individuals aged ≥40 yrs. The fixed ratio FEV1/FVC <0.7 after bronchodilation was applied as the primary disease criterion for COPD, and GOLD stages were used for severity classification [14]. Data were collected by interviews covering the previous 12 months. Certified technicians performed pre- and post-bronchodilator spirometry by using quality criteria complying to, or even stricter than the American Thoracic Society (ATS) standards [17]. All predicted values are based on the National Health and Nutrition Examination Survey (NHANES) III equations [18].
The Norwegian BOLD sample was a stratified random sample, of which the target population was defined as the city of Bergen with 105,000 residents aged ≥40 yrs in 2005 [19]. The BOLD sample consisted of participants and nonparticipants from the year 2003 follow-up of a simple randomised cohort study first examined in 1985 [20]. The Icelandic BOLD sample was a simple random sample from all Icelandic citizens aged ≥40 yrs living in the city of Reykjavik and surrounding suburbs with a target population of 73,391 subjects as of November 2004. In total, 658 (response rate 63.0%) and 757 subjects (response rate 80.6%) were considered full responders in Norway and Iceland, respectively (see supplementary E-table 1). Further details of the samples are given in the supplementary material.
The economic model
The structure of the economic model has been described previously [13, 15]. This model is based on Markovian transition probabilities [21]. That is, using published literature and data from the Framingham Heart Study [16], we have derived probabilities of transition between nine states of health (table 1). In addition, death is included as a separate state. Annual transition probabilities are age, sex and smoking status specific for each health state. Risk of mortality was gathered from NHANES [22]. Mortality estimates are country specific in the model. Overall mortality rates and respiratory-specific mortality rates are based on national statistics from both Norway and Iceland [23]. The supplementary material provides further detail on the calculation of transition probabilities and E-table 2 shows annual progression rates by age, sex, smoking status and baseline COPD severity.
TABLE 1.
The nine health states of the Burden of Obstructive Lung Disease (BOLD) economic model and their prevalence in the Icelandic (Ice) and Norwegian (Nor) BOLD sites
| Smoker | Never-smoker | Former smoker | |
|---|---|---|---|
| Non-COPD | Smoker, non-COPD (Ice: 14.3%; Nor: 21.7%) |
Never-smoker, non-COPD (Ice: 33.8%; Nor: 31.8%) |
Former smoker, non-COPD (Ice: 34.7%; Nor: 27.6%) |
| COPD stage I | Smoker, COPD stage I (Ice: 2.3%; Nor: 3.3%) |
Non-smoker (never and former), COPD stage I (Ice: 6.3%; Nor: 7.2%) |
|
| COPD stage II | Smoker, COPD stage II (Ice: 1.3%; Nor: 2.5%) |
Non-smoker (never and former), COPD stage II (Ice: 5.4%; Nor: 4.7%) |
|
| COPD stage III+ | Smoker, COPD stage III+ (Ice: 0.5%; Nor: 0.3%) |
Non-smoker (never and former), COPD stage III+ (Ice: 1.3%; Nor: 0.9%) |
|
COPD: chronic obstructive pulmonary disease. COPD stages were defined as follows: COPD stage I: forced expiratory volume in 1 s (FEV1)/forced vital capacity (FVC) <0.7, FEV1 % predicted ≥80%; COPD stage II: FEV1/FVC <0.7, FEV1 % pred 50–79%; COPD stage III+: FEV1/FVC <0.7, FEV1 % pred <50%.
Subjects can transition from non-COPD health states to COPD health states. Within COPD health states subjects can only transition to more severe COPD. Events (e.g. exacerbations) do not impact transition rates. For each (annual) time cycle, costs are added for each of the modelled subjects. The simulations were run as a cohort. For future costs, we have used an annual discount rate of 3%.
The model cohort
The model began with an estimate of the population of Iceland and Norway aged ≥40 yrs. Subjects are placed into one of the model health states based on population statistics and results of the BOLD prevalence survey from each site [1], in which the prevalence of post-bronchodilator COPD (stage I or higher) was estimated to be 18.0% in Iceland and 18.8% in Norway. The incidence of COPD, according to sex and age, for both Iceland and Norway is based on data from the Hordaland County Respiratory Health Survey, which showed that 7 out of 1,000 subjects of a general adult population developed post-bronchodilator COPD each year [24]. This is combined with relative risks for development of COPD according to smoking status from the Framingham Heart Study (T.A. Lee; personal communication), to account for the effect of smoking status on COPD incidence. All incident COPD cases were placed in GOLD stage I. Smoking rates were based on BOLD survey results and population statistics for both countries [25, 26]. Smoking relapse rate was estimated using the 1990 US Surgeon General’s report on smoking cessation [27], while smoking cessation rates are based on results from the National Health Interview Survey in the USA [28].
Costs and costs methodology
The model included annual costs related to scheduled visits to physicians (general practitioners (GPs), specialists), exacerbations (hospital admissions, unscheduled healthcare provider contacts, antibiotics, oral steroids), prescription medication, pulmonary rehabilitation and home oxygen treatment. Table 2 shows unit costs for Iceland and Norway. E-table 3 shows unit costs specific for exacerbations. The cost estimated is the sum of costs for patients and the respective national health insurance systems. The supplementary material provides details on the sources for unit costs.
TABLE 2.
Unit costs associated with chronic obstructive pulmonary disease (COPD) in Iceland and Norway in 2005
| Iceland | Norway | |
|---|---|---|
| Healthcare provider visit cost estimates | ||
| Telephone contact | 4.0 | 4.4 |
| General practitioner/primary care provider visit | 46.6 | 52.5 |
| Specialist provider visit | 77.5 | 166.6 |
| Daily medication cost estimates | ||
| Inhaled β-agonists €·day−1 | 1.2 | 0.8 |
| Inhaled corticosteroids €·day−1 | 2.0 | 2.0 |
| Anticholinergics# €·day−1 | 2.4 | 0.6 |
| Systemic corticosteroids €·day−1 | 0.9 | 0.4 |
| Antibiotics | 2.5 | 1.6 |
| Other treatment cost estimates | ||
| Home oxygen annual cost | 2706 | 3 184 |
| Pulmonary rehabilitation¶ €·stay−1 | 10232 | 2 329 |
| Hospitalisation | ||
| Average COPD hospitalisation | 5966 | 3 920 |
Data are presented as €, unless otherwise stated.
: cost difference is due to dominance of tiotropium in Iceland and ipratropium in Norway;
: rehabilitation in Iceland (Reykjavik) takes place over 6 weeks as an inpatient and in Norway (Bergen), the rehabilitation programme lasts for 16 days and the participants are outpatients, hence the cost difference.
Frequency of utilisation
Estimates for scheduled annual contacts with healthcare providers were based on data from the OLIN studies [2, 29]. Annual exacerbation rates were gathered by pooling data from the Icelandic and Norwegian BOLD sites. An exacerbation was defined, based on responses in the BOLD survey, as an episode of “breathing problems that got so bad that they interfered with your usual daily activities or caused you to miss work”. We differentiated between mild exacerbations (self-managed), moderate exacerbations (healthcare provider contacted) and severe exacerbations (admitted to hospital). Frequency of exacerbations was counted for the preceding 12 months in subjects with post-bronchodilator COPD (E-table 4). Health resource use during exacerbation was estimated using local expert opinion.
Estimates of prescription medication utilisation for each of the health states of COPD were gathered from the BOLD survey for Iceland and Norway, respectively. Frequency of home oxygen use and pulmonary rehabilitation was based on expert opinion, using information from local healthcare authorities in Iceland (Reykjavik) and Norway (Bergen). All of the data on frequency of utilisation are available in the supplementary material (E-table 5).
Analyses
Both cost and disease prevalences were compared using Chi-squared tests and tests of equality of proportions. Means were compared using t-tests after assessing normality. Estimates for the Norwegian sample were weighted to the target population using population statistics [19].
Economic modelling was carried out using Microsoft Excel 2003 (Microsoft Corp, Redmond, WA, USA). For remaining analyses, we used Stata 10 SE for Macintosh OS X (Stata Corp, College Station, TX, USA). All p-values were two-sided and a p-value <0.05 was considered statistically significant. All results are given in 2005 euros (€) based on exchange rates from the Central Bank of Norway [30] and The Central Bank of Iceland [31].
In order to estimate the current and future burden of COPD, we simulated the current population of adults aged ≥40 yrs from each country over a 20-yr period. With the model, we estimated the future prevalence of COPD in each of the severity strata during each year of the 20-yr simulation. The COPD-related healthcare costs were estimated for each of the years of the simulation to determine the future economic burden associated with COPD. For costs, we estimated the current direct healthcare costs, the per capita costs and the costs per patient with COPD overall and by severity of disease. When estimating the future costs of COPD, we estimated the cumulative amount spent on COPD over a 10- and 20-yr period. Furthermore, we estimated the average annual costs over that time period. Finally, we estimated the proportion of costs attributable to exacerbations, physician visits, prescription medication and other healthcare utilisation for each of the severity groups.
Sensitivity analyses
We conducted several sensitivity analyses to determine the influence of model assumptions on the overall results. The sensitivity analyses focused on the key components of COPD-related costs, exacerbations and medication use, and the development and progression of the disease. Further details of the sensitivity analyses are given in the supplementary material.
RESULTS
Response rates in the Norwegian site were slightly lower than in Iceland (E-table 1). Using Chi-squared statistics, there seemed to be a proportionately larger number of females declining to participate in Norway (p<0.05). In Iceland, elderly females (aged ≥70 yrs) had a lower participation rate than younger females (p<0.05). No other discrepancies between responders and non-responders were observed with regards to sex, age or smoking status.
Among the participants in Iceland, 53% were males and in Norway 48% were males. The mean±SEM age was 56.4±0.4 and 57.8±0.5 yrs in the Icelandic and Norwegian samples, respectively. The rates of current smokers were 15.7 and 27.2%, among males, and 21.2 and 28.4% among females, in Iceland and Norway, respectively (table 3).
TABLE 3.
Estimated population characteristics of the Icelandic and Norwegian study samples
| Iceland | Norway | |
|---|---|---|
| Subjects n (response rates %) | 757 (81) | 658 (63) |
| Male sex | 53.2 | 48.0 |
| Age yrs | ||
| 40–49 | 35.9 | 32.2 |
| 50–59 | 29.0 | 28.5 |
| 60–69 | 18.0 | 18.7 |
| 70+ | 17.1 | 20.6 |
| Smoking status (males) | ||
| Current smokers | 15.7 | 27.2 |
| Former smokers | 45.7 | 40.2 |
| Never-smokers | 38.6 | 32.6 |
| Smoking status (females) | ||
| Current smokers | 21.2 | 28.4 |
| Former smokers | 39.4 | 31.0 |
| Never-smokers | 39.4 | 40.6 |
| Dyspnoea at ground level # | 6.9 | 4.8 |
| 3 months of coughing per year | 11.3 | 7.6 |
| Doctor diagnosed COPD | 1.1 | 2.4 |
| Post-bronchodilator spirometry | ||
| FEV1/FVC <0.7 | 18.0 | 18.8 |
| FEV1 % pred | 93.0±0.59 | 95.1±0.60 |
| FVC % pred | 94.2±0.48 | 97.2±0.53 |
| COPD GOLD stage II+ | 9.0 | 8.3 |
Data are presented as % or mean±SEM, unless otherwise stated. COPD: chronic obstructive pulmonary disease; FEV1: forced expiratory volume in 1 s; FVC: forced vital capacity; % pred: % predicted; GOLD: Global Initiative for Chronic Obstructive Lung Disease.
: excluded individuals with physical disabilities.
In the Icelandic sample, the annual prevalence of mild, moderate and severe exacerbations in COPD patients was 0.0, 4.6 and 1.5%, respectively, while in Norway it was estimated to be 0.6, 2.5 and 0.7%, respectively.
Current burden of COPD
The annual direct COPD-related medical costs in Iceland in 2005 were estimated to be €12 million for the population aged ≥40 yrs, and €478 per COPD patient (GOLD stage I and above). In Norway, the respective estimates were €141 million and €284. Patients with the most severe COPD (GOLD stages III and IV) accounted for 29% of annual costs in Iceland and 32% of annual costs in Norway. Cost estimates are given in table 4.
TABLE 4.
Estimated current and future direct medical costs of chronic obstructive pulmonary disease (COPD) in Iceland and Norway
| Iceland |
Norway |
|||||||
|---|---|---|---|---|---|---|---|---|
| Overall cost estimate |
GOLD stage |
Overall cost estimate |
GOLD stage |
|||||
| I | II | III+ | I | II | III+ | |||
| Current burden | ||||||||
| Annual costs | 12 | 4 | 5 | 4 | 141 | 41 | 55 | 45 |
| Costs per COPD patient €·patient−1 |
478 | 329 | 559 | 1566 | 284 | 176 | 348 | 1518 |
| Burden in 10 yrs | ||||||||
| Annual costs | 13 | 5 | 4 | 5 | 154 | 47 | 41 | 66 |
| Cumulative burden | 130 | 45 | 37 | 48 | 1539 | 468 | 413 | 657 |
| Burden in 20 yrs | ||||||||
| Annual costs | 13 | 5 | 3 | 5 | 153 | 47 | 34 | 72 |
| Cumulative burden | 256 | 96 | 61 | 99 | 3066 | 941 | 684 | 1440 |
Data are presented as millions of €, unless otherwise stated. Estimates are in 2005 €, discounted at a 3% annual rate. GOLD: Global Initiative for Chronic Obstructive Lung Disease.
The main cost driver in year 2005 was medication costs, which accounted for 51% of total costs in Iceland, and 48% of total costs in Norway. Costs for healthcare provider visits accounted for 26 and 23% and costs for exacerbations accounted for 17 and 19% in Iceland and Norway, respectively. Other costs, which included home oxygen treatment and rehabilitation programs, accounted for 7% of total COPD costs in Iceland, and 11% of total costs in Norway (fig. 1).
FIGURE 1.

Distribution of chronic obstructive pulmonary disease-related costs (€) in a) Iceland and b) Norway, in the year 2005. □: exacerbation cost;  : drug cost;
  : physician contacts; ■: other costs.
Future burden of COPD
The modelled future COPD prevalence in Iceland and Norway for the population aged ≥40 yrs is shown in figures 2 and 3, respectively. After 10 yrs, the prevalence of COPD stage I+ will have reached 22 and 24% in Iceland and Norway, respectively. The accumulated 10 yrs discounted COPD-related direct medical costs were estimated to €130 million in Iceland and €1,539 million in Norway. The discounted annual total costs were largely unchanged from the 2005 estimates in both countries but the burden of costs from COPD stage III+ increased to 37% in Iceland and 43% in Norway. These numbers increased from 29 to 39% and from 32 to 47%, respectively, in the 20 yrs scenario.
FIGURE 2.
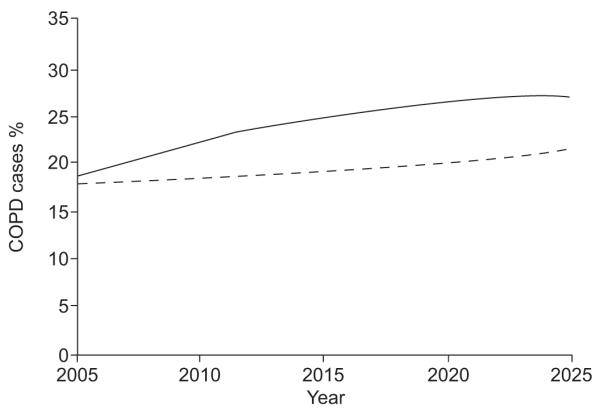
Modelled chronic obstructive pulmonary disease (COPD) prevalence in Iceland from the year 2005 to 2025, in male (––––) and female (-----) subjects aged ≥40 yrs.
FIGURE 3.
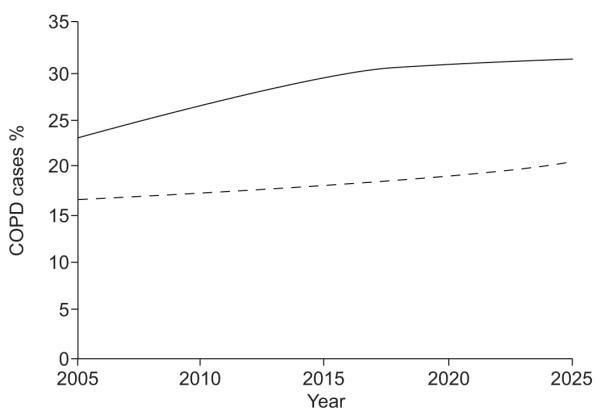
Modelled chronic obstructive pulmonary disease (COPD) prevalence in Norway from the year 2005 to 2025, in male (––––) and female (-----) subjects aged ≥40 yrs.
Sensitivity analyses
All sensitivity analyses are given in table 5. When changing exacerbation rates to those reported by the OLIN survey [29], the cost estimates increased by 236% in Iceland and 226% in Norway. The change was largest within stage III+ (E-table 6). When costs from GOLD stage I COPD were excluded, the estimates for Iceland and Norway decreased by 31 and 30%, respectively. Excluding hospitalisation costs for stage I decreased total 10-yrs costs by 5% in both countries. For the remaining sensitivity analyses, the largest impact was seen when changing utilisation of prescription medication.
TABLE 5.
Sensitivity analyses for 10-yrs accumulated direct chronic obstructive pulmonary disease (COPD)-related costs
| Model variable | Iceland | Norway |
|---|---|---|
| Base case | 130 | 1539 |
| Variation of stage 1 | ||
| Excluding costs of stage 1 | 85 (−34%) | 1070 (−30%) |
| Only medication costs and costs of physician visits included in stage I costs | 124 (−5%) | 1455 (−5%) |
| Transition rates | ||
| Excluding fatalities | 122 (−6%) | 1376 (−11%) |
| Expert panel on transition rates | 124 (−5%) | 1414 (−8%) |
| 25% decrease from base case | 125 (−4%) | 1438 (−7%) |
| 25% increase from base case | 136 (+4%) | 1654 (+7%) |
| Exacerbation rates | ||
| Using BOLD-exacerbation proportions, rather than rates | 127 (−2%) | 1495 (−3%) |
| Exacerbation rates from OLIN studies | 438 (+236%) | 5015 (+226%) |
| Exacerbation resource use from OLIN studies | 129 (−1%) | 1526 (−1%) |
| 25% decrease from base case | 124 (−4%) | 1473 (−4%) |
| 25% increase from base case | 136 (+4%) | 1604 (+4%) |
| Utilisation of prescription medication | ||
| Medication use from pooled data set (Iceland and Norway) | 128 (−2%) | 1638 (+6%) |
| 50% decrease from base case | 98 (−25%) | 1183 (−23%) |
| 50% increase from base case | 163 (+25%) | 1894 (+23%) |
| COPD development | ||
| Incidence rates from [35]# | 118 (−10%) | 1423 (−8%) |
| Relative risk of COPD incidence by sex, age and smoking from [35]# | 131 (0%) | 1544 (0%) |
Data are presented as millions of € (percentage change from base case). All estimates are for the population aged ≥40 yrs, discounted at a 3% annual rate. BOLD: Burden of Obstructive Lung Disease; OLIN: Obstructive Lung Disease in Northern Sweden.
: see the supplementary material for a more comprehensive explanation (section heading “Sensitivity analyses”).
DISCUSSION
By using prevalences from the Icelandic and Norwegian sites of the BOLD survey, we have estimated the current burden of COPD for year 2005 in Iceland to be €12 million and in Norway to be €141 million, for the population aged ≥40 yrs. The cost per patient with COPD was €478 in Iceland and €284 in Norway. We used a Markov chain model based on progression rates from the Framingham Heart study to model future costs which, at a 3% annual discount rate, estimated the 20-yr cumulative burden to reach €256 million for Iceland and €3,222 million for Norway. The robustness of the model was investigated by several sensitivity analyses. Variation of exacerbation rates revealed large changes in the cost estimates.
These are the first published estimates of costs of COPD, both for Iceland and for Norway. The model is based on COPD prevalence estimates that have been obtained using identical state-of-the-art methods in both sites, adding further strength to the results, and facilitating cross-country comparison. We have also modelled the future COPD-related costs, which showed the considerable burden imposed on these two healthcare systems. The relatively constant annual costs after 10 yrs are partly a result of holding the unit costs and treatment patterns at the 2005 level. The sensitivity analyses on exacerbation rates could also be interpreted as simulations of the effect of implementing new treatment. Thus, an intervention, reducing the observed exacerbation rates by 25%, implicates a cost reduction of 4% of the treatment-related costs (not including costs of the new intervention).
The healthcare systems in Iceland and Norway are very similar: both countries provide universal healthcare through a national, government-funded health insurance. In 2005, the Icelandic government spent €1.1 billion on healthcare [32], that is €3,782 per inhabitant or 8% of the gross domestic product (GDP). The Norwegian government spent €22 billion on healthcare in 2005 [33]. That amounts to €4,588 per inhabitant or 9% of the GDP. Thus, our estimates for COPD-related direct medical costs accounts for 1.2% of healthcare costs in Iceland and 0.7% of healthcare costs in Norway.
Some methodological considerations are needed. First, the Norwegian sample is not a simple random sample, but a follow up of a cohort from 1985, with two strata according to response status at a previous follow-up. We believe that this is the main reason for the different response rates between the two sites. Another effect of the different sampling techniques might be a “healthy survivor effect”. However, the cohort has had high response-rates at all follow-ups [20, 34]. The distribution of sex and smoking habits has previously been comparable to those of the Norwegian population [19] and the present results have been weighted to the general Norwegian population using census data. Secondly, we have used transition probabilities from the Framingham Heart Study [16].
The current model does not take into account the changing smoking patterns. However, Feenstra et al. [35] have shown that if all smokers were to quit today, the prevalence 20 yrs in the future would only decrease by 7% from almost doubling in their base case scenario. Due to cohort effects, the impact of changing smoking patterns will probably be minor in view of the effect of the ageing population [35]. The high prevalence of smoking among females in both Iceland and Norway, combined with higher utilisation of healthcare among females, might lead to increased COPD-related resource. Results might also have differed if local transition rates were available, accounting for geographic and exposure variation.
Thirdly, this is among the first publications that use post-bronchodilator spirometry when defining COPD in a health economic setting. Other authors have used either spirometry without bronchodilation [2] or have defined COPD according to self-reports [36] or diagnosis in medical records [3]. Also, we have used the fixed FEV1/FVC <0.7 as disease criterion for COPD. It has been shown that this methodology has a tendency of overestimating COPD prevalence, especially among the elderly [37]. However, this debate is not yet resolved and there are even contradictory findings [38]. In line with the BOLD study protocol [13], we have thus chosen to use the FEV1/FVC <0.7 as disease criterion, although we acknowledge the growing support for the lower limit of normal when diagnosing COPD.
Finally, in the present study, we have not gathered detailed information concerning resource use during exacerbation. To some degree, we have based estimates on local expert opinion. However, the exacerbation rates were based on participant information in the Norwegian and Icelandic BOLD sites. Our definition of exacerbations was based on resource use and we have thus partly based our exacerbation cost estimates on own empirical data.
The most striking difference between the Icelandic and Norwegian estimates is that in spite of more money spent on healthcare in Norway, the Icelandic COPD patient consumes more resources for direct COPD-related care. To investigate these differences, several possible contributing factors call for attention. First, almost all unit costs are more expensive in Iceland than in Norway. A smaller healthcare system, in terms of scale, may contribute to this. Secondly, treatment patterns and traditions may differ between the two countries. Hospital costs for COPD are higher in Iceland (table 2) possibly indicating fewer possibilities in care for end-stage COPD. Additionally, as previously shown by Janson et al. [39], the length of stay in COPD hospitalisations is almost twice as long in Iceland (Reykjavik) compared with Norway (Bergen). The input used for the model from the BOLD survey indicated that, in Iceland, more individuals in stage I and II COPD were treated with inhaled corticosteroids than in Norway (E-table 5), and they received more expensive drug alternatives (table 2). Finally, the rapidly changing value of Icelandic currency might influence the perceived differences between Iceland and Norway [31]. When using purchasing power parities, a tool developed to standardise currency to US dollars while taking GDP into account [40], the difference between the Icelandic and Norwegian annual costs per COPD patient decrease from a 168% difference to a 144% difference.
The OLIN studies have given estimates for both total COPD-related costs [2], and costs related to exacerbations [29]. Their estimates are based on a prospective 1-yr cost-of-illness study in COPD patients from a general population aged ≥28 yrs. Compared with the findings in the current study, costs in Sweden for direct medical care were higher than for both Iceland and Norway (€644 per patient with COPD per year). This difference is mostly attributable to more hospitalisations in the Swedish data, where subjects with FEV1 <40% of predicted on average stayed 8.9 days in hospital each year. The rate of hospitalisation in our study was four hospitalisations per 100 patients per year for COPD stage III+. The low hospitalisation and exacerbation rates in our study were responsible for the finding that only 16 and 17% of COPD-related costs were accounted for by exacerbations, whereas drug costs accounted for 48 and 51% of COPD-related costs in Iceland and Norway, respectively. In the OLIN studies, 37% of annual costs per patient were attributable to hospitalisations. However, results of comprehensive sensitivity analyses were not provided in the OLIN studies, and the impact of varying assumptions regarding unit costs and frequencies of utilisations, remain unknown. Nevertheless, we suspect that the differences between the OLIN studies and the current study can be partly explained by low exacerbation rates in the current study. This might be due to enhanced recollection in the prospective design of the OLIN studies, although hospitalisations are generally well remembered [41]. The strict population-based samples in the BOLD study might also have contributed to the low exacerbation rates found. More documentation of exacerbation rates in Iceland and Norway is needed. It remains to be seen what the use of a symptom-based definition of exacerbations will lead to in terms of variation of exacerbation rates between countries.
In conclusion, we have estimated that the costs of COPD in Iceland and Norway in 2005 amounted to €12 million and €141 million, respectively for the population aged ≥40 yrs. Besides giving the first estimates for costs of COPD in Iceland and Norway, we have also elucidated some of the differences between the two healthcare systems. Both estimates give useful information for local decision makers seeking to optimise the care for COPD patients. Restricting the analyses to these two Nordic countries has enabled a comprehensive description of the modelling and presentation of the results. We have demonstrated the feasibility of the BOLD economic model, both in conducting sensitivity analyses and estimating future costs of COPD. In the future, the BOLD economic model will be available for investigators from other BOLD sites, enabling similar analyses for other countries. Our estimates were particularly sensitive to changes in exacerbation frequency, which emphasises this as an important cost driver and the critical point of intervention when aiming to reduce costs of COPD.
ACKNOWLEDGEMENTS
The authors wish to acknowledge the support of the BOLD Operations Center in Portland, OR, USA for their assistance in carrying out the study. The authors would also like to thank the participants in the BOLD study and field workers: L. Gudmundsdottir, K.B. Jorundsdottir, S. Gudmundsdottir (all Faculty of Medicine, University of Iceland, Reykjavik, Iceland), L. Svendsen and T. Endresen (both Institute of Medicine, University of Bergen, Bergen, Norway).
SUPPORT STATEMENT Funding for the BOLD Operations Center was provided by unrestricted educational grants from ALTANA, Aventis, AstraZeneca, Boehringer-Ingelheim, Chiesi, GlaxoSmithKline, Merck, Novartis, Pfizer, Schering-Plough, Sepracor and University of Kentucky. The Reykjavik BOLD site was funded by the Landspitali University Science Fund, Astra Zeneca in Iceland and GlaxoSmithKline in Iceland. The Norwegian BOLD site was funded by the Research Fund for Respiratory Medicine, Haukeland University Hospital and The Norwegian Association of Heart and Lung Patients and EXTRA funds from the Norwegian Foundation for Health and Rehabilitation.
Footnotes
This article has supplementary material accessible from www.erj.ersjournals.com
STATEMENT OF INTEREST A statement of interest for T. A. Lee and the BOLD study can be found at www.erj.ersjournals.com/misc/statements.dtl
REFERENCES
- 1.Buist AS, McBurnie MA, Vollmer WM, et al. International variation in the prevalence of COPD (the BOLD Study): a population-based prevalence study. Lancet. 2007;370:741–750. doi: 10.1016/S0140-6736(07)61377-4. [DOI] [PubMed] [Google Scholar]
- 2.Jansson SA, Andersson F, Borg S, et al. Costs of COPD in Sweden according to disease severity. Chest. 2002;122:1994–2002. doi: 10.1378/chest.122.6.1994. [DOI] [PubMed] [Google Scholar]
- 3.Bilde L, Svenning A Rud, Dollerup J, et al. The cost of treating patients with COPD in Denmark – a population study of COPD patients compared with non-COPD controls. Respir Med. 2007;101:539–546. doi: 10.1016/j.rmed.2006.06.020. [DOI] [PubMed] [Google Scholar]
- 4.Jacobson L, Hertzman P, Lofdahl CG, et al. The economic impact of asthma and chronic obstructive pulmonary disease (COPD) in Sweden in 1980 and 1991. Respir Med. 2000;94:247–255. doi: 10.1053/rmed.1999.0733. [DOI] [PubMed] [Google Scholar]
- 5.Ward MM, Javitz HS, Smith WM, et al. Direct medical cost of chronic obstructive pulmonary disease in the USA. Respir Med. 2000;94:1123–1129. doi: 10.1053/rmed.2000.0933. [DOI] [PubMed] [Google Scholar]
- 6.Wilson L, Devine EB, So K. Direct medical costs of chronic obstructive pulmonary disease: chronic bronchitis and emphysema. Respir Med. 2000;94:204–213. doi: 10.1053/rmed.1999.0720. [DOI] [PubMed] [Google Scholar]
- 7.Boulenger S, Nixon J, Drummond M, et al. Can economic evaluations be made more transferable? Eur J Health Econ. 2005;6:334–346. doi: 10.1007/s10198-005-0322-1. [DOI] [PubMed] [Google Scholar]
- 8.Borg S, Ericsson A, Wedzicha J, et al. A computer simulation model of the natural history and economic impact of chronic obstructive pulmonary disease. Value Health. 2004;7:153–167. doi: 10.1111/j.1524-4733.2004.72318.x. [DOI] [PubMed] [Google Scholar]
- 9.Hoogendoorn MM, Rutten-van Mölken MP, Hoogenveen RRT, et al. A dynamic population model of disease progression in COPD. Eur Respir J. 2005;26:223–233. doi: 10.1183/09031936.05.00122004. [DOI] [PubMed] [Google Scholar]
- 10.Oostenbrink JB, Rutten-van Mölken MP, Monz BU, et al. Probabilistic Markov model to assess the cost-effectiveness of bronchodilator therapy in COPD patients in different countries. Value Health. 2005;8:32–46. doi: 10.1111/j.1524-4733.2005.03086.x. [DOI] [PubMed] [Google Scholar]
- 11.Sin DD, Golmohammadi K, Jacobs P. Cost-effectiveness of inhaled corticosteroids for chronic obstructive pulmonary disease according to disease severity. Am J Med. 2004;116:325–331. doi: 10.1016/j.amjmed.2003.09.027. [DOI] [PubMed] [Google Scholar]
- 12.Anthonisen NR, Connett JE, Kiley JP, et al. Effects of smoking intervention and the use of an inhaled anticholinergic bronchodilator on the rate of decline of FEV1. The Lung Health Study. JAMA. 1994;272:1497–1505. [PubMed] [Google Scholar]
- 13.Buist AS, Vollmer WM, Sullivan SD, et al. The Burden of Obstructive Lung Disease Initiative (BOLD): rationale and design. COPD. 2005;2:277–283. [PubMed] [Google Scholar]
- 14.Rabe KF, Hurd S, Anzueto A, et al. Global Strategy for the Diagnosis, Management, and Prevention of COPD - 2006 Update. Am J Respir Crit Care Med. 2007;176:532–555. doi: 10.1164/rccm.200703-456SO. [DOI] [PubMed] [Google Scholar]
- 15.Rutten-van Mölken M, Lee TA. Economic modeling in chronic obstructive pulmonary disease. Proc Am Thorac Soc. 2006;3:630–634. doi: 10.1513/pats.200603-095SS. [DOI] [PubMed] [Google Scholar]
- 16.Lee TA, Gao C-Y, Walter B, et al. Rate of disease progression in patients with COPD in the Framingham Heart Study cohort. Chest Meeting Abstracts. 2006;130:97S. [Google Scholar]
- 17.American Thoracic Society Standardization of Spirometry, 1994 Update. Am J Respir Crit Care Med. 1995;152:1107–1136. doi: 10.1164/ajrccm.152.3.7663792. [DOI] [PubMed] [Google Scholar]
- 18.Hankinson JL, Odencrantz JR, Fedan KB. Spirometric reference values from a sample of the general US population. Am J Respir Crit Care Med. 1999;159:179–187. doi: 10.1164/ajrccm.159.1.9712108. [DOI] [PubMed] [Google Scholar]
- 19.Statistics Norway Table 03026: Population, by sex and one year age groups. [Date last accessed: September 23, 2008]. http://statbank.ssb.no//statistikkbanken/default_fr.asp?PLanguage=1.
- 20.Bakke PS, Baste V, Hanoa R, et al. Prevalence of obstructive lung disease in a general population: relation to occupational title and exposure to some airborne agents. Thorax. 1991;46:863–870. doi: 10.1136/thx.46.12.863. [DOI] [PMC free article] [PubMed] [Google Scholar]
- 21.Briggs A, Sculpher M. An introduction to Markov modelling for economic evaluation. Pharmacoeconomics. 1998;13:397–409. doi: 10.2165/00019053-199813040-00003. [DOI] [PubMed] [Google Scholar]
- 22.Mannino DM, Buist AS, Petty TL, et al. Lung function and mortality in the United States: data from the First National Health and Nutrition Examination Survey follow up study. Thorax. 2003;58:388–393. doi: 10.1136/thorax.58.5.388. [DOI] [PMC free article] [PubMed] [Google Scholar]
- 23.WHO Statistical Information System (WHOSIS) WHO Mortality Database. [Date last accessed: September 22, 2008]. www.who.int/whosis/mort/download/en/index.html.
- 24.Johannessen A, Omenaas E, Bakke P, et al. Incidence of GOLD-defined chronic obstructive pulmonary disease in a general adult population. Int J Tuberc Lung Dis. 2005;9:926–932. [PubMed] [Google Scholar]
- 25.Statistics Norway [Date last accessed: March 16, 2008]. www.ssb.no.
- 26.Statistics Iceland [Date last accessed: March 16, 2008]. www.statice.is.
- 27.Samet JM. The 1990 report of the Surgeon General: the health benefits of smoking cessation. Am Rev Respir Dis. 1990;142:993–994. doi: 10.1164/ajrccm/142.5.993. [DOI] [PubMed] [Google Scholar]
- 28.CDC Smoking cessation during previous year among adults - United States, 1990 and 1991. MMWR. 1993;42:504–507. [PubMed] [Google Scholar]
- 29.Andersson F, Borg S, Jansson SA, et al. The costs of exacerbations in chronic obstructive pulmonary disease (COPD) Respir Med. 2002;96:700–708. doi: 10.1053/rmed.2002.1334. [DOI] [PubMed] [Google Scholar]
- 30.Norges Bank [Date last accessed: March 16, 2008]. www.norges-bank.no/Pages/Article____41230.aspx.
- 31.The Central Bank of Iceland [Date last accessed: March 16, 2008]. www.sedlabanki.is/?PageID=183.
- 32.Statistics Iceland General government total expenditure in details by functions 1998–2006. [Date last accessed: August 25, 2008]. http://statice.is/?PageID=1269&src=/temp_en/Dialog/varval.asp?ma=THJ05142%26ti=General+government+total+expenditure+in+details+by+functions+1998%2D2006%26path=./Database/thjodhagsreikningar/fjarmal_opinber/%26lang-1%26units=Million%20ISK/percent.
- 33.Statistics Norway System of Health Accounts, 1997–2007. [Date last accessed: August 25, 2008]. www.ssb.no/english/subjects/09/01/helsesat_en/
- 34.Eagan TM, Eide GE, Gulsvik A, et al. Nonresponse in a community cohort study: predictors and consequences for exposure-disease associations. J Clin Epidemiol. 2002;55:775–781. doi: 10.1016/s0895-4356(02)00431-6. [DOI] [PubMed] [Google Scholar]
- 35.Feenstra TL, van Genugten ML, Hoogenveen RT, et al. The impact of aging and smoking on the future burden of chronic obstructive pulmonary disease: a model analysis in the Netherlands. Am J Respir Crit Care Med. 2001;164:590–596. doi: 10.1164/ajrccm.164.4.2003167. [DOI] [PubMed] [Google Scholar]
- 36.Wouters EFM. Economic analysis of the confronting COPD survey: an overview of results. Respir Med. 2003;97:S3–S14. doi: 10.1016/s0954-6111(03)80020-3. [DOI] [PubMed] [Google Scholar]
- 37.Hardie JA, Buist AS, Vollmer WM, et al. Risk of over-diagnosis of COPD in asymptomatic elderly never-smokers. Eur Respir J. 2002;20:1117–1122. doi: 10.1183/09031936.02.00023202. [DOI] [PubMed] [Google Scholar]
- 38.Johannessen A, Lehmann S, Omenaas ER, et al. Post-bronchodilator spirometry reference values in adults and implications for disease management. Am J Respir Crit Care Med. 2006;173:1316–1325. doi: 10.1164/rccm.200601-023OC. [DOI] [PubMed] [Google Scholar]
- 39.Janson C, Gislason T, Suppli U, et al. Characteristics of hospitalised patients with COPD in the Nordic countries. Respir Med. 2006;100:S10–S16. [Google Scholar]
- 40.Organisation for economic co-operation and development (OECD) Purchasing Power Parities (PPP) [Date last accessed: January 2, 2009]. www.oecd.org/std/ppp.
- 41.Evans C, Crawford B. Patient self-reports in pharmacoeconomic studies. Their use and impact on study validity. Pharmacoeconomics. 1999;15:241–256. doi: 10.2165/00019053-199915030-00004. [DOI] [PubMed] [Google Scholar]