Abstract
Pancreatitis is a common and potentially lethal necro-inflammatory disease with both acute and chronic manifestations. Current evidence suggests that the accumulated damage incurred during repeated bouts of acute pancreatitis (AP) can lead to chronic disease, which is associated with an increased risk of pancreatic cancer. While parathyroid hormone-related protein (PTHrP) exerts multiple effects in normal physiology and disease states, its function in pancreatitis has not been previously addressed. Here we show that PTHrP levels are transiently elevated in a mouse model of cerulein-induced AP. Treatment with alcohol, a risk factor for both AP and chronic pancreatitis (CP), also increases PTHrP levels. These effects of cerulein and ethanol are evident in isolated primary acinar and stellate cells, as well as in the immortalized acinar and stellate cell lines AR42J and irPSCc3, respectively. Ethanol sensitizes acinar and stellate cells to the PTHrP-modulating effects of cerulein. Treatment of acinar cells with PTHrP (1-36) increases expression of the inflammatory mediators interleukin-6 (IL-6) and intracellular adhesion protein (ICAM-1), suggesting a potential autocrine loop. PTHrP also increases apoptosis in AR42J cells. Stellate cells mediate the fibrogenic response associated with pancreatitis; PTHrP (1-36) increases procollagen I and fibronectin mRNA levels in both primary and immortalized stellate cells. The effects of cerulein and ethanol on levels of IL-6 and procollagen I are suppressed by the PTH1R antagonist, PTHrP (7-34). Together these studies identify PTHrP as a potential mediator of the inflammatory and fibrogenic responses associated with alcoholic pancreatitis.
Keywords: parathyroid hormone-related protein, acute pancreatitis, acinar cells, stellate cells, inflammation, fibrosis
1. Introduction
It is well established that acute pancreatitis (AP) can be precipitated by exposure to risk factors such as smoking, hypertriglyceridemia, and, most commonly, ethanol. At the cellular level, ethanol induces acinar cell injury and stellate cell activation [1-3]. Damaged acinar cells are responsible for releasing the first inflammatory signals in response to pancreatic injury, leading to activation of the immune system [4-6]. Cytokines, chemokines and adhesion molecules are all produced by acinar cells in response to injury. Factors released from damaged acinar cells in turn activate the pancreatic stellate cells (PSC). These cells are key participants in pancreatitis after transforming from a quiescent into an “activated or myofibroblastic” state [7]. Activated PSC produce high levels of extracellular matrix (ECM) proteins, which most likely play a critical role in tissue repair following injury, but can also contribute to the pathologic fibrosis characteristic of chronic pancreatitis (CP) if unregulated [7]. Unfortunately, our current knowledge of the initial mediators of the ethanol-induced pathophysiology in pancreatic cells is still limited.
Parathyroid hormone-related protein (PTHrP), a peptide hormone with sequence homology to parathyroid hormone (PTH) at the N-terminus, is known to exert multiple effects in both normal and disease states, where it modulates critical cellular functions such as proliferation, apoptosis and differentiation, in part through paracrine and/or autocrine activation of the PTH/PTHrP receptor (PTH1R), a G protein-coupled receptor (GPCR) [8-10]. In the normal pancreas, PTHrP is expressed by islet cells and regulates cell proliferation, apoptosis, and insulin release [11,12]. PTHrP has also been reported to induce a proinflammatory response in a number of pathophysiological settings, including the injured kidney, atherosclerosis and rheumatoid arthritis [13-17]. Furthermore, PTHrP plays a role in tubulointerstitial apoptosis and fibrosis after folic acid-induced nephropathy [18]. These effects of PTHrP are mediated via both autocrine and paracrine pathways [13-18]. In this study, we asked whether PTHrP plays a role in the inflammatory response and fibrosis which accompany alcohol-induced pancreatitis. We show that PTHrP levels are transiently elevated in a mouse model of cerulein-induced AP. Treatment with ethanol also increases PTHrP levels. These effects of cerulein and ethanol are evident in primary and immortalized acinar and stellate cells. In addition, ethanol sensitizes the pancreas to the PTHrP-modulating effects of cerulein. Treatment of acinar cells with PTHrP (1-36) increases expression of the inflammatory mediators interleukin-6 (IL-6) and intracellular adhesion protein (ICAM-1), as well as apoptosis. PTHrP (1-36) also increases procollagen I and fibronectin mRNA levels in primary and immortalized stellate cells. The cerulein- and ethanol-induced upregulation of IL-6 and procollagen I are suppressed by the PTH1R antagonist PTHP (7-34). These studies identify PTHrP as a potential mediator of the inflammatory and fibrogenic responses evident in alcoholic pancreatitis.
2. Materials and Methods
2.1. Materials
Fetal bovine serum (FBS) was obtained from Atlanta Biologicals (Norcross, GA). Tissue culture supplies were purchased from Gibco (Carlsbad, CA). Antibodies for Western blot analysis, immunohistochemistry and immunofluorescence were obtained from Santa Cruz Biotechnology (Santa Cruz, CA). PTHrP (1-36) and PTHrP (7-34) were purchased from Bachem (Torrance, CA). Alexa Fluor 488 and Alexa Fluor 594 were obtained from Invitrogen (Carlsbad, CA).
2.2. Treatment with ethanol in vivo
All animal experiments were carried out under an Institutional Animal Care and Use Committee-approved protocol. C57BL/6 mice (Harlan Laboratories, Indianapolis, IN) received ethanol (3.2 g/kg; administered in a 33.3% ethanol:67.7% water solution) by ip injection once a day for 7 days [19]. Control mice received water. Mice were sacrificed 2 days after the last ethanol injection. A portion of the pancreas was flash frozen and stored at −80°C for Western blot analysis. The other portion was fixed for immunohistochemistry (IHC) and immunofluorescence analyses.
2.3. Treatment with cerulein in vivo
Pancreatitis was induced in C57BL/6 mice (Harlan Laboratories) by in t r ap er it o n eal (ip ) in ject io n o f cer ulein (50 μg/kg) at 1 h intervals [20]. Different groups of mice received 1 to 9 injections, and mice were sacrificed 1 h after the last injection. For longer term studies, mice were sacrificed 16 h after the last injection. Control mice were injected with PBS, using the same injection schedule. Pancreata were harvested and processed as described in Section 2.2.
2.4. Preparation of primary acinar and stellate cells
Primary pancreatic acinar and stellate cells were isolated as described [21,22]. Briefly, pancreata were removed from 2-3 mice sacrificed under anesthesia, and washed quickly with 3 ml isolation buffer (0.1% BSA-PBS with 10 μg/ml trypsin inhibitor). Pancreatic tissue was finely minced with scissors and digested with collagenase type IV (1 mg /ml) (Invitrogen) for 15 min at 370 C with vigorous shaking. Collagenase was inactivated by addition of 6 ml cold isolation buffer. Cells were washed 3 times in cold isolation buffer. The cell suspension was filtered through 70 μm mesh and cells were spun and resuspended in 10 ml of 10% FBS-DMEM containing 0.025% trypsin inhibitor. The identity of acinar cells was verified by measuring secreted amylase levels, using the Phadebas® Amylase Test kit (Lund, Sweden).
The identity of stellate cells was verified by staining with Oil Red O (Sigma) and α-smooth muscle actin (α-SMA). The absence of acinar cell contamination in stellate cells cultures was verified by measuring amylase levels in the stellate cell culture medium. For acinar cell culture, cells were plated onto 6-well dishes coated with 50 μg/ml laminin (Invitrogen). Treatment was initiated 24 h after plating. Stellate cells were plated onto 6-well dishes. Treatments were initiated when cells reached 70-80% confluence.
2.5. Cell culture and treatment
AR42J and Saos-2 cells were obtained from the American Type Culture Collection (ATCC, Manassas, VA). AR42J cells were grown at 37 °C in a humidified 95% O2/5% CO2 atmosphere in F12-K medium supplemented with L-glutamine and 20% FBS. Saos-2 cells were grown under the same conditions in McCoy’s 5a medium supplemented with L-glutamine and 15% FBS. The irPSCc3 rat pancreatic stellate cell line was obtained from Dr. Raul A. Urrutia (Mayo Clinic Cancer Center, MN) [23] and was grown under the same conditions in DMEM high glucose medium supplemented with 10% FBS and L-glutamine.
For all experiments requiring the preparation of RNA, AR42J, irPSCc3 and Saos-2 cells were plated in 6-well dishes. When the cells were ~ 70% confluent, they were serum-starved for 16 h. The cells were then treated with cerulein (10−9 M to 10−7 M), ethanol (5 mM to 50 mM), cerulein (10−8 M) plus ethanol (10 mM), or PTHrP (1-36) (10−7 M) for the time-intervals indicated in the Results section. The treatment protocols utilized in the Results section were chosen for further studies after performing the dose-response and time-course experiments. Cerulein (10−8 M) and ethanol (10 mM) represent the highest dose at which individual treatment had no effect. An effect was observed after individual treatment with a dose of 10−7 M cerulein or doses of 25 mM or higher of ethanol. In some experiments, the cells were pre-treated for 1 h with the PTH1R antagonist PTHrP (7-34) (10−5 M) prior to treatment with cerulein, ethanol or PTHrP (1-36).
2.6. Immunohistochemistry
Portions of the dissected pancreata were fixed immediately in 10% neutral buffered formalin for 24 h at room temperature after harvesting, and then placed in 70% ethanol. Formalin-fixed tissues were embedded in paraffin, and sections (5 μm) were cut from the paraffin blocks. The sections were deparaffinized in xylene, and rehydrated in descending ethanol series. Protein staining was performed using the DAKO EnVision Kit (Dako Corporation, Carpinteria, CA). Briefly, sections were incubated overnight at 4 °C with monoclonal antibodies (diluted in 0.05 mol/L Tris-HCl + 1% BSA) against PTHrP (N-19 and H-137), PTH1R or α-SMA (Santa Cruz Biotechnology, Inc.). After 3 washes with TBST, the sections were incubated for 30 min with secondary antibody labeled with peroxidase, then washed 3 times with TBST. Lastly, peroxidase substrate DAB was added for staining. All sections were counterstained with haematoxylin and observed by light microscopy. For negative controls, sections were incubated with rabbit IgG (Santa Cruz Biotechnology) in place of the primary antibody. To detect the presence of markers of pancreatitis, sections were stained with hematoxylin and eosin. Images were recorded using an Olympus BX51 microscope microscope at 40 x and 100 x magnification.
For IHC staining of primary stellate cells and the AR42J and irPSCc3 cell lines, the cells were grown to 70% confluence in 8-well chamber slides before treatment. Primary acinar cells were treated 24 h after plating. After treatment, the cells were fixed in 95 % ethanol and stained as described above.
2.7. Immunofluorescence
Pancreas sections and cells were processed as described in Section 2.6. They were then co-incubated with anti-PTHrP antibody and anti-GFAP antibody overnight. After washing 3 times with TBST, the sections were incubated in the dark for 1 h with Alexa Fluor 488 and Alexa Fluor 594. The sections were then washed 3 times with TBST in the dark. Nuclei were counterstained with DAPI.
2.8. Analysis of mRNA levels
Total RNA was extracted using the RNAqueous® isolation kit (Ambion Inc., Austin, TX), per the manufacturer’s protocol. RNA concentrations were determined by spectrophotometry. RNA (2.0 μg) was reverse transcribed into cDNA using the Applied Biosystems cDNA synthesis kit, per the manufacturer’s protocol. The first-strand cDNA was then used as a template for real-time PCR on an Applied Biosystems 7500 Real-Time PCR System using Sybr green Supermix (Applied Biosystems) and the primers described in Table 1 [24-39]. The threshold cycle (CT) values for each target gene were normalized to levels of β-actin or GAPDH (Table 1), and the relative expression level of each target gene was calculated using the formula n-fold change = 2−ΔCT, where ΔCT represents CT (target sample) − CT (control).
Table 1.
List of primers used in reverse transcription/real-time PCR
| Primers | Forward primer 5′- 3′ | Reverse primer 5′- 3′ | References |
|---|---|---|---|
| Human | |||
| PTHR1 | CTCTTTGGCGTCCACTACATTG | TTGAGGAACCCATCGTCCTTG | 24 |
| GAPDH | CATGACAACTTTGGTATCGTGG | CCTGCTTCACCACCTTCTTG | 25 |
| Mouse | |||
| PTHR1 | GCTGTGTGCAGAACTTCCTT | TAGGCGGTGGCGATGGGGAC | 26 |
| PTHrP | GCTCGTGCCTCTTGCCTACA | CGTGTTCTCCTCGTCCTTGA | 27 |
| IL-6 | TGGAGTCACAGAAGGAGTGGCTAAG | TCTGACCACAGTGAGGAATGTCCAC | 28 |
| ICAM-1 | GGGACCACGGAGCCAATT | CTCGGAGACATTAGAGAACAATGC | 29 |
| Procollagen-1 | GGTCCCAAAGGTGCTGATGG | GACCAGCCTCACCACGGTCT | 30 |
| Fibronectin | TGCCTCGGGAATGGAAAG | TTCCCATCGTCATAGCAGTT | 31 |
| CCKR-1 | TCTGGAGCTCTACCAAGGAATC | GACCACAATGACAATGAGCATG | 32 |
| CCKR-2 | CTCGTATCCGCGGAACCGGGACCA | TATCACCATCAAAGCGGAGCCCTAGG | 33 |
| Actin | TCACCCACACTGTGCCCATCTACGA | GGATGCCACAGGATTCCATACCCA | 28 |
| Rat | |||
| PTHR1 | GGGCACAAGAAGTGGATCAT | GGCCATGAAGACGGTGTAGT | 34 |
| PTHrP | CAGCCGAAATCAGAGCTACC | CTCCTGTTCTCTGCGTTTCC | 34 |
| IL-6 | TCCTACCCCAACTTCCAATGCTC | TTGGATGGTCTTGGTCCTTAGCC | 35 |
| ICAM-1 | CCCCACCTACATACATTCCTAC | ACATTTTCTCCCAGGCATTC | 36 |
| Procollagen-1 | AAGGGTGAGACAGGCGAACAA | TTGCCAGGAGAACCAGCAGAG | 37 |
| Fibronectin | TTATGACGACGGGAAGACCT | GCTGGAT GGAAAGATTACTC | 38 |
| CCKR-1 | GTGCTGATTCGAAACAAGAGG | AGATGGCTACCAGGTTGAAGG | 39 |
| CCKR-2 | ACCTAGGACTCCACTTTGATGG | GTGTGGTTAGCGTTGTCATCTC | 39 |
| Actin | AAGTCCCTCACCCTCCCAAAAG | AAGCAATGCTGTCACCTTCCC | 35 |
2.9. Western blot analysis
Frozen pancreatic tissue was homogenized in cold 1 x lysis buffer as described [40]. Cells were washed twice with cold PBS on ice and lysed in RIPA buffer containing a Protease Inhibitor cocktail and Phosphatase Inhibitor cocktails A and B (Santa Cruz Biotechnology). Protein concentrations were estimated using the Bio-Rad protein assay. Protein levels were analyzed by Western blot analysis as previously described [41]. GAPDH was used as loading control. The signals were detected using the SuperSignal West Pico Substrate kit (Pierce Biotechnology Inc., Rockford, IL). Densitometric analysis was performed using the Alpha Innotech Image Analysis system (Alpha Innotech Corporation, San Leandro, CA).
2.10. Measurement of apoptosis
To measure apoptosis, cells were plated in 96-well dishes (1 × 10⁴ cells/well) in medium containing 10% FBS. When the cells were ~ 70% confluent, they were serum-starved for 16 h. They were then treated with 10−7 M PTHrP (1-36) for the indicated time intervals. The level of apoptosis was measured using the Cell Death Detection ELISA PLUS kit (Roche Applied Science, Indianapolis, IN). Briefly, the cells were lysed for 30 min at room temperature by incubation with 200 μl of lysis buffer. After centrifugation (10 min at 200 x g), 20 μl of the supernatant was transferred onto a streptavidin-coated microplate for quantitation at 405 nm per the manufacturer’s protocol.
2.11. Statistics
Numerical data are presented as the mean ± standard error of the mean (S.E.M). The data were analyzed by one-way analysis of variance (ANOVA) followed by a Tukey-Kramer multiple comparisons post-test to determine the statistical significance of differences. All statistical analyses were performed using INSTAT Software (GraphPad Software, Inc., San Diego, CA).
Results
3.1. Cerulein increases PTHrP levels in the exocrine pancreas
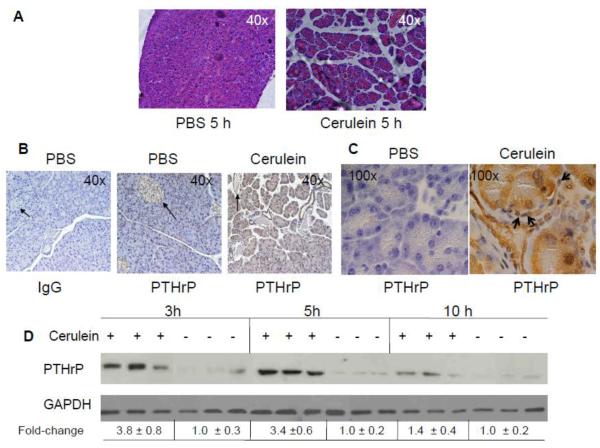
To assess whether PTHrP levels are altered during the process of AP, experimental pancreatitis was induced by repeated hourly injection of cerulein [20]. One hour after 4 cerulein injections (t = 5 h), necrosis and edema were observed in the pancreatic sections (Fig. 1A). No necrosis or edema was observed in control mice given hourly injections of an equivalent volume of PBS (Fig. 1A).
Figure 1. PTHrP levels in the pancreas of mice injected with cerulein to induce acute pancreatitis.
(A) H&E staining of pancreatic sections. (B and C) Immunostaining for PTHrP in pancreatic sections from cerulein-treated mice. An anti-PTHrP antibody (N-19) was used. IgG was used as negative control. (B) Magnification x 40. Representative islets are indicated by arrows. (C) Magnification x 100. Representative stellate cells are indicated by arrows. (D) Western blot analysis for PTHrP in the pancreas of cerulein-treated mice, sacrificed at the indicated time intervals. Treated with: + = injected with cerulein, − = injected with PBS (control). Equal loading was confirmed by re-probing for GAPDH. Data from three mice/time-point are shown. The relative PTHrP levels were obtained after densitometric scanning of the Western blots and normalization to GAPDH. The control value (−) was set at 1.0. The mean ± SEM values represent data from six mice per time-point.
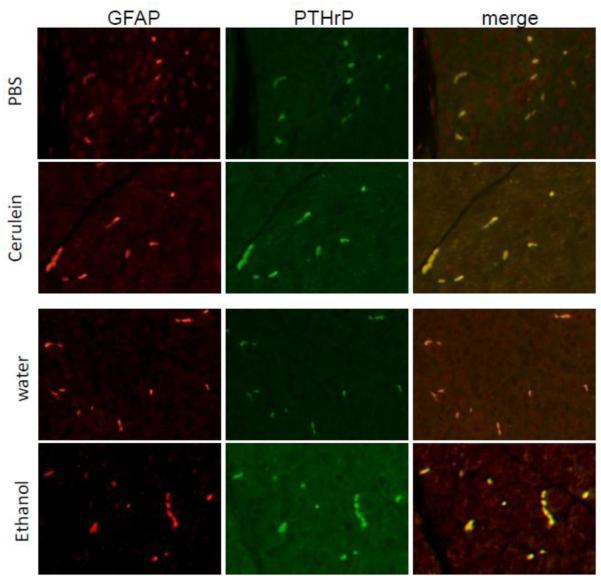
In control mice, robust PTHrP immunostaining was limited to the pancreatic islets (Fig. 1B). As previously reported [11], no detectable staining was evident in the acinar and stellate cells (Fig. 1, B and C). In contrast, the pancreata of mice treated with cerulein (4 cerulein injections, t = 5 h) showed significantly elevated levels of PTHrP in both acinar cells (Fig. 1, B and C) and stellate cells, which surround or are located in the interstitial spaces between the acini (Fig. 1C). PTHrP levels in islets were not visibly altered after cerulein treatment (Fig. 1B). These data, generated using the N-19 antibody, were reproduced with a second anti-PTHrP antibody (H-137), confirming the specificity and reproducibility of the response (data not shown). Co-staining with PTHrP and glial fibrillary protein (GFAP), a stellate cell marker expressed in both quiescent and activated stellate cells [7], confirmed an increase in PTHrP levels in stellate cells after cerulein treatment (Fig. 2). PTHrP levels were also elevated in the acini, as evident by an increase in green (PTHrP) fluorescence (Fig. 2).
Figure 2. Co-localization of PTHrP and GFAP in stellate cells of mice injected with cerulein or ethanol.
Upper panels: mice received 4 cerulein injections (t = 5 h). PBS was used as vehicle control. Mice were sacrificed 1 h after the last injection. Lower panels: mice were injected with ethanol (3.2 g/kg) intraperitoneally once a day for 7 days. Control mice received water. Mice were sacrificed 2 days after the last ethanol injection. First column, GFAP localization; second column, PTHrP localization; third column, overlay of the first and second columns. Increased green immunofluorescence in acinar cells after treatment with cerulein or ethanol is also evident.
Western blot analysis showed that PTHrP levels increased transiently, with maximal expression observed at the 3 h and 5 h time points, or after 2 and 4 injections of cerulein, respectively (Fig. 1D). At 10 h, 1 h after 9 injections of cerulein, PTHrP levels had declined (Fig. 1D). PTHrP levels returned to baseline levels by 14 h after the last cerulein injection (t = 24 h) (data not shown).
3.2. Ethanol increases PTHrP levels in the exocrine pancreas
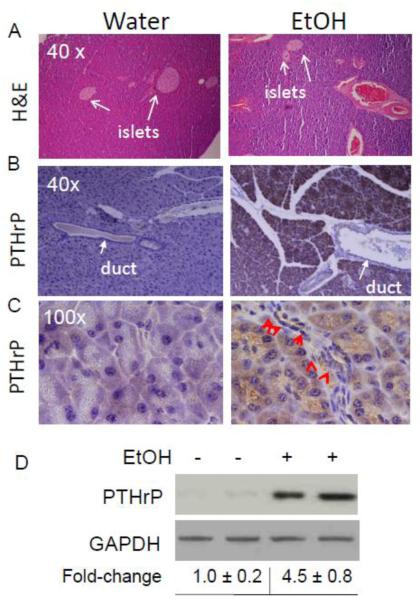
Mice injected with ethanol showed physiological signs of intoxication within minutes of the injection, manifested as decreased motor activity. A low level of fibrosis was evident in the pancreata of mice injected with 3.2 g/kg of ethanol once daily for a total of 7 days (Fig. 3A). Mice injected with an equivalent volume of water had no evidence of fibrosis (Fig. 3A). Similar to cerulein, treatment with ethanol significantly increased PTHrP levels in acinar and stellate cells (Fig. 3, B - D). Co-staining with PTHrP and GFAP confirmed the increase in PTHrP levels in stellate cells after ethanol treatment (Fig. 2). PTHrP levels were also elevated in the acini after ethanol treatment, as evident by an increase in green (PTHrP) fluorescence (Fig. 2).
Figure 3. PTHrP levels in the pancreas of mice injected with ethanol.
Mice were injected with ethanol (3.2 g/kg) intraperitoneally once a day for 7 days. Control mice received water. Mice were sacrificed 2 days after the last ethanol injection. (A) H&E staining of pancreatic sections. Arrows point to islets. (B and C) IHC analysis. Immunostaining for PTHrP was performed using an anti-PTHrP antibody (N-19). (B) Magnification x 40. (C) Magnification x 100. Arrows point to stellate cells. (D) Western blot analysis for PTHrP in the pancreas of ethanol-treated mice. Treated with: + = injected with ethanol, − = injected with water (control). Equal loading was confirmed by re-probing for GAPDH. Data from two mice/treatment are shown. The relative PTHrP levels were obtained after densitometric scanning of the Western blots and normalization to GAPDH. The control value (−) was set at 1.0. The mean ± SEM values represent data obtained from five mice.
3.3. Cerulein and ethanol increase PTHrP levels in primary acinar cells and AR42J cells
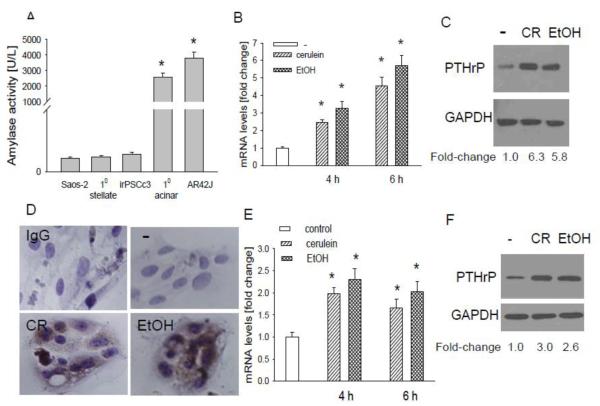
Using primary mouse acinar cells, here we asked whether the effect of cerulein and ethanol on PTHrP levels in vivo (Figs. 1-3) is direct or mediated indirectly, as may occur through the release of factors from the immune cells secondary to pancreatic injury. The identity of the primary acinar cells was confirmed by measuring amylase secretion. The human osteosarcoma cell line Saos-2 and stellate cells were used as negative controls. Both primary acinar cells and the acinar cell line AR42J secreted amylase (Fig. 4A). No amylase was detected in the supernatant from Saos-2 cells and stellate cells (Fig. 4A). Primary acinar cells express the CCK-1 receptor [42]. Treating these cells with cerulein (10−7 M) or ethanol (50 mM) increased PTHrP mRNA levels, as determined by reverse transcription/real time PCR. The effect of cerulein and ethanol was comparable, with a 3 to 5-fold increase in PTHrP mRNA levels observed at the 4 h and 6 h time-points (Fig. 4B). No significant effect was observed after 2 h treatment (data not shown). Ethanol and cerulein also increased PTHrP protein levels, as determined by Western blot analysis and immunostaining (Fig. 4, C and D),
Figure 4. Effect of cerulein and ethanol on PTHrP levels in pancreatic acinar cells.
(A) Amylase secretion from mouse primary acinar cells and AR42J cells. Saos-2 (human osteosarcoma) cells and stellate cells were used as negative controls. (B-D) Effect of cerulein and ethanol on PTHrP levels in primary acinar cells. (B) Acinar cells were treated with cerulein (10−7 M) or ethanol (50 mM) for the indicated time intervals. PTHrP mRNA levels were measured by reverse transcription/real-time PCR. Values are expressed relative to the untreated value, set arbitrarily at 1.0. Each bar is the mean ± SEM of three independent experiments. * = Significantly different from the control value (P < 0.001). (C) Western blot analysis for PTHrP in acinar cells treated with cerulein (CR) or ethanol (EtOH) as described in (B) for 6 h. (D) Acinar cells treated as described in (B) for 6 h were fixed and analyzed by IHC. − = no treatment. IgG = antibody control. The panels other than IgG were immunostained with anti-PTHrP antibody. (E-F) Effect of cerulein and ethanol on PTHrP levels in AR42J cells. Cells were treated with cerulein or ethanol as in (B). (E) PTHrP mRNA levels were measured by reverse transcription/real-time PCR. Values are expressed relative to the untreated value, set arbitrarily at 1.0. Each bar is the mean ± SEM of three independent experiments. * = Significantly different from the untreated value (P < 0.001). (F) Western blot analysis for PTHrP in AR42J cells treated with CR or EtOH as described in (B) for 6 h. In (C) and (F), the relative PTHrP levels were obtained after densitometric scanning of the Western blots and normalization to GAPDH. The control value (−) was set at 1.0. The mean ± SEM values represent data obtained from three independent experiments.
We also measured the response of AR42J cells to cerulein and ethanol. These cells also express the CCK1 and CCK2 receptors [43] and secrete amylase (Fig. 4A). Treatment of these cells with cerulein (10−7 M) or ethanol (50 mM) for 4 h or 6 h resulted in an increase in PTHrP mRNA and protein levels (Fig. 4, E and F). However, the magnitude of the increase was lower than that in primary acinar cells (Fig. 4, B and C vs. E and F). As in primary cells, no significant effect was observed after 2 h treatment (data not shown).
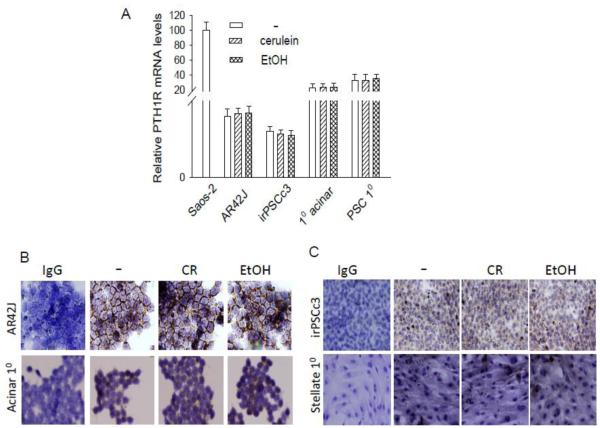
Autocrine/paracrine PTHrP action is mediated through activation of the PTH1R [8-10]. Here we show that mouse primary acinar cells and AR42J cells express the PTH1R, as shown by reverse transcription/real time PCR and IHC (Fig. 5, A and B). PTH1R mRNA levels are presented relative to those in Saos-2 cells, which express high PTH1R levels [44]. Treatment with cerulein or ethanol had no effect on PTH1R levels in the acinar cells (Fig. 5A and B), indicating that the increase in PTHrP levels after cerulein and ethanol treatment does not result in downregulation of PTHR1 levels. The presence of PTH1R in these cells confirms the potential for autocrine/paracrine PTHrP signaling, as well as the capability for the increased PTHrP signaling that occurs secondary to the elevated PTHrP levels observed after cerulein and ethanol treatment.
Figure 5. PTH1R levels in acinar and stellate cells treated with cerulein or ethanol.
(A) Primary (10) acinar and stellate cells, AR42J (acinar) and iPSCc3 (stellate) cells were treated with cerulein (10−7 M) or ethanol (50 mM) for 4 h. Saos-2 cells were used as positive control. PTH1R mRNA levels were measured by reverse transcription/real-time PCR. Values are expressed relative to the Saos-2 value, set arbitrarily at 100. Each bar is the mean ± SEM of three independent experiments. (B and C) IHC analysis for PTH1R in cells treated with cerulein (CR) or ethanol (EtOH) as described in (A). − = no treatment. IgG = antibody control. The panels other than IgG were immunostained with anti-PTH1R antibody.
3.4. Cerulein and ethanol increase PTHrP levels in primary stellate cells and irPSCc3 cells
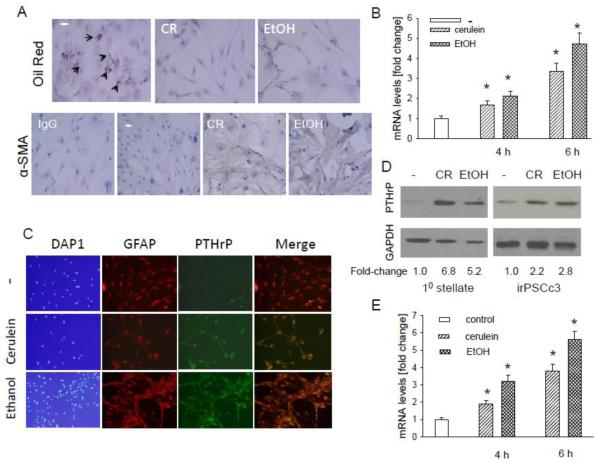
In vivo administration of cerulein and ethanol also increases PTHrP levels in stellate cells (Figs. 1-3). Using primary mouse stellate cells, here we asked whether this effect is direct. These primary cells also express the PTH1R (Fig. 5, A and C), as well as the CCK-1 and CCK-2 receptors [45]. To confirm absence of acinar cell contamination in the primary stellate cell cultures, we measured secreted amylase levels in the conditioned medium from the stellate cells. No amylase was detected in the conditioned medium from stellate cell cultures (Fig. 4A). Staining with Oil Red O and α-SMA was used to distinguish the relative levels of quiescent and activated cells. In control cells, ~5% of the cells were in a quiescent state (Fig. 6A). No quiescent cells were detected after treatment with 10−7 M cerulein or 50 mM ethanol (Fig. 6A). Treatment with cerulein or ethanol also resulted in an increase in α-SMA levels (Fig. 6A), indicating activation of the stellate cells. Treating these cells for 4 h or 6 h with the doses of cerulein or ethanol indicated above increased PTHrP mRNA levels, as determined by reverse transcription/real time PCR. The effect of cerulein and ethanol was comparable (Fig. 6B). No effect was observed after 2 h treatment (data not shown). Ethanol and cerulein also increased PTHrP protein levels as determined by Western blot analysis and immunofluorescence (Fig. 6, C and D). Immunofluorescence demonstrated co-localization of PTHrP and GFAP in the stellate cells (Fig. 6C).
Figure 6. Effect of cerulein and ethanol on PTHrP levels in pancreatic stellate cells.
(A) Detection of vitamin A-containing lipid droplets and α-smooth muscle actin (α-SMA) in primary stellate cells treated with cerulein (CR) or ethanol (EtOH). Cells were treated with cerulein (10−7 M) or ethanol (50 mM) for 4 h. Vitamin A-containing lipid droplets were detected using Oil Red O. Representative positive cells are indicated by arrows. − = no treatment. In the α-SMA panels, IgG = antibody control. The panels other than IgG were immunostained with anti-α-SMA antibody. (B-E) Effect of cerulein and ethanol on PTHrP levels in primary stellate cells and iPSCc3 cells. (B and E) Cells were treated with cerulein (10−7 M) or ethanol (50 mM) for the indicated time intervals. PTHrP mRNA levels were measured by reverse transcription/real-time PCR. Values are expressed relative to the untreated value, set arbitrarily at 1.0. Each bar is the mean ± SEM of three independent experiments. * = Significantly different from the control value (P < 0.001). (C) Cells treated as described in (B and E) for 6 h were fixed and analyzed by immunofluorescence for the presence of GFAP and PTHrP. − = no treatment. (D) Western blot analysis for PTHrP in cells treated with CR or EtOH as described in (C).
We also measured the response of the rat stellate cell line irPSCc3 to cerulein and ethanol. These cells have been extensively characterized [23]. They also express the CCK1 and CCK2 receptors at levels comparable to those observed in primary stellate cells (data not shown). Treatment of these cells with cerulein (10−7 M) or ethanol (50 mM) for 4 h or 6 h resulted in an increase in PTHrP mRNA and protein levels (Fig. 6, D and E). No effect was observed after 2 h of treatment (data not shown).
As observed in acinar cells, treatment with cerulein or ethanol had no effect on PTH1R levels in stellate cells (Fig. 5, A and C). These data again confirm the potential for the increased PTHrP signaling that is likely to occur secondary to the elevated PTHrP levels observed after cerulein and ethanol treatment.
3.5. PTHrP increases IL-6 and ICAM-1 mRNA levels in AR42J and primary acinar cells
The inflammatory response in pancreatitis is accompanied by an increase in cytokine and chemokine levels. PTHrP exerts pro-inflammatory effects in the injured kidney, atherosclerosis and rheumatoid arthritis [13-17]. Here we measured the effects of PTHrP on IL-6 and ICAM-1 mRNA levels.
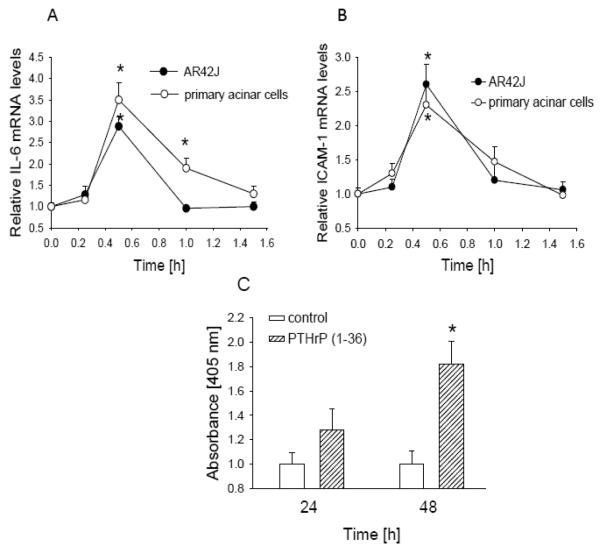
Treating AR42J cells with PTHrP increased IL-6 mRNA levels (Fig. 7A). This effect was evident after 30 min of treatment with 10−7 M PTHrP (1-36) and had returned to baseline levels within 1 h of treatment (Fig. 7A). A similar profile was observed in primary acinar cells, except that IL-6 mRNA levels returned to basal levels within 1.5 h of treatment with PTHrP (Fig. 7A). Treatment with PTHrP (1-36) also resulted in an increase in ICAM-1 mRNA levels (Fig. 7B). This effect reached a peak after 30 min of treatment and was back to basal levels within 1 h (Fig. 7B). Similar effects were again obtained in primary acinar cells (Fig. 7B).
Figure 7. Effect of PTHrP on mRNA levels of IL-6 (A) and ICAM-1 (B), and on apoptosis (C) in acinar cells.
Cells were treated with 10 −7 M PTHrP (1-36) for the indicated time intervals. IL-6 and ICAM-1 mRNA levels in primary acinar cells and in AR42J cells were measured by reverse transcription/real-time PCR. Apoptosis was measured using the Cell Death Detection ELISA PLUS kit. Values are expressed relative to the untreated value, set arbitrarily at 1.0. Each point is the mean ± SEM of three independent experiments. * = Significantly different from the control value (P < 0.001).
3.6. PTHrP increases apoptosis in AR42J cells
The inflammatory response in pancreatitis is accompanied by induction of cell death pathways. Here we asked whether PTHrP alters apoptosis in AR42J and irPSCc3 cells. Treatment with PTHrP (1-36) increased apoptosis in AR42J cells; this effect was observed after 24 h treatment but was only significant after 48 h treatment (Fig. 7C). There was no effect in irPCSc3 cells (data not shown).
3.7. PTHrP increases expression of ECM components involved in fibrosis in primary stellate cells and irPSCc3 cells
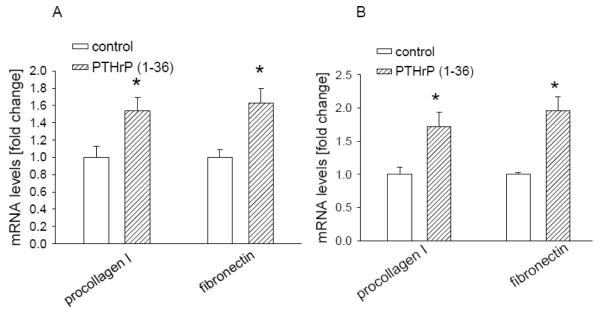
The fibrosis observed in pancreatitis is associated with increased deposition of ECM proteins. Here we asked whether PTHrP regulates expression of ECM components in stellate cells. Treatment of primary stellate cells with PTHrP (1-36) for 4 h caused a significant increase in mRNA levels of procollagen I and fibronectin (Fig. 8A). Similar effects were observed in the irPSCc3 stellate cell line (Fig. 8B). mRNA levels were still elevated after 8 h of treatment (data not shown).
Figure 8. Effect of PTHrP on procollagen I and fibronectin mRNA levels in irPSCc3 (A) and primary mouse stellate cells (B).
Cells were treated with PTHrP (1-36) for 4 h. mRNA levels were measured by reverse transcription/real-time PCR. Values are expressed relative to the untreated control value, set arbitrarily at 1.0. Each bar is the mean ± SEM of three independent experiments. * = Significantly different from the control value (P < 0.001).
3.8. PTHrP mediates the effects of cerulein and ethanol on markers of inflammation and fibrosis
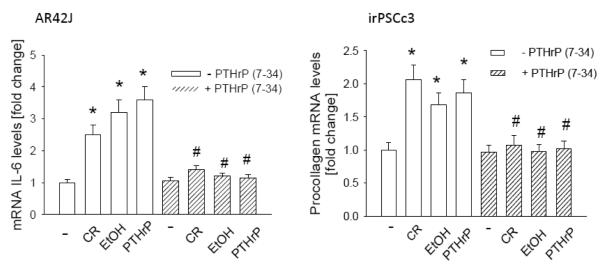
Here we investigated whether PTHrP functions as an intermediate to mediate the effects of cerulein and ethanol on markers of inflammation and fibrosis. Autocrine/paracrine PTHrP action was blocked by treatment with the PTH1R antagonist PTHrP (7-34). In AR42J cells, the presence of the antagonist blocked the PTHrP-mediated effects on IL-6 mRNA levels (Fig. 9A). Treatment with 10−7 M cerulein or 50 mM ethanol also resulted in an increase in IL-6 levels; these effects were again blocked by PTHrP (7-34) (Fig. 9A). A similar profile was obtained in irPSCc3 cells, in that treatment with PTHrP (7-34) blocked the PTHrP-mediated increase in procollagen I mRNA levels, as well as the effects of cerulein and ethanol on procollagen I mRNA levels (Fig. 9B).
Figure 9. Effect of inhibition of PTHrP action on the cerulein- and ethanol-mediated upregulation of IL-6 and procollagen I mRNA levels.
Cells were pre-treated with 10−5 M PTHrP (7-34) for 1 h, then treated in the presence of PTHrP (7-34) with 10−7 M cerulein (CR) or 50 mM ethanol (EtOH) for 4 h, or with PTHrP (1-36) for 30 min. − = control (no treatment). IL-6 mRNA levels (in AR42J cells) and procollagen I mRNA levels (in irPSCc3 cells) were measured by reverse transcription/real-time PCR. Values are expressed relative to the untreated control value, set arbitrarily at 1.0. Each bar is the mean ± SEM of three independent experiments. * = Significantly different from the control value (P < 0.001); # = significantly different from the - PTHrP (7-34) value (P < 0.001).
3.9. Ethanol sensitizes acinar and stellate cells to induce PTHrP expression upon CCK receptor stimulation
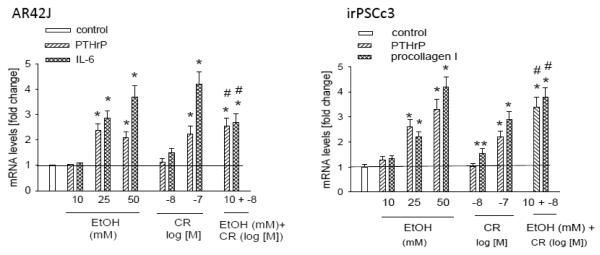
Ethanol sensitizes the pancreas to injury induced by hyperstimulation with cerulein [46, 47]. Here we asked if co-treatment with ethanol enhances the effect of cerulein on PTHrP mRNA levels. Treatment of AR42J cells with ethanol at 25 mM or higher or with cerulein at 10−7 M caused a significant increase in PTHrP mRNA levels. These effects were accompanied by an increase in levels of IL-6 (Fig. 10A). Ethanol (10 mM) or cerulein (10−8 M) alone for 4 h had no significant effect on PTHrP or IL-6 mRNA levels (Fig. 10A). However, co-treatment with both compounds caused a significant increase in both PTHrP and IL-6 mRNA levels (Fig. 10A), indicating that ethanol sensitizes these cells to induce PTHrP expression upon CCK receptor stimulation, and that this effect in turn results in upregulation of IL-6 expression.
Figure 10. Sensitization of AR42J and irPSCc3 cells to the effects of cerulein by co-treatment with ethanol.
Cells were treated with the indicated concentration for cerulein (CR) and/or ethanol (EtOH) for 4 h. PTHrP mRNA levels (in AR42J and irPSCc3 cells), IL-6 mRNA levels (in AR42J cells), and procollagen I mRNA levels (in irPSCc3 cells) were measured by reverse transcription/real-time PCR. Values are expressed relative to the untreated control value, set arbitrarily at 1.0. Each bar is the mean ± SEM of three independent experiments. * = Significantly different from the control value (P < 0.001); ** = significantly different from the control value (P < 0.05); # = significantly different from the value obtained after individual treatment with 10 mM ethanol or 10−8 M cerulein (P < 0.001).
Similar effects were observed in irPSCc3 cells, in that combination treatment with cerulein (10−8 M) and ethanol (10 mM) for 4 h caused a significant increase in PTHrP mRNA levels. These effects were accompanied by an increase in procollagen I levels (Fig. 10B). At these doses, neither compound alone had an effect on PTHrP or procollagen I mRNA levels (Fig. 10B).
Discussion
AP is a clinical syndrome which begins with an injury to the pancreas that results in an inflammatory response [1]. Chronic pancreatitis (CP) occurs as a result of relapsing episodes of AP [recurrent acute pancreatitis (RAP)] and is characterized by destruction of acinar tissue, a sustained pancreatic inflammatory response and fibrosis [46]. Both acinar and stellate cells contribute to the inflammatory and fibrogenic response associated with AP. PTHrP is normally expressed in pancreatic islets and regulates cell proliferation, apoptosis and insulin release [11,12]. However, no function for PTHrP has previously been attributed in the exocrine pancreas. In this study, we show that PTHrP levels are transiently elevated in a mouse model of AP induced by injection of the CCK analog cerulein. Exogenous addition of cerulein to primary and established acinar and stellate cells also results in increased PTHrP mRNA and protein levels. Further, exogenous addition of PTHrP (1-36) to acinar and stellate cells increases the expression of markers associated with AP. These pro-inflammatory effects of PTHrP in the exocrine pancreas mirror its effects in rheumatoid arthritis, atherosclerosis, and the obstructed inflamed kidney, where PTHrP also plays a role in the inflammatory response [13-17]. In the kidney, PTHrP expression is also associated with renal fibrosis [18].
The sentinel acute pancreatitis event (SAPE) hypothesis model of CP [47,48] divides the pathogenesis of CP into 3 sequential stages: (1) pre-AP; (2) the initial (sentinel) attack of AP (1st hit), and (3) the progression phase (2nd hit). The pre-AP stage recognizes the presence of risk factors for CP and their effects on subjects without CP. The sentinel phase is defined as the 1st episode of AP from any cause that activates the immune system (both pro- and anti-inflammatory phases). The progression stage is dependent on factors that drive the immune response through a variety of stressors. In patients with minimal stress, the pancreas recovers from AP. Progression to CP occurs in patients suffering from repeated bouts of AP. Both acinar and stellate cell injury have been implicated as contributing to the SAPE model of CP [1,47,48]. Alcohol abuse contributes to the pre-AP phase and is associated with a spectrum of pancreatic disease, ranging from acute self-limiting pancreatitis to chronic unremitting pancreatitis [reviewed in 49]. The pathobiological responses of alcoholic pancreatitis include acute and chronic inflammation and fibrosis [49]. However, less than 10% of heavy drinkers develop clinical pancreatitis and treatment of mice with ethanol alone is not accompanied by overt histological characteristics of pancreatitis.
The elevated PTHrP levels observed after ethanol treatment may be sensitizing the pancreas such that its ability to adapt and respond to stressful stimuli is diminished. This may lead to AP under conditions of further insult. PTHrP may therefore function as an early response gene that mediates the critical acute phase response in AP, thereby playing a major role in the sentinel phase of the SAPE hypothesis model. In support of this scenario, we show that co-treatment of acinar and stellate cells with ethanol and cerulein increases PTHrP mRNA levels at doses where the individual compounds have minimal or no effect. This effect is accompanied by increased expression of IL-6 and procollagen I. From these observations, we postulate that the resulting increase in PTHrP levels at the pre-AP stage initiates a cascade of events that ultimately leads to the inflammatory and fibrotic response associated with AP, and that the increase in PTHrP levels after pancreatic injury is not secondary to the inflammatory response.
Induction of inflammatory signals in pancreatitis, with particular reference to alcoholic pancreatitis, is accompanied by induction of cell death pathways, resulting in a net loss of acinar cells [50]. We show that autocrine/paracrine PTHrP action increased apoptosis of AR42J cells. Similar pro-apoptotic effects of PTHrP via an autocrine/paracrine pathway have been observed in other cell systems, including the colon cancer cell line, LoVo and the rat intestinal cell line, IEC-6 [51,52]. PTHrP also functions via an intracrine pathway [53]. While we show an effect of exogenous PTHP on apoptosis in a cell culture system, PTHrP may also alter pancreatic cell survival via an intracrine pathway in vivo. Taken together, these data indicate that the increase in PTHrP expression following pancreatic injury may contribute not only to the inflammatory response but also to a net loss of acinar cells within the exocrine pancreas.
Cerulein and ethanol also increase PTHrP mRNA and protein levels in PSC. Increasing evidence indicates that PSC are major mediators of fibrosis in chronic pancreatic injury and inflammation [54]. ECM-regulating proteins play a critical role in fibrosis [55]. We show that PTHrP increases expression of the ECM proteins procollagen I and fibronectin. Expression of these ECM components is characteristic of chronic pancreatic fibrosis [55]. Thus, the increased release of PTHrP following pancreatic injury may play a role in development of fibrosis. Since PTHrP increases procollagen I and fibronectin levels at the mRNA level, its effects are likely mediated via transcriptional and/or post-transcriptional pathways. However, ECM accumulation also results from alterations in repair and degradation. Matrix metalloproteinases (MMPs) and tissue inhibitors of matrix metalloproteinases (TIMPs) play key roles in these processes. MMP-2 and MMP-9 (gelatinase A and B) regulate fibrogenesis. MMPs are synthesized in an inactive form and require activation after they are released from cells [56]. TIMPs play a role in MMP activation. The TIMP concentration and the MMP/TIMP ratio are critical for actual pancreatic activity [56]. PSC regulate ECM remodeling during pancreatitis through the production of MMPs and TIMPs [57]. PTHrP may also regulate ECM levels indirectly, through modulation of MMP levels and/or activity, and/or TIMP levels. Some pro-fibrogenic factors are known to inhibit PSC proliferation [45]. Future studies will address the mechanisms via which PTHrP alters the fibrogenic response.
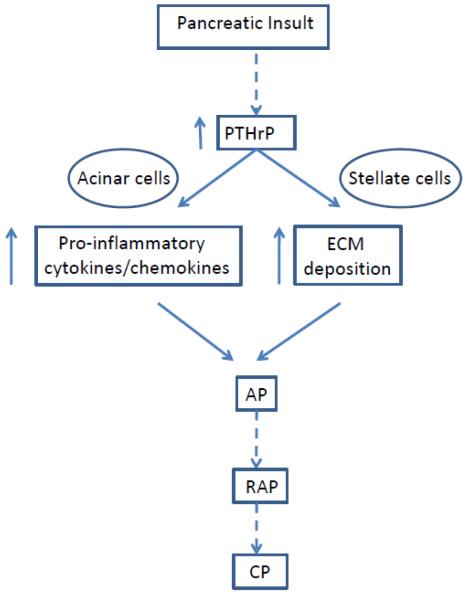
In conclusion, no function for PTHrP has previously been attributed in the exocrine pancreas. The results presented here demonstrate that treating pancreatic acinar and stellate cells with cerulein is accompanied by a transient increase in PTHrP levels. Notably, treatment with alcohol, a risk factor for pancreatitis, also increases PTHrP levels; this may lead to sensitization of the pancreas to risk factors associated with pancreatitis. PTHrP may exert autocrine/paracrine effects in both acinar and stellate cells, leading to increased expression of pro-inflammatory cytokines and chemokines, as well as ECM proteins involved in fibrosis. This in turn may lead to the development of AP. Repeated episodes of AP may eventually result in development of CP (Fig. 11). These studies provide the initial steps in continuing research that may lead to the development of antagonists of PTHrP signaling as therapeutic strategies aimed at reducing the severity of alcoholic pancreatitis.
Figure 11. Proposed pathways via which PTHrP expression contributes to development of pancreatitis.
Pancreatic insult results in a transient increase in PTHrP levels in the exocrine pancreas. Pathways activated by PTHrP increase cytokine and chemokine release and extracellular matrix deposition and activate the stellate cells, thereby exacerbating the inflammatory and fibrogenic responses that accompany AP. Repeated episodes of AP (RAP) may in turn lead to the development of chronic pancreatitis (CP).
Highlights.
PTHrP levels elevated in pancreas of mice treated with cerulein or ethanol.
Sensitization by ethanol of effects of cerulein on PTHrP levels in acinar and stellate cells.
PTHrP increases IL-6 and ICAM-1 levels in acinar cells.
PTHrP increases procollagen I and fibronectin levels in stellate cells.
PTHrP as mediator of inflammatory and fibrogenic response in pancreatitis.
Acknowledgements
We thank Dr. Dr. Raul A. Urrutia (Mayo Clinic Cancer Center, MN) for providing the irPSCc3 cell line. This work was supported by NIH grant DK035608.
Footnotes
Publisher's Disclaimer: This is a PDF file of an unedited manuscript that has been accepted for publication. As a service to our customers we are providing this early version of the manuscript. The manuscript will undergo copyediting, typesetting, and review of the resulting proof before it is published in its final citable form. Please note that during the production process errors may be discovered which could affect the content, and all legal disclaimers that apply to the journal pertain.
References
- [1].Yadav D, Whitcomb DC. The role of alcohol and smoking in pancreatitis. Nat. Rev. Gastroenterol. Hepatol. 2010;7:131–145. doi: 10.1038/nrgastro.2010.6. [DOI] [PubMed] [Google Scholar]
- [2].Cappell MS. Acute pancreatitis: etiology, clinical presentation, diagnosis, and therapy. Med. Clin. North Am. 2008;92:889–923. doi: 10.1016/j.mcna.2008.04.013. [DOI] [PubMed] [Google Scholar]
- [3].Leung PS, Ip SP. Pancreatic acinar cells: its role in acute pancreatitis. Int. J. Biochem. Cell Biol. 2006;38:1024–1030. doi: 10.1016/j.biocel.2005.12.001. [DOI] [PubMed] [Google Scholar]
- [4].Ramnath RD, Sun J, Bhatia M. Involvement of SRC family kinases in substance P-induced chemokine production in mouse pancreatic acinar cells and its significance in acute pancreatitis. J. Pharmacol. Exp. Ther. 2009;329:418–428. doi: 10.1124/jpet.108.148684. [DOI] [PMC free article] [PubMed] [Google Scholar]
- [5].Gukovsky L, Gukovskaya AS, Blinman TA, Zaninovic V, Pandol SJ. Early NF-κB activation is associated with hormone-induced pancreatitis. Amer. J. Physiol. 1998;275:G1402–G1414. doi: 10.1152/ajpgi.1998.275.6.G1402. [DOI] [PubMed] [Google Scholar]
- [6].Ramudo L, Yubero S, Manso MA, Vicente S, De Dios I. Signal transduction of MCP-1 expression induced by pancreatitis-associated ascitic fluid in pancreatic acinar cells. J. Cell. Mol. Med. 2009;13:1314–1320. doi: 10.1111/j.1582-4934.2008.00529.x. [DOI] [PMC free article] [PubMed] [Google Scholar]
- [7].Omary MB, Lugea AL, Lowe AW, Pandol SJ. The pancreatic stellate cell: a star on the rise in pancreatic disease. J. Clin. Invest. 2007;117:50–59. doi: 10.1172/JCI30082. [DOI] [PMC free article] [PubMed] [Google Scholar]
- [8].Strewler GI. Mechanisms of disease: the physiology of parathyroid hormone-related protein. N. Engl. J. Med. 2000;342:177–185. doi: 10.1056/NEJM200001203420306. [DOI] [PubMed] [Google Scholar]
- [9].Mannstadt M, Jüppner H, Gardella TJ. Receptors for PTH and PTHrP. Am. J. Physiol. 1999;277:F665–F675. doi: 10.1152/ajprenal.1999.277.5.F665. [DOI] [PubMed] [Google Scholar]
- [10].Clemens TL, Cormier S, Eichinger A, Endlich K, Fiaschi-Taesch E, Frieman PA, Karaplis AC, Massfelder T, Roosert J, Schluter KD, Silve C, Stewart AF, Takane K, Helwig JJ. Parathyroid hormone-related protein and its receptors: nuclear functions and roles in the renal and cardiovascular systems, the placental trophoblasts and the pancreatic islets. Brit. J. Phamacol. 2001;134:1113–1136. doi: 10.1038/sj.bjp.0704378. [DOI] [PMC free article] [PubMed] [Google Scholar]
- [11].Vasavada RC, Cavaliere C, D’Ercole AJ, Dann P, Burtis WJ, Madlener AL, Zawalich K, Zawalich W, Philbrick W, Stewart AF. Overexpression of parathyroid hormone-related protein in the pancreatic islet of transgenic mice causes islet hyperplasia, hyperinsulinemia, and hypoglycemia. J. Biol. Chem. 1996;271:1200–1208. doi: 10.1074/jbc.271.2.1200. [DOI] [PubMed] [Google Scholar]
- [12].Cebrian A, Garcia-Ocano A, Takane KK, Sipula D, Stewart AF, Vasavada RC. Overexpression of parathyroid hormone-related protein inhibits pancreatic β-cell death in vivo and in vitro. Diabetes. 2002;51:3003–3013. doi: 10.2337/diabetes.51.10.3003. [DOI] [PubMed] [Google Scholar]
- [13].Rámila D, Ardura JA, Esteban V, Ortega A, Ruiz-Ortega M, Bosch RJ, Esbrit P. Parathyroid hormone-related protein promotes inflammation in the kidney with an obstructed ureter. Kidney Int. 2008;73:835–847. doi: 10.1038/sj.ki.5002775. [DOI] [PubMed] [Google Scholar]
- [14].Yoshida T, Sakamotoa H, Horiuchi T, Yamamoto S, Suematsu A, Oda H, Koshihara Y. Involvement of prostaglandin E2 in interleukin-1a-induced parathyroid hormone-related peptide production in synovial fibroblasts of patients with rheumatoid arthritis. J. Clin. Endo. Metab. 2001;86:3272–3278. doi: 10.1210/jcem.86.7.7687. [DOI] [PubMed] [Google Scholar]
- [15].Martin-Ventura JL, Ortego M, Esbrit P, Hernandez-Presa MA, Ortega L, Egido J. Possible role of parathyroid hormone-related protein as a proinflammatory cytokine in atherosclerosis. Stroke. 2003;34:1783–1789. doi: 10.1161/01.STR.0000078371.00577.76. [DOI] [PubMed] [Google Scholar]
- [16].Funk JL. A role for parathyroid hormone-related protein in the pathogenesis of inflammatory/autoimmune disease. Immunopharmacology. 2001;1:1101–1121. doi: 10.1016/s1567-5769(01)00040-6. [DOI] [PubMed] [Google Scholar]
- [17].Funk JL, Wei H, Downey KJ, Yocum D, Benjamin JB, Carley W. Expression of PTHrP and its cognate receptor in the rheumatoid synovial microcirculation. Biochem. Biophys. Res. Commun. 2002;297:890–897. doi: 10.1016/s0006-291x(02)02263-5. [DOI] [PubMed] [Google Scholar]
- [18].Ortega A, Rámila D, Ardura JA, Esteban V, Ruiz-Ortega M, Barat A, Gazapo R, Bosch RJ, Esbrit P. Role of parathyroid hormone-related protein in tubulointerstitial apoptosis and fibrosis after folic-acid-induced nephrotoxicity. Am. Soc. Nephrol. 2006;17:1594–1603. doi: 10.1681/ASN.2005070690. [DOI] [PubMed] [Google Scholar]
- [19].Charrier AL, Brigstock DR. Connective tissue growth factor production by activated pancreatic stellate cells in mouse alcoholic chronic pancreatitis. Lab. Invest. 2010;90:1179–1188. doi: 10.1038/labinvest.2010.82. [DOI] [PMC free article] [PubMed] [Google Scholar]
- [20].Frossard JL, Lenglet S, Montecucco F, Steffens S, Galan K, Pelli G, Spahr L, Mach F, Hadengue A. Role of CCL-2, CCR-2 and CCR-4 in cerulein-induced acute pancreatitis and pancreatitis-associated lung injury. J. Clin. Pathol. 2011;64:387–393. doi: 10.1136/jcp.2010.088500. [DOI] [PubMed] [Google Scholar]
- [21].Kruse ML, Hildebrand PB, Timke C, Fölsch UR, Schäfer H, Schmidt WE. Isolation, long-term culture, and characterization of rat pancreatic fibroblastoid/stellate cells. Pancreas. 2001;23:49–54. doi: 10.1097/00006676-200107000-00007. [DOI] [PubMed] [Google Scholar]
- [22].Bachem MG, Schneider E, Groβ H, Weidenbach H, Schmid RM, Menke A, Siech M, Beger H, Grunert A, Adler G. Identification, culture, and characterization of pancreatic stellate cells in rats and humans. Gastroenterology. 1998;115:421–432. doi: 10.1016/s0016-5085(98)70209-4. [DOI] [PubMed] [Google Scholar]
- [23].Mathison A, Liebl A, Bharucha J, Mukhopadhyay D, Lomberk G, Shah V, Urrutia R. Pancreatic stellate cell models for transcriptional studies of desmoplasia-associated genes. Pancreatology. 2010;10:505–516. doi: 10.1159/000320540. [DOI] [PMC free article] [PubMed] [Google Scholar]
- [24].Talon I, Lindner V, Sourbier C, Schordan E, Rothhut S, Barthelmebs M, Lang H, Helwig J-J, Massfelder T. Antitumor effect of parathyroid hormone-related protein neutralizing antibody in human renal cell carcinoma in vitro and in vivo. Carcinogenesis. 2006;27:73–83. doi: 10.1093/carcin/bgi203. [DOI] [PubMed] [Google Scholar]
- [25].Tancred TM, Belch AR, Reiman T, Pilarski LM, Kirshner J. Altered expression of fibronectin and collagens I and IV in multiple myeloma and monoclonal gammopathy of undetermined significance. J. Histochem. Cytochem. 2009;57:239–247. doi: 10.1369/jhc.2008.952200. [DOI] [PMC free article] [PubMed] [Google Scholar]
- [26].Diveti P, Lanske B, Kronenberg HM, Bringhurst FR. Conditionally immortalized murine osteoblasts lacking the type 1 PTH/PTHrP receptor. J. Bone Mineral Res. 1998;13:1835–1845. doi: 10.1359/jbmr.1998.13.12.1835. [DOI] [PubMed] [Google Scholar]
- [27].Bai X-H, Wang D-W, Kong L, Zhang Y, Luan Y, Kobayashi T. ADAMTS-7, a direct target of PTHrP, adversely regulates endochondral bone growth by associating with and inactivating GEP growth factor. Mol. Cell. Biol. 2009;29:4201–4219. doi: 10.1128/MCB.00056-09. [DOI] [PMC free article] [PubMed] [Google Scholar]
- [28].Wang G, Petzke MM, Iyer R, Wu H, Schwartz I. Pattern of proinflammatory cytokine induction in RAW264.7 mouse macrophages is identical for virulent and attenuated Borrelia burgdorferi. J. Immunol. 2008;180:8306–8315. doi: 10.4049/jimmunol.180.12.8306. [DOI] [PMC free article] [PubMed] [Google Scholar]
- [29].Yoshida Y. Okamoto, Umemura M, Yahagi A, O’Brien RL, Ikuta K, Kishihara K, Hara H, Nakae S, Iwakura Y, Matsuzaki G. Essential role of IL-17A in the formation of a mycobacterial infection-induced granuloma in the lung. J. Immunol. 2010;184:4414–4422. doi: 10.4049/jimmunol.0903332. [DOI] [PubMed] [Google Scholar]
- [30].Robert K, Nehmé J, Bourbon E, Pivert G, Friguet B, Delcayre C, Delabar J-M, Janel N. Cystathionine β synthase deficiency promotes oxidative stress, fibrosis, and steatosis in mice liver. Gastroenterology. 2005;128:1405–1415. doi: 10.1053/j.gastro.2005.02.034. [DOI] [PubMed] [Google Scholar]
- [31].Fujimoto M, Maezawa Y, Yokote K, Joh K, Kobayashi K, Kawamura H, Nishimura M, Roberts AB, Saito Y, Moria S. Mice lacking Smad3 are protected against streptozotocin-induced diabetic glomerulopathy. Biochem.Biophys. Res. Comm. 2003;305:1002–1007. doi: 10.1016/s0006-291x(03)00885-4. [DOI] [PubMed] [Google Scholar]
- [32].Wang L, Raikwar N, Deng L, Yang M, Liang L, Shao C, Evan AP, Stambrook PJ, Sahota A, Tischfield JA. Altered gene expression in kidneys of mice with 2,8-dihydroxyadenine nephrolithiasis. Kidney Int. 2000;58:528–536. doi: 10.1046/j.1523-1755.2000.00199.x. [DOI] [PubMed] [Google Scholar]
- [33].Clerc P, Coll Constans MG, Lulka H, Broussaud S, Guigné C, Leung-Theung-Long S, Perrin C, Knauf C, Carpéné C, Pénicaud L, Seva C, Burcelin R, Valet P, Fourmy D, Dufresne M. Involvement of cholecystokinin 2 receptor in food intake regulation: Hyperphagia and increased fat deposition in cholecystokinin 2 receptor-deficient mice. Endocrinology. 2007;148:1039–1049. doi: 10.1210/en.2006-1064. [DOI] [PubMed] [Google Scholar]
- [34].Okano K, Wu S, Huang X, Pirola CJ, Jüppner H, Abou-Samra AB, Segre GV, Iwasaki K, Fagin JA, Clemens TL. Parathyroid hormone (PTH)/PTH-related protein (PTHrP) receptor and its messenger ribonucleic acid in rat aortic vascular smooth muscle cells and UMR osteoblast-like cells: cell-specific regulation by angiotensin-II and PTHrP. Endocrinology. 1994;135:1093–1099. doi: 10.1210/endo.135.3.8070351. [DOI] [PubMed] [Google Scholar]
- [35].Peinnequin A, Mouret C, Birot O, Alonso A, Mathieu J, Clarençon D, Agay D, Chancerelle Y, Multon E. Rat pro-inflammatory cytokine and cytokine related mRNA quantification by real-time polymerase chain reaction using SYBR green. BMC Immunology. 2004;5:3. doi: 10.1186/1471-2172-5-3. doi:10.1186/1471-2172-5-3. [DOI] [PMC free article] [PubMed] [Google Scholar]
- [36].Perrone L, Devi TS, Hosoya K-I, Terasaki T, Singh LP. Thioredoxin interacting protein (TXNIP) induces inflammation through chromatin modification in retinal capillary endothelial cells under diabetic conditions. J. Cell. Physiol. 2009;221:262–272. doi: 10.1002/jcp.21852. [DOI] [PubMed] [Google Scholar]
- [37].Ohno T, Hirano S, Rousseau B. Age-associated changes in the expression and deposition of vocal fold collagen and hyaluronan. Ann. Otol. Rhinol .Laryngol. 2009;118:735–741. doi: 10.1177/000348940911801009. [DOI] [PMC free article] [PubMed] [Google Scholar]
- [38].Wu D, Hong Q, Chen X, Fu B, Li A, Liu H, Bai X, Wang J. Effective suppression of fibronectin synthesis by retrovirus delivered shRNA in rat cardiac fibroblasts, Science in China Ser. C. Life Sciences. 2004;47:368–375. doi: 10.1360/03yc0126. [DOI] [PubMed] [Google Scholar]
- [39].Nelovkov A, Areda T, Innos J, Kõks S, Vasar E. Rats displaying distinct exploratory activity also have different expression patterns of γ-aminobutyric acid- and cholecystokinin-related genes in brain regions. Brain Res. 2006;1100:21–31. doi: 10.1016/j.brainres.2006.05.007. [DOI] [PubMed] [Google Scholar]
- [40].Bragado MJ, Dabrowski A, Groblewski GE, Williams JA. CCK activates p90rsk in rat pancreatic acini through protein kinase C. Amer. J. Physiol. 1997;273:C1472–1479. doi: 10.1152/ajpgi.1997.272.3.G401. [DOI] [PubMed] [Google Scholar]
- [41].Shen X, Rychahou PG, Evers BM, Falzon M. PTHrP increases xenograft growth and promotes integrin α6β4 expression and Akt activation in colon cancer. Cancer Letters. 2007;258:241–252. doi: 10.1016/j.canlet.2007.09.010. [DOI] [PMC free article] [PubMed] [Google Scholar]
- [42].Williams JA, Blevins GT., Jr. Cholecystokinin and regulation of pancreatic acinar cell function. Physiol. Rev. 1993;73:701–723. doi: 10.1152/physrev.1993.73.4.701. [DOI] [PubMed] [Google Scholar]
- [43].Singh P, Owlia A, Espeijo R, Dai B. Novel gastrin receptors mediate mitogenic effects of gastrin and processing intermediates of gastrin on Swiss 3T3 fibroblasts. J. Biol. Chem. 1995;270:8429–8438. doi: 10.1074/jbc.270.15.8429. [DOI] [PubMed] [Google Scholar]
- [44].Wang B, Yang Y, Abou-Samra AB, Friedman PA. NHERF1 regulates parathyroid hormone receptor desensitization: interference with β-arrestin binding. Mol. Pharmacol. 2009;75:1189–1197. doi: 10.1124/mol.108.054486. [DOI] [PMC free article] [PubMed] [Google Scholar]
- [45].Berna MJ, Seiz O, Nast JF, Benten D, Bläker M, Koch J, Lohse AW, Pace A. CCK1 and CCK2 receptors are expressed on pancreatic stellate cells and induce collagen production. J. Biol. Chem. 2010;285:38905–38914. doi: 10.1074/jbc.M110.125534. [DOI] [PMC free article] [PubMed] [Google Scholar]
- [46].Comfort MW, Gambill EE, Baggenstoss AH. Chronic relapsing pancreatitis. Gastroenterology. 1946;6:239–285. [PubMed] [Google Scholar]
- [47].Whitcomb DC. Hereditary pancreatitis: new insights into acute and chronic pancreatitis. Gut. 1999;45:317–322. doi: 10.1136/gut.45.3.317. [DOI] [PMC free article] [PubMed] [Google Scholar]
- [48].Whitcomb DC. Inflammation and cancer. V. Chronic pancreatitis and pancreatic cancer. Am. J. Physiol. Gastrointest. Liver Physiol. 2004;287:G315–G319. doi: 10.1152/ajpgi.00115.2004. [DOI] [PubMed] [Google Scholar]
- [49].Pandol SJ, Lugea A, Mareninova OA, Smoot D, Gorelick FS, Gukovskaya AS, Gukovsky I. Investigating the pathobiology of alcoholic pancreatitis. Alcoholism: Clin. Exp. Res. 2011;35:1–8. doi: 10.1111/j.1530-0277.2010.01408.x. [DOI] [PMC free article] [PubMed] [Google Scholar]
- [50].Batemen AC, Turner SM, Thomas KSA, McCrudden PR, Fine DR, Johnson PA, Johnson CD, Iredale JP. Apoptosis and proliferation of acinar and islet cells in chronic pancreatitis: evidence for differential cell loss mediating preservation of islet function. Gut. 2002;50:542–548. doi: 10.1136/gut.50.4.542. [DOI] [PMC free article] [PubMed] [Google Scholar]
- [51].Bhatia V, Saini MK, Falzon M. Nuclear PTHrP targeting regulates PTHrP secretion and enhances LoVo cell proliferation and survival. Reg. Pept. 2009;158:149–155. doi: 10.1016/j.regpep.2009.07.008. [DOI] [PMC free article] [PubMed] [Google Scholar]
- [52].Ye Y, Wang C, Du P, Falzon M, Seitz PK, Cooper CW. Overexpression of parathyroid hormone-related protein enhances apoptosis in the rat intestinal cell lines, IEC-6. Endocrinology. 2001;142:1906–1914. doi: 10.1210/endo.142.5.8121. [DOI] [PubMed] [Google Scholar]
- [53].Fiaschi-Taesch NM, Stewart AF. Minireview: parathyroid hormone-related protein as an intracrine factor--trafficking mechanisms and functional consequences. Endocrinology. 2003;144:407–411. doi: 10.1210/en.2002-220818. [DOI] [PubMed] [Google Scholar]
- [54].Apte MV, Haber PS, Darby SJ, Rodgers SC, McCaughan GW, Korsten MA, Pirola RC, Wilson JS. Pancreatic stellate cells are activated by proinflammatory cytokines: implications for pancreatic fibrogenesis. Gut. 1999;44:534–541. doi: 10.1136/gut.44.4.534. [DOI] [PMC free article] [PubMed] [Google Scholar]
- [55].Gress TM, Menke A, Bachem M, Muller-Pillasch F, Ellenrieder V, Weidenbach H, Wagner M, Adler G. Role of extracellular matrix in pancreatic disease. Digestion. 1998;59:625–637. doi: 10.1159/000007567. [DOI] [PubMed] [Google Scholar]
- [56].Consolo M, Amoroso A, Spandidos DA, Mazzarino MC. Matrix metalloproteinases and their inhibitors as markers of inflammation and fibrosis in chronic liver disease. Inter. J. Mol. Med. 2009;24:143–152. doi: 10.3892/ijmm_00000217. n. [DOI] [PubMed] [Google Scholar]
- [57].Detlefsen S, Sipos B, Feyerabend B, Klöoppel G. Fibrogenesis in alcoholic chronic pancreatitis: the role of tissue necrosis, macrophages, myofibroblasts and cytokines. Modern Pathology. 2006;19:1019–1026. doi: 10.1038/modpathol.3800613. [DOI] [PubMed] [Google Scholar]


