Abstract
Background
Adipose tissue expands in response to excess caloric intake, but individuals prone to deposit visceral (VIS) instead of subcutaneous (SQ) adipose tissue have higher risk of metabolic disease. The role of angiogenesis in the expandability of human adipose tissue depots is unknown. The objective of this study was to measure angiogenesis in VIS and SQ adipose tissue, and to establish whether there is a relationship between obesity, metabolic status and the angiogenic properties of these depots.
Methods and results
Angiogenic capacity was determined by quantifying capillary branch formation from human adipose tissue explants embedded in Matrigel, and capillary density was assessed by immunohistochemistry. SQ adipose tissue had a greater angiogenic capacity compared to VIS, even after normalization to its higher initial capillary density. Gene array analyses revealed significant differences in expression of angiogenic genes between depots, including an increased SQ expression of ANGPTL4, which is pro-angiogenic in an adipose tissue context. SQ capillary density and angiogenic capacity decreased with morbid obesity, and SQ, but not VIS, adipose tissue angiogenic capacity negatively correlated with insulin sensitivity.
Conclusions
These data imply that SQ adipose tissue has a higher capacity to expand its capillary network compared to VIS, but this capacity decreases with morbid obesity. The decrease correlates with insulin resistance, suggesting that impairment of SQ adipose tissue angiogenesis may contribute to metabolic disease pathogenesis.
Keywords: vasculature, hypoxia, microcirculation, obesity, adipokine
INTRODUCTION
White adipose tissue evolved as a mechanism to store fuel in the form of triglycerides. It is initially found surrounding the viscera in the peritoneal cavity, but later in evolution major depots of adipose tissue are located in subcutaneous (SQ) sites 1. The development of large SQ depots allows the appropriate compartmentalization of lipids, preventing their accumulation in other tissues. Studies in animal models suggest that adipose tissue expansion requires angiogenesis 2-4. Conditions that impair angiogenesis block adipose tissue accumulation 5, 6, and pro-angiogenic stromal cells and elevated plasma and adipose tissue levels of pro-angiogenic factors have been observed in obese rodents 7-10, and in human patients 11, 12. However, the specific role of angiogenesis in human obesity has not been defined.
Both SQ and visceral (VIS) depots retain extraordinary growth potential throughout adult life 13, but there is significant, heritable variation in the relative size of these depots 14. SQ and VIS adipose tissues differ in their cellular composition, molecular properties and their role in regulation of the whole body metabolism 15, 16. While expansion of both SQ and VIS adipose tissue contribute to metabolic disease, SQ adipose tissue is considered to be a weaker risk factor14, 17, and in some cases has been reported to have a protective effect 18. The mechanisms that determine the degree of expansion of each depot in response to excess caloric intake, and their relationship with metabolic disease risk are unknown.
We and others have previously found that when embedded in fibrin/thrombin clots 19 or in Matrigel 20, small fragments of mouse adipose tissue develop angiogenic sprouts similar to those seen in aorta ring angiogenesis assays 21, 22. The extent of sprouting is higher in explants from mice undergoing adipose tissue expansion, such as in response to hyperphagia or treatment with thiazolidinediones 20, suggesting that this assay reflects angiogenic growth in-vivo. Here we had used this assay to study angiogenesis from human adipose tissue, and its relationship with adipose tissue capillary density, mass and individual metabolic parameters. Our results demonstrate that capillary density and angiogenic capacity of VIS adipose tissue is lower than that of SQ, but that SQ capillary density and angiogenic capacity decrease with morbid obesity. Our data suggest that variation in angiogenic capacity may influence adipose tissue expandability, and may be a risk factor in metabolic disease.
METHODS
Research design
Adipose tissue was obtained from adults undergoing Roux-en-Y gastric bypass surgery, or from healthy volunteers with a stable BMI of 25 – 35.5. Gastric bypass patients had a BMI of 36 or higher, and qualified under published NIH guidelines for the treatment of morbid obesity. Samples of SQ and VIS adipose tissue were taken from lower abdominal wall and greater omentum, respectively. SQ adipose tissue from normal volunteers was collected from lower abdominal area by needle aspiration with a 14g needle 23. The inner diameter of this needle is 1.6 mm, thus ~1mm fragments could be obtained without disrupting tissue architecture. Informed consents were required and signed before inclusion into the study, and protocols were approved by University of Massachusetts Medical School Institutional Review Board. Patient characteristics are summarized in Table 1.
Table 1.
Patient Characteristics.
| Parameters | Gastric Bypass Surgery | Needle Biopsy | P | Gastric Bypass Surgery (For Affymetrix) |
|---|---|---|---|---|
| N | 26 | 28 | 11 | |
| Age | 45 (25-63) | 40.4 (20-55) | 0.062 | 41 (32-54) |
| BMI* | 44.4 (36-59) | 30.76 (25-35.5) | <0.0001 | 45.4 (39-55) |
| FSG† (mg/dl) | 102 (78-166) | 86.12 (69-99) | <0.0001 | 92 (75-128) |
| FSI‡ (mIU/ml) | 19.65 (1.9-66) | 8.32 (2-20) | <0.001 | 9.1 (3-14) |
| HOMA-IR§ | 2.63 (0.5-5.3) | 1.73 (0.3-4.7) | <0.01 | 1.4 (0.4-1.9) |
Shown are the means and parentheses containing the range for each parameter. Two-tailed Student t-test was used to determine statistically significant differences between Gastric Bypass Surgery and Needle Biopsy populations.
BMI: Body Mass Index
FSG: Fasting Serum Glucose
FSI: Fasting Serum Insulin
HOMA-IR: Homeostasis Minimal Assessment Index of Insulin Resistance.
Ex-vivo angiogenesis assay of adipose tissue
Freshly harvested samples of human adipose tissue were placed in sterile EBM-2 media (Lonza). After removal of fibrotic tissue and obvious vasculature, the tissue was cut into ~1mm3 pieces, each of which was embedded in an individual well of a 96 well plate containing 40μl of growth factor depleted Matrigel (BD Discovery Labware). The size of each piece varied in the range of 1 +/- 0.5 mm3, and preliminary data did not indicate a correlation between the extent of capillary branch formation and explants size within this range. Nevertheless, to eliminate possible effect of explant size, values for each patient represent the average number of capillary branches formed by each of approximately 50 independent explants. Wells were filled with 200μl of EBM-2 media supplemented with endothelial growth factors (EGM-2 MV) (Lonza), and half of the media was replaced every second day. The number of branches forming around the periphery (defined as a minimum of three cells forming a branch structure) was counted at day 7 and 14 in culture, at 100X magnification, by two independent investigators. In addition, the percentage of explants growing capillary branches out of total number of explants embedded was recorded.
Analysis of adipose tissue capillary density
Adipose tissue samples were fixed in 4% Formaldehyde (Ted Pella, Inc.), embedded in paraffin, cut into 4μm sections and stained with rabbit anti-human Von Willebrand Factor (vWF) (1:200), or mouse anti-human CD31 (clone JC70A, 1:100) obtained from Dako. Indirect immunohistochemistry was performed with a Dako LSAB™+/HRP kit. The numbers of positive capillary lumens per area were counted under a 400X magnification, in at least 3 independent sections, with at least 10 fields per section for each adipose tissue sample, by two independent investigators who did not know the origin of the samples.
Immuno-fluorescent staining and analysis
Adipose tissue explants embedded in Matrigel in 35 mm glass-bottom culture dishes (MatTek Corporation) were fixed in 4% Formaldehyde (Ted Pella, Inc.), and stained with mouse anti-human antibodies to: eNOS (BD Pharmingen), CD31, CD34, and αSMA (Dako), or rabbit anti-human vWF (Biocare). The total and immuno-positive cells per field were counted in at least 15 randomly chosen fields at 200X magnification.
Western blotting
Western blotting was performed using mouse anti-human CD31 (Dako, Clone JC70A, 1:200), rabbit anti-human ANGPTL4 (Zymed, 1:1000) and β-Actin antibody (Sigma, 1:1000), and visualized with Western Lightning Chemiluminiscent (PerkinElmer Life Science).
Affymetrix microarray analysis
Total RNA from matched VIS and SQ samples from 11 patients was isolated using TRIzol. Affymetrix protocols were followed for the preparation of cRNA, which was hybridized to HG-U133v2 Chips. Raw expression data collected from an Affymetrix HP GeneArrayScanner was normalized across all 22 data sets using the RMA algorithm. A linear model approach 24 was used to determine differentially expressed genes. Derived p-values were adjusted for multiple testing using the Benjamini & Hochberg method 25. Statistical significance was defined as being differentially expressed with an adjusted p-value of less than 0.05. Hierarchical agglomerative clustering was done in R with the single linkage method. The distance matrix was calculated using the Canberra metric. For gene set enrichment analysis, probe identities were mapped on Kyoto Encyclopedia of Genes and Genomes (KEGG) pathways with the Bioconductor annotation library hgu133plus2.db, version 2.0.1, for the Affymetrix Human Genome U133 plus 2.0 Array. Differentially expressed probe lists were shrunk to the sublist that mapped to KEGG pathways. These were compared to all the probe sets on the U133 Plus 2.0 Array that mapped to a KEGG pathway to evaluate enrichment using the R package compdiagTools.
Statistical Analysis
For normally distributed data (verified by a p-value less than 0.05 using the D-Agostino-Pearson normality test), two-tailed, un-paired Student t-tests were used to compare the means collected from 2 distinct groups of patients, and two-tailed paired Student t-test were used to compare SQ and VIS adipose tissue from the same patients. For small sample sizes for which normality could not be established the nonparametric two-tailed Wilcoxon matched pairs test was employed. Linear regression analysis was performed using GraphPad Prism, and results are indicated in each figure.
RESULTS
Differences in angiogenic capacity between adipose tissue depots
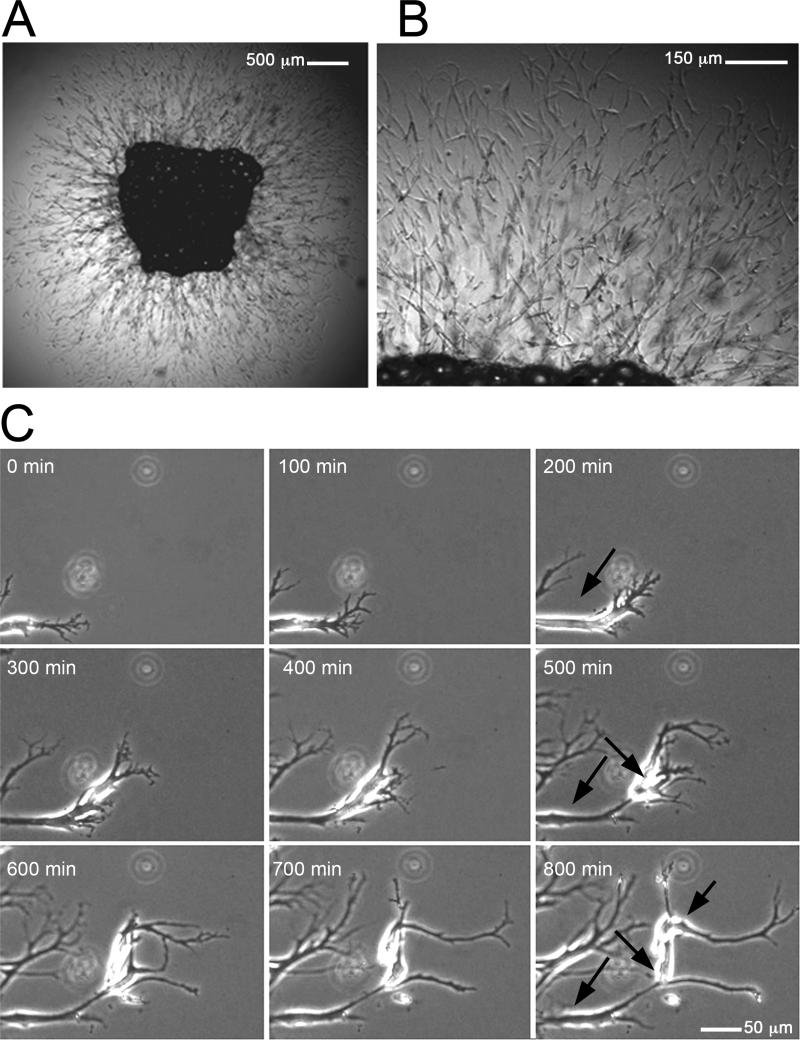
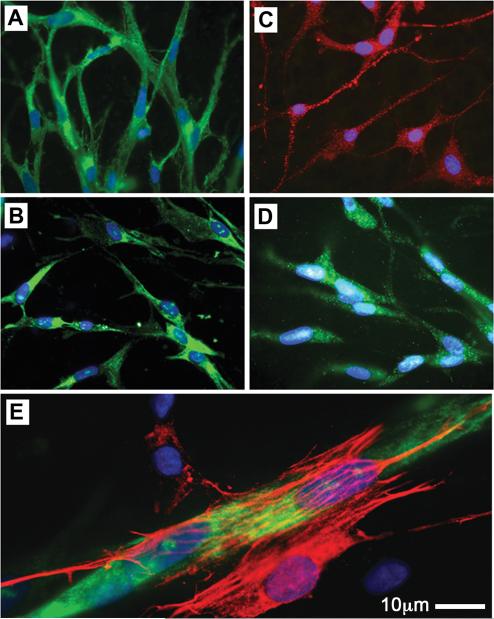
Approximately four days after embedding, cells emerge from adipose tissue explants and form an arborized network of capillary branches (Figure 1, supplementary Video 1). The majority of these cells are endothelial (Figure 2), as indicated by markers CD31 (present in 83-93% of cells), e-NOS (in 93-99% of cells), CD34 (in 71 to 86% of cells), and vWF (in 86-94% of cells). Smooth muscle actin was seen in 5-10% of cells typically found surrounding endothelial branches (Figure 2, E), and probably represent parricides.
Figure 1. Sprouting of capillary networks from human adipose tissue explants.
Adipose tissue explants were embedded in Matrigel and cultured as described in the text. A. Capillary branches emerging from a SQ adipose tissue explant after 14 days in culture. B. Higher magnification of A. C. Time lapse of branch formation at the periphery of the capillary network. Arrows point to three cells that organize over 800 min to form one branch. The growth of the branched network over a 48h period can be seen in Video 1.
Figure 2. Immuno-phenotype of cells comprising the sprouts formed from human adipose tissue explants.
Representative photomicrographs of newly-formed cells stained for endothelial cell markers CD31 (A), CD34 (B), eNOS (C), and vWF (D). E. Cell expressing α-Smooth Muscle Actin (red), presumably a pericyte, attached to vWF positive capillary branch (green).
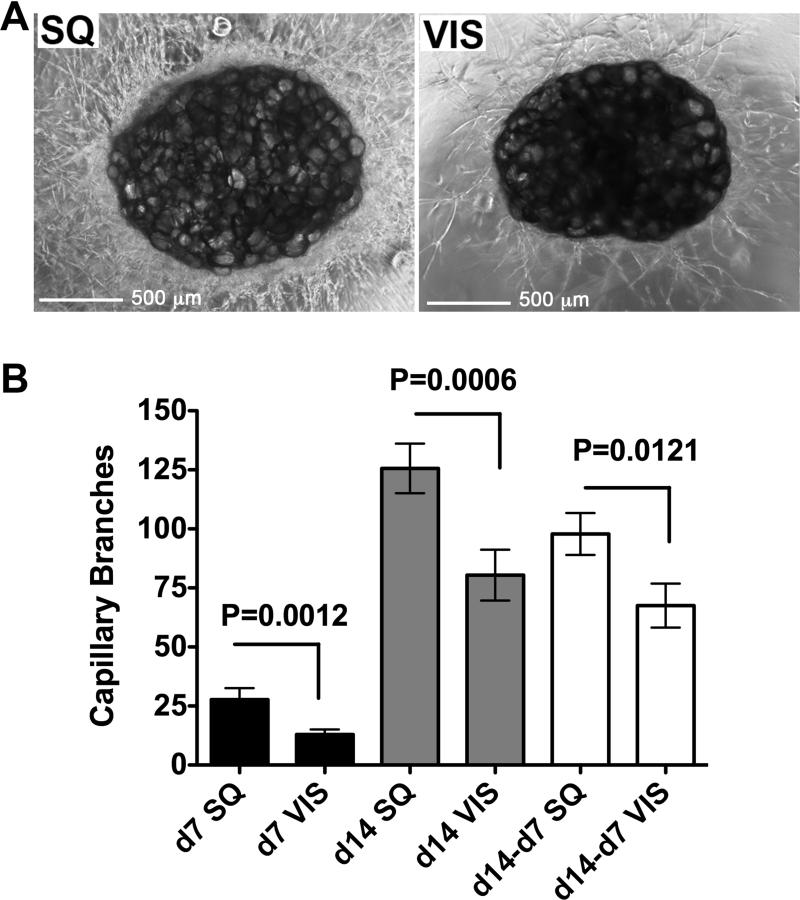
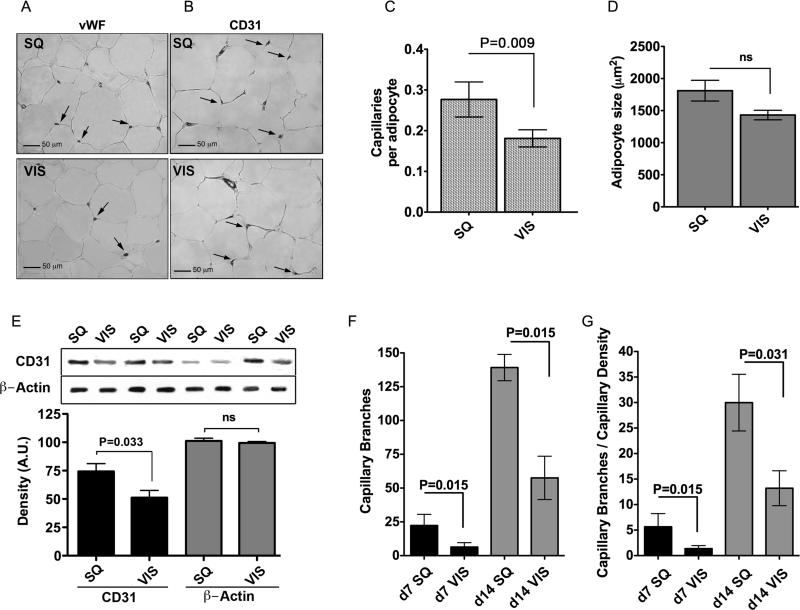
Sample pairs of SQ and VIS adipose tissue were obtained from 26 patients undergoing gastric bypass surgery (Figure 3 and individual patient data in Supplementary Table 1). Explants from both depots readily developed capillary branches (Figure 3A). The percent of VIS adipose tissue explants developing capillary branches was lower than that from SQ, but this difference did not reach statistical significance in a paired analysis (76 +/- 5% vs. 69 +/- 6% of explants from SQ vs. VIS adipose tissue, respectively; mean +/- SEM at day 14; P=0.388). However, a significant difference in the number of capillary branches formed from SQ compared to VIS explants was observed at days 7 and 14 of culture (Figure 3B). The rate of growth ex-vivo, assessed by the difference in the number of capillary branches between days 14 and 7, was also higher in explants from SQ compared to VIS adipose tissue (Figure 3B). To compare the differences in growth with the initial capillary density of the tissues, we performed immunohistochemical analysis on samples from 7 representative patients (Figure 4, and individual patients marked by asterisk in Supplementary Table 1) using the endothelial cell markers vWF (Figure 4A), or CD31 (Figure 4B). Irrespective of the marker analyzed, SQ adipose tissue capillary density was significantly higher compared to VIS when normalized to the number of adipocytes (Figure 4C), which tended to be larger in SQ (Figure 4D). In addition, the level of CD31 was higher in SQ adipose tissue compared to VIS when analyzed by Western blotting (Figure 4E). Thus, capillary density per adipocyte is higher in SQ than in VIS adipose tissue. However, the increased angiogenic growth of SQ adipose tissue ex-vivo cannot be explained completely by higher initial capillary density, as it persisted when the number of angiogenic branches was normalized to the initial capillary density (Figure 4F). These results indicate that SQ adipose tissue has higher capillary density per adipocyte in-vivo and higher capacity for angiogenic growth ex-vivo compared to VIS adipose tissue.
Figure 3. Decreased angiogenic potential in SQ compared to VIS adipose tissue.
A. Representative examples of explants from SQ or VIS adipose tissue after 14 days in culture. B. Quantitative analysis of formation of capillary branches from VIS or SQ adipose tissue after 7 and 14 days in culture, and growth rate estimated as the difference between days 14 and 7. Bars indicate the mean and SEM of 26 patients. The p-values were calculated by two-tailed paired Student t-tests between SQ and VIS samples from the same patient.
Figure 4. Decreased capillary density in SQ compared to VIS adipose tissue.
A and B. Sections of SQ and VIS adipose tissue stained with antibody to von Willebrand factor (vWF) (A) and CD31 (B) antibody. Arrows point to some of the capillary lumens in each section. C. Normalization of capillary density by adipocyte number. D. Measurement of adipocyte size. E. Representative example of Western blots of SQ and VIS adipose tissue samples from 4 individuals probed with anti-CD31. The bands were scanned, and the integrated density value for each band was calculated using Photoshop CS4 software. Β-actin was used as loading control. F. Normalization of angiogenic capacity by capillary density. For C, D, E, and F bars represent the means and SEM. P-values were calculated by two-tailed paired Wilcoxon matched pair test, n=7.
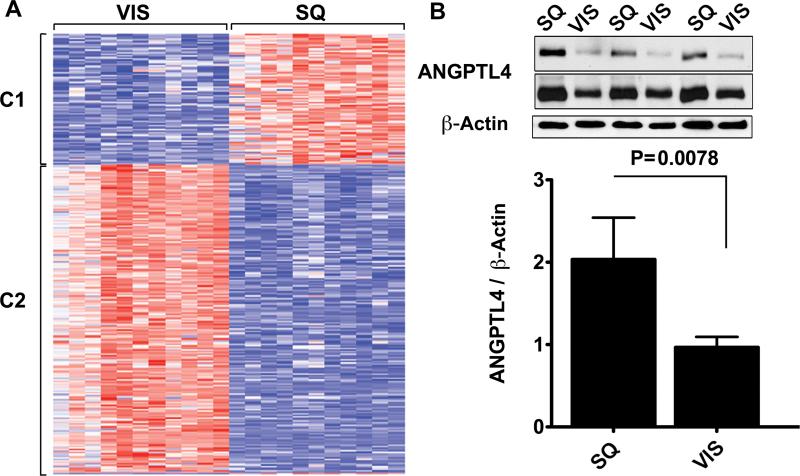
To further explore whether differences in angiogenic capacity between SQ and VIS adipose tissue depots reflect differences in adipose tissue in-vivo, we analyzed the expression of angiogenesis-related genes. SQ and VIS adipose tissue samples from 11 non-diabetic, insulin sensitive (HOMA-IR < 2.3) individuals who were not under any prescription medication (Table 1) were studied. The 54,612 probes in the HG-U133v2 Affymetrix chip revealed the presence of 10,652 gene transcripts expressed in both VIS and SQ adipose tissue. Of these, 2014 probes were differentially expressed with a p-value less than 0.001 and 483 of these 2014 were differentially expressed by 2.8 fold (Supplementary Table 2). A single-link hierarchical method applied to this gene set produced two main clusters (Figure 5A), which were further analyzed by mapping their members on the KEGG pathways. These genes were significantly enriched in pathways for extracellular matrix-receptor interaction, cell adhesion and tight junction pathways, likely originating from endothelial cells within the tissue (Table 2). In addition, TBX15 and NR2F1, developmental genes previously found to be differentially expressed between SQ and VIS adipose tissue in mice and humans 26, were among the genes found in this data set (Supplementary Table 2).
Figure 5. Gene expression differences between SQ and VIS adipose tissue.
A. Heat map of genes displaying 1.5 fold or higher difference in expression between depots, at a p-value less than 0.005. Genes clustered into two groups (C1 and C2), which were analyzed further as described in the text. B. 20 μg of protein from paired samples of SQ and VIS adipose tissue was analyzed by Western blotting with antibodies to angiopoietin-like protein 4 (ANGPTL4) and β-actin. Shown are representative examples of the data obtained at two different exposures (1 min, top and bottom, and 5 min, middle). The integrated density value for each band was calculated using Photoshop CS4 software, and plotted as the ratio of the integrated density values between ANGPTL4 and β-actin. P-value was determined by the 2-tailed Wilcoxon matched pair test, n=8.
Table 2.
KEGG pathways significantly populated by genes differentially expressed between SQ and VIS human adipose tissue.
| KEGG Pathway ID | P Value | Term | |
|---|---|---|---|
| Cluster 1 | 5130 | 0.0055560 | Pathogenic Escherichia coli infection |
| 590 | 0.0141626 | Arachidonic acid metabolism | |
| 4340 | 0.0180018 | Hedgehog signaling pathway | |
| 5217 | 0.0180018 | Basal cell carcinoma | |
| 4530 | 0.0222086 | Tight junction | |
| 4060 | 0.0262290 | Cytokine-cytokine receptor interaction | |
| 4512 | 0.0419087 | ECM-receptor interaction | |
| 380 | 0.0419477 | Tryptophan metabolism | |
| 4514 | 0.0446881 | Cell adhesion molecules (CAMs) | |
| Cluster 2 | 5219 | 0.0000043 | Bladder cancer |
| 4060 | 0.0000491 | Cytokine-cytokine receptor interaction | |
| 4621 | 0.0009880 | NOD-like receptor signaling pathway | |
| 4115 | 0.0036099 | p53 signaling pathway | |
| 4062 | 0.0037346 | Chemokine signaling pathway | |
| 4620 | 0.0043105 | Toll-like receptor signaling pathway | |
| 5200 | 0.0044407 | Pathways in cancer | |
| 4640 | 0.0101887 | Hematopoietic cell lineage | |
| 4614 | 0.0159094 | Renin-angiotensin system | |
| 4512 | 0.0173229 | ECM-receptor interaction | |
Of the genes present in SQ and VIS adipose tissue, 242 have been associated with the gene ontology term “angiogenesis”. Of these, 53 differed by 1.5-fold or more in expression level with a p-value less than 0.05 (Supplementary Table 3), and included proteins involved in adhesion, matrix metalloproteinases, cytokines, and well known regulators of angiogenesis and lymphangiogenesis such as VEGFC and VEGFD. Interestingly, SQ adipose tissue was found to express significantly higher levels of ANGPTL4, a factor induced in response to hypoxia and implicated in the regulation of lipid metabolism 27-30. We have previously shown ANGPTL4 to be pro-angiogenic in the context of adipose tissue, and to correlate with enhanced angiogenesis in mice treated with rosiglitazone 20. We find that the increase in mRNA levels of ANGPTL4 in SQ adipose tissue is also seen at the protein levels (Figure 5B). Thus, this difference between VIS and SQ human adipose tissue could at least in part explain the observed difference in angiogenic capacity between these depots.
Impaired capillary density and angiogenic capacity with increasing BMI
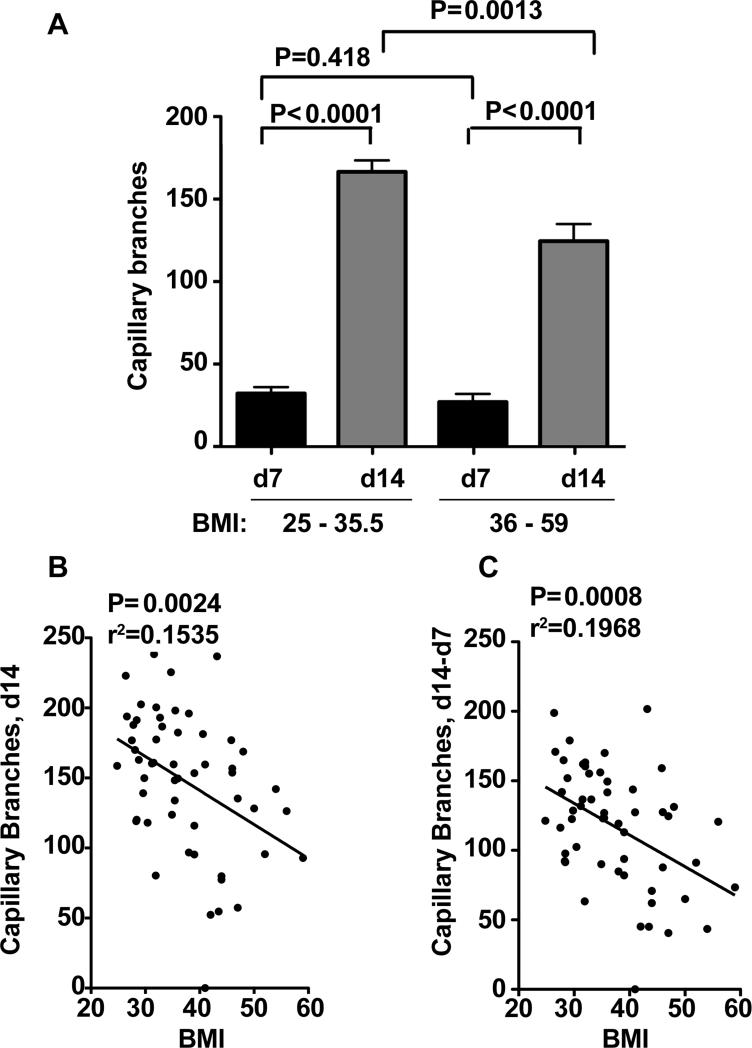
To determine whether angiogenesis of SQ adipose tissue varies with the demand for adipose tissue expansion we compared tissue from overweight (BMI 25 - 35.5) vs. obese (BMI 36 - 59) individuals. No significant difference in angiogenic capacity between these groups was seen at day 7 of culture, but at day 14 the number of branches growing in samples from obese was only 65% of that seen in samples from overweight individuals (Figure 6A). When all data were pooled, encompassing a BMI range between 25 and 59, a negative correlation between BMI and capillary branch formation at day 14 (Figure 6B), and between the rate of growth ex-vivo calculated as the difference between days 14 and 7 (Figure 6C) was apparent. These results suggest that angiogenic capacity of SQ adipose tissue decreases with morbid obesity.
Figure 6. Decreased SQ adipose tissue angiogenic capacity with increase in obesity.
A. Comparative analysis of capillary sprout formation in overweight (BMI 25 - 35.5, n=28) and morbidly obese (BMI 36 - 59, n=26) individuals. P-values represent statistical significance calculated by unpaired 2-tailed Student t-tests. B, C. Linear regression analysis between BMI and SQ adipose tissue capillary branch formation at day 14 (B), and between the rate of growth ex-vivo calculated as the difference between day14 and day 7 (C). Data for linear regression was from all subjects available, encompassing a range of BMI between 25 and 59, n=54. P and r2 values for each analysis are shown.
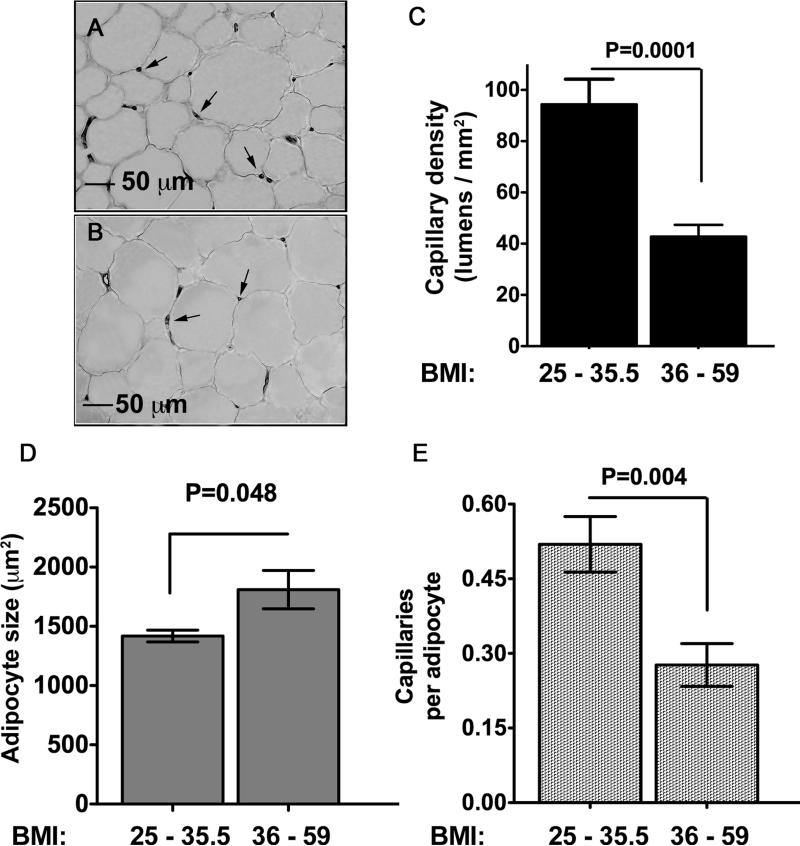
We then analyzed whether the decrease in angiogenic capacity ex-vivo reflected the capillary density of the originating tissue (Figure 7). SQ adipose tissue from individuals with BMI > 36 had less than half of the amount of capillaries per unit area compared to tissue from individuals with a BMI between 25 and 35.5 (Figure 7A, B and C). Although the higher BMI was also associated with larger adipocytes (Figure 7D), differences in capillary density remained significant after normalization to adipocyte number (Figure 7E). Thus, SQ adipose tissue from individuals with BMI > 36 is less vascularized than that from individuals with lower BMI, and displays decreased angiogenic capacity ex-vivo, possibly as a reflection of a lower initial capillary density.
Figure 7. Decrease in SQ adipose tissue capillary density in morbidly obese as compared to overweight individuals.
Sections of SQ adipose tissue from individuals with BMI 25 - 35.5 (A), or 36 - 59 (B) stained with anti vWF antibody. Arrows point to examples of capillary lumens. C. Quantification of capillary lumens per field. Bars represent the means and SEM of explants from 10 (BMI 25 – 35.5) or 7 (BMI 36 - 59) individuals per condition. The value for each patient was the average number of lumens per field calculated from 3 independent sections (10 fields per section). D. Measurement of adipocyte size and E. Normalization of capillary density by adipocyte number. The statistical analysis was based on two-tailed unpaired Student t-test.
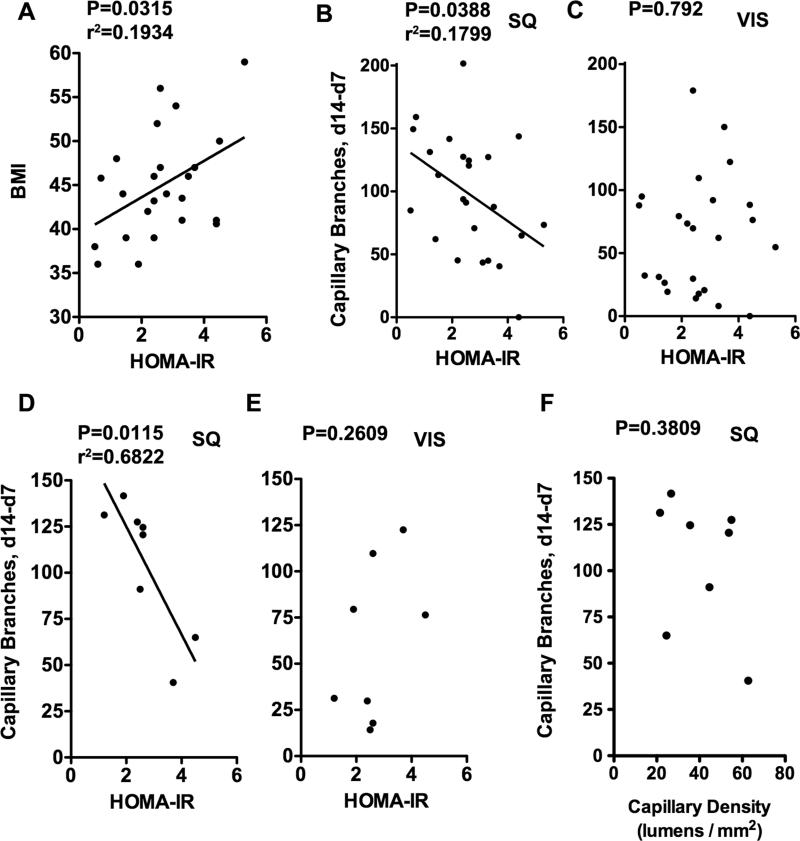
One of the reasons for which increasing BMI might correlate with insufficient capillary density and angiogenic capacity could be related to decreased insulin sensitivity that occurs in obesity. To address this question we analyzed the relationship between insulin sensitivity and angiogenic capacity in SQ and VIS adipose tissue from 26 gastric bypass surgery patients (Figure 8). As expected, a positive correlation between HOMA-IR and BMI was seen within the gastric bypass patient population (Figure 8A), as well as when overweight and obese individuals were pooled together (not illustrated). HOMA-IR correlated negatively with SQ angiogenic capacity in the gastric bypass patient population (Figure 8B) as well as in the pooled population (not illustrated). Interestingly, no significant correlation was seen between HOMA-IR and VIS angiogenic capacity (Figure 8C). The negative correlation between HOMA-IR and SQ angiogenic capacity was maintained in a subgroup analysis of samples of gastric bypass surgery patients for which capillary density and adipocyte size had been previously determined (Figure 8D, E). In this randomly chosen subgroup there was no significant correlation between angiogenic capacity ex-vivo and SQ capillary density (Figure 8F), suggesting that impaired angiogenic capacity in morbidly obese individuals is better explained by qualitative changes associated with insulin resistance than by differences in capillary density of the originating tissue.
Figure 8. Correlation between insulin sensitivity and capillary branch growth.
A, B, and C: Linear regression analysis between HOMA-IR and (A) BMI, (B) SQ ex-vivo angiogenic growth, and (C) VIS ex-vivo angiogenic growth in 26 gastric bypass surgery patients. D, E: Linear regression analysis between HOMA-IR and (D) SQ angiogenic growth and (E) VIS angiogenic growth in a subgroup of the patients (n=8) analyzed in A, B and C. F. Linear regression analysis between capillary density of the originating tissue and angiogenic growth in the same subpopulation. P-values for each analysis are shown. r2 values are shown for those cases in which statistical significance was found. Data for each patient can be found in Supplementary Table 1.
DISCUSSION
One of the most remarkable features of adipose tissue is its capacity to expand in a non-neoplastic manner. Impaired adipose tissue expandability, such as that occurring in lipodystophy, leads to ectopic accumulation of lipids in liver and muscle, insulin resistance and metabolic disease 31. Expandability depends on angiogenesis, but the underlying mechanisms of this process in adipose tissue are largely unknown. The method described here allows an accurate and reproducible measurement of new capillary branch formation from human adipose tissue. An advantage of this assay compared to others, such as the chick chorioallantoïc membrane model 32, is that the human tissue is the sole source of cells and thereby differences observed result exclusively from properties inherent to this tissue.
Two findings were made using this approach. First, we find that SQ adipose tissue has a higher capillary density per adipocyte and higher angiogenic growth capacity compared to VIS. Because a higher angiogenic capacity was seen even after normalization to initial capillary density, these results suggest the existence of qualitative differences in angiogenic expandability between SQ and VIS adipose tissue that are revealed ex-vivo. Consistent with this view is the finding that the expression of multiple genes involved in angiogenesis varies significantly among these tissues. At least one factor previously shown to be pro-angiogenic in an adipose tissue-specific context, ANGPTL4 20, is expressed at higher levels in human SQ adipose tissue. Further studies of the role of ANGPTL4, as well as of additional pro- and anti- angiogenic genes differentially expressed between SQ and VIS adipose tissue will be necessary to define the molecular basis for their differing angiogenic capacity.
The mechanism that determines SQ and VIS adipose tissue angiogenic capacity may underlie important physiological differences between these depots. One of these differences is that, while expansion of SQ adipose tissue is associated with protection from metabolic disease 18, expansion of VIS adipose tissue is not. Indeed, the risk of diabetes and coronary artery disease correlates strongly with relative visceral adiposity, rather than with BMI per se 14, 17. The mechanisms responsible for this risk are not clear; the results shown here suggest that expanding VIS adipose tissue may not be as well vascularized, potentially leading to hypoxia, impaired secretion of adipokines 33, and inflammation 34, traits that are associated with VIS adipose tissue and risk of metabolic disease.
The second finding made in this study is that capillary density and angiogenic potential of SQ adipose tissue decrease with increasing BMI. These results are consistent with the recent report of capillary dropout and lower oxygen tension in SQ adipose tissue from obese individuals 35. Capillary density and angiogenic potential of SQ adipose tissue decrease to a similar extent between overweight (BMI < 36) and obese (BMI > 36) individuals, so decreased angiogenic potential ex-vivo might only reflect initial lower capillary density, rather than a qualitative decline in expandability between these populations. Indeed, the negative correlation between SQ angiogenic capacity and BMI was surprising, because our previous studies in hyperphagic mice demonstrated increased angiogenic capacity with increased adiposity 20. A difference between these studies, however, is that the human population studied here compares overweight with morbidly obese individuals, whereas the previous study compared lean to overweight mice. Thus, it is possible that angiogenic capacity increases during the transition of lean to overweight, but is unable to continue to increase proportionally to adipocyte size and/or number during the progression to extreme obesity. However, the finding that within morbidly obese individuals the impairment in SQ angiogenic growth ex-vivo does not correlate with decreased capillary density of the originating tissue suggests that qualitative alterations in angiogenic capacity may also accompany extreme obesity. In any case, the data suggest that in morbid obesity SQ angiogenesis is insufficient to achieve a level of vascularization appropriate for the expanded tissue.
The negative correlation between SQ angiogenic capacity and BMI could be due to the metabolic alterations that accompany obesity. Consistent with this view is the finding that SQ angiogenic capacity negatively correlates with the increased insulin resistance seen between overweight and obese individuals (not shown), and within morbidly obese individuals undergoing gastric bypass surgery (Figure 8). One possibility is that production of pro-angiogenic factors by adipocytes may be compromised by insulin resistance 36. While adipocyte-derived pro-angiogenic factors such as leptin 37 increase with adipose tissue mass, other adipocyte-secreted factors such as adiponectin decrease in response to increased cell size or stress 38. Further studies on the molecular mechanisms that drive and limit adipose tissue angiogenesis and their sensitivity to insulin should provide answers to these questions.
A decreased angiogenic capacity in morbid obesity could be a physiologically protective mechanism as a way to limit the increase in adiposity, as expansion of adipose tissue is blocked by anti-angiogenic drugs 39. Studies to characterize the relationship between adipocyte growth, insulin sensitivity and adipose tissue angiogenesis within the spectrum of lean to obese states in humans will be necessary to answer these questions.
Supplementary Material
Acknowledgments
FUNDING SOURCES
This work was funded by a Pilot Project award from the University of Massachusetts Medical School Clinical and Translational Sciences Initiative, and by grant DK080366 to SC. Informatics and Morphology core services were supported by UMASS D.E.R.C. grant DK32520.
Footnotes
DISCLOSURES
The authors have no conflicts to disclose.
This is a PDF file of an unedited manuscript that has been accepted for publication. As a service to our customers we are providing this early version of the manuscript. The manuscript will undergo copyediting, typesetting, and review of the resulting proof before it is published in its final citable form. Please note that during the production process errors may be discovered which could affect the content, and all legal disclaimers that apply to the journal pertain.
REFERENCES
- 1.Gesta S, Tseng YH, Kahn CR. Developmental origin of fat: tracking obesity to its source. Cell. 2007;131:242–256. doi: 10.1016/j.cell.2007.10.004. [DOI] [PubMed] [Google Scholar]
- 2.Bouloumie A, Lolmede K, Sengenes C, Galitzky J, Lafontan M. Angiogenesis in adipose tissue. Ann Endocrinol (Paris) 2002;63:91–95. [PubMed] [Google Scholar]
- 3.Crandall DL, Hausman GJ, Kral JG. A review of the microcirculation of adipose tissue: anatomic, metabolic, and angiogenic perspectives. Microcirculation. 1997;4:211–232. doi: 10.3109/10739689709146786. [DOI] [PubMed] [Google Scholar]
- 4.Nishimura S, Manabe I, Nagasaki M, Hosoya Y, Yamashita H, Fujita H, Ohsugi M, Tobe K, Kadowaki T, Nagai R, Sugiura S. Adipogenesis in obesity requires close interplay between differentiating adipocytes, stromal cells, and blood vessels. Diabetes. 2007;56:1517–1526. doi: 10.2337/db06-1749. [DOI] [PubMed] [Google Scholar]
- 5.Rupnick MA, Panigrahy D, Zhang CY, Dallabrida SM, Lowell BB, Langer R, Folkman MJ. Adipose tissue mass can be regulated through the vasculature. Proc Natl Acad Sci U S A. 2002;99:10730–10735. doi: 10.1073/pnas.162349799. [DOI] [PMC free article] [PubMed] [Google Scholar]
- 6.Voros G, Maquoi E, Demeulemeester D, Clerx N, Collen D, Lijnen HR. Modulation of angiogenesis during adipose tissue development in murine models of obesity. Endocrinology. 2005;146:4545–4554. doi: 10.1210/en.2005-0532. [DOI] [PubMed] [Google Scholar]
- 7.Cai L, Johnstone BH, Cook TG, Tan J, Fishbein MC, Chen PS, March KL. IFATS collection: Human adipose tissue-derived stem cells induce angiogenesis and nerve sprouting following myocardial infarction, in conjunction with potent preservation of cardiac function. Stem Cells. 2009;27:230–237. doi: 10.1634/stemcells.2008-0273. [DOI] [PMC free article] [PubMed] [Google Scholar]
- 8.Kim Y, Kim H, Cho H, Bae Y, Suh K, Jung J. Direct comparison of human mesenchymal stem cells derived from adipose tissues and bone marrow in mediating neovascularization in response to vascular ischemia. Cell Physiol Biochem. 2007;20:867–876. doi: 10.1159/000110447. [DOI] [PubMed] [Google Scholar]
- 9.Moon MH, Kim SY, Kim YJ, Kim SJ, Lee JB, Bae YC, Sung SM, Jung JS. Human adipose tissue-derived mesenchymal stem cells improve postnatal neovascularization in a mouse model of hindlimb ischemia. Cell Physiol Biochem. 2006;17:279–290. doi: 10.1159/000094140. [DOI] [PubMed] [Google Scholar]
- 10.Rehman J, Traktuev D, Li J, Merfeld-Clauss S, Temm-Grove CJ, Bovenkerk JE, Pell CL, Johnstone BH, Considine RV, March KL. Secretion of angiogenic and antiapoptotic factors by human adipose stromal cells. Circulation. 2004;109:1292–1298. doi: 10.1161/01.CIR.0000121425.42966.F1. [DOI] [PubMed] [Google Scholar]
- 11.Miyazawa-Hoshimoto S, Takahashi K, Bujo H, Hashimoto N, Saito Y. Elevated serum vascular endothelial growth factor is associated with visceral fat accumulation in human obese subjects. Diabetologia. 2003;46:1483–1488. doi: 10.1007/s00125-003-1221-6. [DOI] [PubMed] [Google Scholar]
- 12.Silha JV, Krsek M, Sucharda P, Murphy LJ. Angiogenic factors are elevated in overweight and obese individuals. Int J Obes (Lond) 2005;29:1308–1314. doi: 10.1038/sj.ijo.0802987. [DOI] [PubMed] [Google Scholar]
- 13.Utzschneider KM, Carr DB, Hull RL, Kodama K, Shofer JB, Retzlaff BM, Knopp RH, Kahn SE. Impact of intra-abdominal fat and age on insulin sensitivity and beta-cell function. Diabetes. 2004;53:2867–2872. doi: 10.2337/diabetes.53.11.2867. [DOI] [PubMed] [Google Scholar]
- 14.Fox CS, Massaro JM, Hoffmann U, Pou KM, Maurovich-Horvat P, Liu CY, Vasan RS, Murabito JM, Meigs JB, Cupples LA, D'Agostino RB, Sr., O'Donnell CJ. Abdominal visceral and subcutaneous adipose tissue compartments: association with metabolic risk factors in the Framingham Heart Study. Circulation. 2007;116:39–48. doi: 10.1161/CIRCULATIONAHA.106.675355. [DOI] [PubMed] [Google Scholar]
- 15.Despres JP, Lemieux I, Bergeron J, Pibarot P, Mathieu P, Larose E, Rodes-Cabau J, Bertrand OF, Poirier P. Abdominal obesity and the metabolic syndrome: contribution to global cardiometabolic risk. Arterioscler Thromb Vasc Biol. 2008;28:1039–1049. doi: 10.1161/ATVBAHA.107.159228. [DOI] [PubMed] [Google Scholar]
- 16.Huffman DM, Barzilai N. Role of visceral adipose tissue in aging. Biochim Biophys Acta. 2009;1790:1117–1123. doi: 10.1016/j.bbagen.2009.01.008. [DOI] [PMC free article] [PubMed] [Google Scholar]
- 17.Gallagher D, Kelley DE, Yim JE, Spence N, Albu J, Boxt L, Pi-Sunyer FX, Heshka S. Adipose tissue distribution is different in type 2 diabetes. Am J Clin Nutr. 2009;89:807–814. doi: 10.3945/ajcn.2008.26955. [DOI] [PMC free article] [PubMed] [Google Scholar]
- 18.Snijder MB, Visser M, Dekker JM, Goodpaster BH, Harris TB, Kritchevsky SB, De Rekeneire N, Kanaya AM, Newman AB, Tylavsky FA, Seidell JC. Low subcutaneous thigh fat is a risk factor for unfavourable glucose and lipid levels, independently of high abdominal fat. The Health ABC Study. Diabetologia. 2005;48:301–308. doi: 10.1007/s00125-004-1637-7. [DOI] [PubMed] [Google Scholar]
- 19.Greenway FL, Liu Z, Yu Y, Caruso MK, Roberts AT, Lyons J, Schwimer JE, Gupta AK, Bellanger DE, Guillot TS, Woltering EA. An assay to measure angiogenesis in human fat tissue. Obes Surg. 2007;17:510–515. doi: 10.1007/s11695-007-9089-z. [DOI] [PubMed] [Google Scholar]
- 20.Gealekman O, Burkart A, Chouinard M, Nicoloro SM, Straubhaar J, Corvera S. Enhanced angiogenesis in obesity and in response to PPARgamma activators through adipocyte VEGF and ANGPTL4 production. Am J Physiol Endocrinol Metab. 2008;295:E1056–1064. doi: 10.1152/ajpendo.90345.2008. [DOI] [PMC free article] [PubMed] [Google Scholar]
- 21.Zhu WH, Iurlaro M, MacIntyre A, Fogel E, Nicosia RF. The mouse aorta model: influence of genetic background and aging on bFGF- and VEGF-induced angiogenic sprouting. Angiogenesis. 2003;6:193–199. doi: 10.1023/B:AGEN.0000021397.18713.9c. [DOI] [PubMed] [Google Scholar]
- 22.Shimada T, Takeshita Y, Murohara T, Sasaki K, Egami K, Shintani S, Katsuda Y, Ikeda H, Nabeshima Y, Imaizumi T. Angiogenesis and vasculogenesis are impaired in the precocious-aging klotho mouse. Circulation. 2004;110:1148–1155. doi: 10.1161/01.CIR.0000139854.74847.99. [DOI] [PubMed] [Google Scholar]
- 23.Handelman GJ, Epstein WL, Machlin LJ, van Kuijk FJ, Dratz EA. Biopsy method for human adipose with vitamin E and lipid measurements. Lipids. 1988;23:598–604. doi: 10.1007/BF02535604. [DOI] [PubMed] [Google Scholar]
- 24.Smyth GK. Linear models and empirical bayes methods for assessing differential expression in microarray experiments. Stat Appl Genet Mol Biol. 2004;3 doi: 10.2202/1544-6115.1027. Article3. [DOI] [PubMed] [Google Scholar]
- 25.Benjamini YH, Yosef Controlling the false discovery rate: a practical and powerful approach to multiple testing. J. Roy. Statist. Soc. Ser. B. 1995;57:289–300. [Google Scholar]
- 26.Gesta S, Bluher M, Yamamoto Y, Norris AW, Berndt J, Kralisch S, Boucher J, Lewis C, Kahn CR. Evidence for a role of developmental genes in the origin of obesity and body fat distribution. Proc Natl Acad Sci U S A. 2006;103:6676–6681. doi: 10.1073/pnas.0601752103. [DOI] [PMC free article] [PubMed] [Google Scholar]
- 27.Kersten S, Mandard S, Tan NS, Escher P, Metzger D, Chambon P, Gonzalez FJ, Desvergne B, Wahli W. Characterization of the fasting-induced adipose factor FIAF, a novel peroxisome proliferator-activated receptor target gene. J Biol Chem. 2000;275:28488–28493. doi: 10.1074/jbc.M004029200. [DOI] [PubMed] [Google Scholar]
- 28.Lichtenstein L, Kersten S. Modulation of plasma TG lipolysis by Angiopoietin-like proteins and GPIHBP1. Biochim Biophys Acta. 2010;1801:415–420. doi: 10.1016/j.bbalip.2009.12.015. [DOI] [PubMed] [Google Scholar]
- 29.Mandard S, Zandbergen F, Tan NS, Escher P, Patsouris D, Koenig W, Kleemann R, Bakker A, Veenman F, Wahli W, Muller M, Kersten S. The direct peroxisome proliferator-activated receptor target fasting-induced adipose factor (FIAF/PGAR/ANGPTL4) is present in blood plasma as a truncated protein that is increased by fenofibrate treatment. J Biol Chem. 2004;279:34411–34420. doi: 10.1074/jbc.M403058200. [DOI] [PubMed] [Google Scholar]
- 30.Wang B, Wood IS, Trayhurn P. Dysregulation of the expression and secretion of inflammation-related adipokines by hypoxia in human adipocytes. Pflugers Arch. 2007;455:479–492. doi: 10.1007/s00424-007-0301-8. [DOI] [PMC free article] [PubMed] [Google Scholar]
- 31.Capeau J, Magre J, Lascols O, Caron M, Bereziat V, Vigouroux C, Bastard JP. Diseases of adipose tissue: genetic and acquired lipodystrophies. Biochem Soc Trans. 2005;33:1073–1077. doi: 10.1042/BST0331073. [DOI] [PubMed] [Google Scholar]
- 32.Ledoux S, Queguiner I, Msika S, Calderari S, Rufat P, Gasc JM, Corvol P, Larger E. Angiogenesis associated with visceral and subcutaneous adipose tissue in severe human obesity. Diabetes. 2008;57:3247–3257. doi: 10.2337/db07-1812. [DOI] [PMC free article] [PubMed] [Google Scholar]
- 33.Ye J, Gao Z, Yin J, He Q. Hypoxia is a potential risk factor for chronic inflammation and adiponectin reduction in adipose tissue of ob/ob and dietary obese mice. Am J Physiol Endocrinol Metab. 2007;293:E1118–1128. doi: 10.1152/ajpendo.00435.2007. [DOI] [PubMed] [Google Scholar]
- 34.Trayhurn P, Wang B, Wood IS. Hypoxia in adipose tissue: a basis for the dysregulation of tissue function in obesity? Br J Nutr. 2008;100:227–235. doi: 10.1017/S0007114508971282. [DOI] [PubMed] [Google Scholar]
- 35.Pasarica M, Sereda OR, Redman LM, Albarado DC, Hymel DT, Roan LE, Rood JC, Burk DH, Smith SR. Reduced adipose tissue oxygenation in human obesity: evidence for rarefaction, macrophage chemotaxis, and inflammation without an angiogenic response. Diabetes. 2009;58:718–725. doi: 10.2337/db08-1098. [DOI] [PMC free article] [PubMed] [Google Scholar]
- 36.Mick GJ, Wang X, McCormick K. White adipocyte vascular endothelial growth factor: regulation by insulin. Endocrinology. 2002;143:948–953. doi: 10.1210/endo.143.3.8673. [DOI] [PubMed] [Google Scholar]
- 37.Ribatti D, Nico B, Belloni AS, Vacca A, Roncali L, Nussdorfer GG. Angiogenic activity of leptin in the chick embryo chorioallantoic membrane is in part mediated by endogenous fibroblast growth factor-2. Int J Mol Med. 2001;8:265–268. doi: 10.3892/ijmm.8.3.265. [DOI] [PubMed] [Google Scholar]
- 38.Rutkowski JM, Davis KE, Scherer PE. Mechanisms of obesity and related pathologies: the macro- and microcirculation of adipose tissue. FEBS J. 2009;276:5738–5746. doi: 10.1111/j.1742-4658.2009.07303.x. [DOI] [PMC free article] [PubMed] [Google Scholar]
- 39.Cao Y. Adipose tissue angiogenesis as a therapeutic target for obesity and metabolic diseases. Nat Rev Drug Discov. 2010;9:107–115. doi: 10.1038/nrd3055. [DOI] [PubMed] [Google Scholar]
Associated Data
This section collects any data citations, data availability statements, or supplementary materials included in this article.


