Abstract
Several mechanisms regarding the adverse health effects of nanomaterials have been proposed. Among them, oxidative stress is considered to be one of the most important. Many in vitro studies have shown that nanoparticles generate reactive oxygen species, deplete endogenous antioxidants, alter mitochondrial function and produce oxidative damage in DNA. 8-Hydroxy-2'-deoxyguanosine is a major type of oxidative DNA damage, and is often analyzed as a marker of oxidative stress in human and animal studies. In this study, we focused on the in vivo toxicity of metal oxide and silver nanoparticles. In particular, we analyzed the induction of micronucleated reticulocyte formation and oxidative stress in mice treated with nanoparticles (CuO, Fe3O4, Fe2O3, TiO2, Ag). For the micronucleus assay, peripheral blood was collected from the tail at 0, 24, 48 and 72 h after an i.p. injection of nanoparticles. Following the administration of nanoparticles by i.p. injection to mice, the urinary 8-hydroxy-2'-deoxyguanosine levels were analyzed by the HPLC-ECD method, to monitor the oxidative stress. The levels of 8-hydroxy-2'-deoxyguanosine in liver DNA were also measured. The results showed increases in the reticulocyte micronuclei formation in all nanoparticle-treated groups and in the urinary 8-hydroxy-2'-deoxyguanosine levels. The 8-hydroxy-2'-deoxyguanosine levels in the liver DNA of the CuO-treated group increased in a dose-dependent manner. In conclusion, the metal nanoparticles caused genotoxicity, and oxidative stress may be responsible for the toxicity of these metal nanoparticles.
Keywords: nanoparticles, metal oxide, silver, oxidative stress, DNA damage
Introduction
Significant advances in nanotechnology in recent years have greatly impacted industrial technology. With the increasing utilization of nanoparticles, people have a greater opportunity to be exposed to nanoparticles through the occupational environment and consumer products in daily life. At the same time, there has been increasing concern about the adverse effects of nanoparticles on human health. In this study, we especially focused on the induction of reticulocyte micronuclei and oxidative DNA damage in vivo caused by metal oxides (CuO, Fe2O3, Fe3O4, TiO2) and silver nanoparticles.
CuO nanoparticles have many commercial applications, as components in catalysts,(1) pigments, and antimicrobial textiles.(2) However, there are only a few reports describing the toxicity of CuO nanoparticles in bacteria(3,4) or human lung epithelial cells.(5) Recently, it was reported that CuO nanoparticles were highly toxic, as compared to other metal oxide nanoparticles in vitro.(6,7) However, the amount of in vivo data is still insufficient.
Iron oxide nanoparticles have attracted much attention, not only due to their superparamagnetic properties but also because they hold great potential in many biomedical applications, such as drug delivery, magnetic resonance imaging (MRI) contrast enhancement,(8–10) and the targeted destruction of tumor tissue through hyperthermia.(11) However iron oxide caused a significant increase in DNA damage in A549 cells.(7)
Nanosized TiO2 is one of the most widely used nanomaterials. TiO2 is a poorly soluble, biologically inert particulate, which is broadly used as a white pigment, ultraviolet light blocker, or catalyst in a number of products, such as paints, plastics, paper, cosmetics, medicines, foods, and welding rods.(12,13) At the same time, The International Agency for Research on Cancer classified TiO2 as possibly carcinogenic to humans (class 2B), based on sufficient evidence in experimental animals. The genotoxicity of TiO2 was also reported in several previous studies.(14–16) In general, nanosized TiO2 particles produce reactive oxygen species, damage DNA, and induce oxidative DNA damage in vitro.(17,18) On the other hand, negative genotoxicity results have also been reported.(19,20) Therefore, additional information on the genotoxicity of nanosized TiO2 is needed.
Silver nanoparticles are used most commonly in numerous consumer products, including textiles, cosmetics, and health care products, due to their strong antimicrobial activity. However, despite their widespread use, there is a serious lack of information concerning the toxicity of silver nanoparticles to humans.(21,22)
One of the most discussed mechanisms behind the health effects induced by metal oxide and silver nanoparticles is their ability to cause oxidative stress.(23–27) This mechanism is believed to be important in the toxicity of manufactured nanoparticles. Furthermore, since oxidative stress is directly linked to DNA damage, mutations, and cancer,(28–30) nanoparticles may affect on cancer development. Although some in vitro studies have focused on investigating and comparing metal oxide and silver nanoparticles, regarding DNA damage and markers for oxidative stress, the amount of in vivo research is still insufficient. We were particularly interested in the in vivo toxicities of these types of nanoparticles.
Nanoparticles are generally considered to be problematic in a toxicity assessment for several reasons.(23,24–27) The small size and the relatively large surface area have been suggested to result in increased toxicity, as compared to micrometer-sized particles. However, it is not clear whether the increased toxicity is a common feature of all kinds of nanoparticles with different chemical compositions. In particular, metal nanoparticles easily form micrometer sized aggregates. In this study, however, commercially available nanoparticles were tested as-is, because the toxicities of nanoparticles should be assessed using their commercially available forms. With regards to human exposure, it is therefore likely that under most circumstances, the nanomaterials will exist in the form of aggregates, rather than individual units. The aggregated form of the material may be more representative of workplace or consumer exposure scenarios.
The aim of this study was to investigate and compare different nanoparticles, regarding their ability to cause micronucleus formation and oxidative DNA damage in vivo. The study focused on different metal oxides (CuO, TiO2, Fe2O3, Fe3O4) and Ag nanoparticles.
Materials and Methods
Chemicals
CuO and TiO2 nanoparticles were purchased from Kanto Chemical, Co. Inc. (Tokyo, Japan). The particle size of CuO was 27.2–95.3 nm, with a surface area of 10–35 m2/g. The size of the TiO2 nanopowder was 19.7–101.0 nm, with a surface area of 15–77 m2/g. Fe2O3 and Fe3O4 nanoparticles were obtained from JEF Chemical (Chiba, Japan). The sizes of the Fe2O3 nanopowder particles were 60–100 nm, with a surface area of 15.0 m2/g. The particle size of the Fe3O4 nanopowder was 80 nm, with a surface area of 38 m2/g. The Ag nanoparticle powder was purchased from Sigma-Aldrich, Co. (St. Louis, MO), and the particle size was <100 nm, with a surface area of 5.0 m2/g.
Animals and treatment
Female ICR mice (6 weeks old) were purchased from SLC (Shizuoka, Japan), and were used for the experiments at 7 weeks of age. They were given commercial food (Dyets no. 110952; Dyets Inc., Bethlehem, PA) and water ad libitum throughout the acclimatization and experimental periods. Each type of nanoparticle was suspended in saline with 0.05% Tween 80 and injected intraperitoneally.
Micronucleus test
Acridine orange (AO)-coated slides were prepared as described previously.(31) Briefly, 10 µl of a 1 mg/ml AO aqueous solution was spread homogeneously on a warmed glass slide. A 5 µl portion of peripheral blood, collected by cutting the ventral tail, was placed without any anticoagulant on the center of an AO-coated glass slide and covered immediately with a 24 × 40 mm coverslip. AO supravitally stained reticulocytes were examined by fluorescence microscopy, with a blue excitation and a yellow barrier filter. The frequencies of micronucleated peripheral reticulocytes (MNRETs) were recorded, based on the observation of 1,000 reticulocytes per mouse.
Measurement of serum Cu level
Blood samples were drawn from the inferior vena cava, and were centrifuged for 10 min at 3,000 g to separate the serum. Serum samples were stored at −80°C until the analyses. Serum samples were analyzed using atomic absorption spectrometry with a graphite furnace instrument, Z-8200, equipped with an SSC-300 autosampler (Hitachi, Tokyo, Japan). The copper-specific hollow cathode lamp was used at 324.8 nm, with a slit width of 1.3 nm and Zeeman background correction. The atomization temperature was set to 2,400°C. Samples were diluted 1:100 to 2,000 with 0.05 M nitric acid. A commercial standard solution of copper was used for calibration.
Collection of urine
For urine collection, the mice were housed individually in glass metabolic cages (Sugiyama-Gen Iriki Co., Tokyo, Japan), and 24-h urine outputs were collected and stored at −20°C until analyzed. Time-based urine samples were also collected, before and 24, 48, 72 h after the injection of nanoparticles.
Isolation of nuclear DNA
Mice were killed under deep ether anesthesia at appropriate times after nanoparticle injection, and the livers and bone marrows were promptly removed and stored at −80°C until analyzed. The nuclear DNA of the mouse tissues was isolated by the sodium iodide method, using a DNA Extraction WB Kit (Wako Pure Chem. Ind., Ltd., Osaka, Japan). To avoid oxidative DNA artifacts, 1 mM desferal (deferoxamine mesylate, Sigma Chemical Co., MO) was added to the lysis solution for the tissue homogenization and DNA extraction. A 50 mg portion of liver was homogenized with a teflon-glass homogenizer, in 1 ml of ice-cold lysis solution. In the case of the bone marrow, the total amount from a mouse was used, without homogenization. Subsequent DNA isolation was performed according to the manufacturer’s instructions.
Analysis of 8-OH-dG in DNA
The isolated DNA was digested with 8 units of nuclease P1 (Yamasa Corp., Choshi, Japan), in 100 µl of a solution containing 1 mM EDTA and 20 mM sodium acetate (pH 4.5). It was then treated with 2 units of alkaline phosphatase (Roche Diagnosis GmbH, Mannheim, Germany) in 250 mM Tris-HCl buffer (pH 8.0), to obtain a deoxynucleoside mixture. The solution was filtered with a 0.45 µm filter (3CR, Japan PALL, Tokyo, Japan). The filtrate was stored at −80°C until analysis. The filtrate was injected into an HPLC column (Capcell Pak C18 MG, 3 µm, 4.6 × 250 (series-connected 100 + 150) mm, Shiseido Fine Chemicals, Tokyo, Japan) equipped with UV (UV-8020, Tosoh Co., Tokyo, Japan) and ECD (ECD-300, Eicom Co., Kyoto, Japan, applied voltage: 550 mV) detectors. The mobile phase was 10 mM NaH2PO4, containing 8% methanol and 0.13 mM Na2EDTA, delivered at a flow rate of 0.7 ml/min. The column temperature was 32°C. The amount of 8-OH-dG in the DNA was determined by comparison to the authentic standards. The 8-OH-dG value in the DNA was calculated as the number of 8-OH-dG per 106 deoxyguanosine (dG).
Analysis of 8-OH-dG in urine
The urinary 8-OH-dG level was determined using the previously described detection apparatus,(32,33) with three pumps, the sampling injector, two valves, the HPLC-1 column, the UV detector, the HPLC-2 column, and the EC detector. The HPLC-1 column was set in a column oven at 65°C, and the HPLC-2 column was set in a column oven at 50°C. Frozen urine samples were defrosted and mixed completely, to form homogeneous suspensions. For the 8-OH-dG analysis, a 50 µl aliquot of each sample was mixed with the same volume of a dilution solution, containing the ribonucleoside marker 8-hydroxyguanosine (120 mg/ml) and 4% acetonitrile, in a solution of 130 mM NaOAc (pH 4.5) and 0.6 mM H2SO4. The diluted urine samples were centrifuged at 13,000 rpm for 5 min. A 70 µl aliquot of each supernatant was transferred to a vial for analysis in the apparatus. A 20 µl aliquot of the diluted urine sample was injected into HPLC-1 (MCI GEL CA08F, 7 mm, 1.5 × 150 mm, solvent A, 50 ml/min) from the sampling injector, and the chromatogram was recorded by a UV detector (245 nm). In this method, the 8-OH-dG fraction was collected, depending upon the relative elution position from the peak of the added marker, 8-hydroxyguanosine (8-OH-Guo), and was automatically injected into the HPLC-2 column (Shiseido, Capcell Pak C18, 5 mm, 4.6 × 250 mm, solvent B, 1 ml/min). This column was coupled with an ECD [Coulochem III EC detector with a guard cell (5020) and an analytical cell (5011) (applied voltage: guard cell, 400 mV; E1, 280 mV; E2, 350 mV)]. The solvents used were: solvent A, 2% acetonitrile in 0.3 mM sulfuric acid; solvent B, 10 mM sodium phosphate buffer (pH 6.0), 5% methanol, plus an antiseptic, Reagent MB (100 ml/l).
Results
In vivo micronucleus test
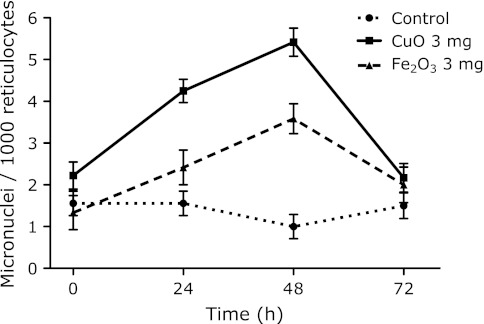
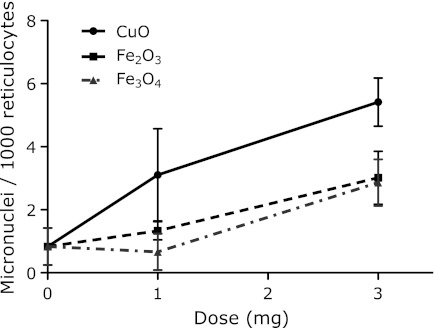
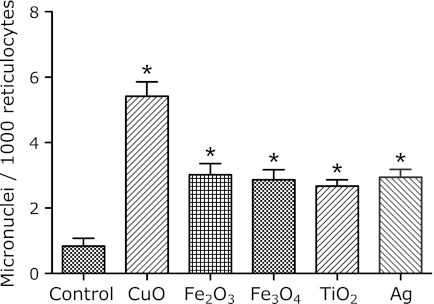
The results of the micronucleus assay were determined after the i.p. administration of metal nanoparticles at various doses (0, 1, 3 mg/mouse) to ICR female mice. The time courses of the induction of micronucleated reticulocytes (MNRETs) by the intraperitoneal administration of nanosized CuO, Fe2O3 and Fe3O4 are shown in Fig. 1. These metal nanoparticles induced significant increases in MNRETs. The peak induction of MNRETs appeared 48 h after the administration. The frequencies of MNRETs increased dose-dependently at 48 h after administration of CuO, Fe2O3 and Fe3O4 (Fig. 2). Significant increases of MNRETs were also obtained at 48 h after treatment with nanosized TiO2 and Ag, in addition to CuO, Fe3O4 and Fe2O3, as compared to the corresponding negative controls (Fig. 3).
Fig. 1.
Time courses of micronucleated reticulocyte induction after i.p. administration of 3 mg metal oxide nanoparticles. Significant differences exist between the control and the CuO or Fe2O3 treated group. Each value represents the average of 4–6 mice and a 95% confidence interval. In total, 3,000 reticulocytes from each mouse were analyzed.
Fig. 2.
Dose-response of micronucleated reticulocyte, induction at 48 h after i.p. administration of metal oxide nanoparticles. Significant differences exist between the 0 mg and 3 mg doses in the nanoparticle treated groups. Each value represents the average of 4–6 mice and 95% confidence interval. In total, 3,000 reticulocytes from each mouse were analyzed.
Fig. 3.
Frequencies of micronucleated reticulocyte induction at 48 h after i.p. administration of 3 mg metal oxide nanoparticles. Each value represents the average of 4–6 mice ± SE. *indicates significantly higher levels as compared to the control, corresponding to p<0.05. In total, 3,000 reticulocytes for each mouse were analyzed.
Serum copper content
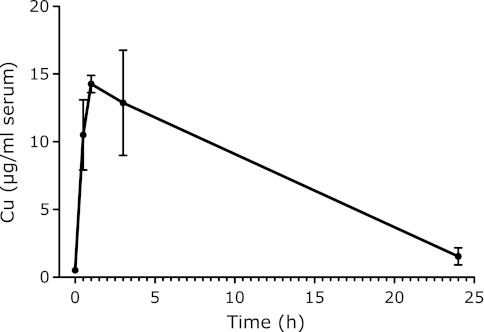
CuO was injected i.p. into mice once at a dose of 3 mg/mouse, as described in the Materials and Methods. The copper concentrations in the serum varied with time after the nanoparticle injection, as shown in Fig. 4. The Copper concentration in the serum increased immediately after injection, and reached its maximum at 1 h. Thereafter, it gradually decreased to nearly the control level in 24 h.
Fig. 4.
Serum copper concentration after the i.p. administration of 3 mg CuO. Each value represents the average of 3 mice ± SE.
Urinary 8-OH-dG
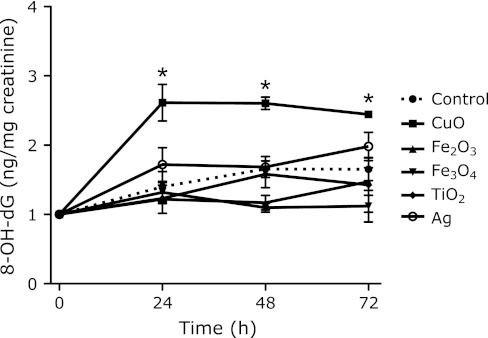
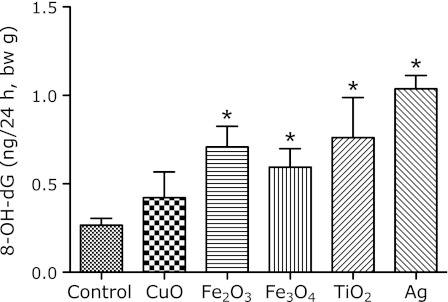
The urinary level of 8-OH-dG, corrected by creatinine, was significantly increased by the CuO administration to mice at each time point of the urine analysis (Fig. 5). However, the increases in the urinary levels of 8-OH-dG from the other nanoparticle treatments were not significant. The analysis of the 24 h urine collection with the metabolic cage revealed that the 8-OH-dG level was increased about 1.6-fold by the administration of 3 mg of CuO (Fig. 6). In addition, the other nanoparticles showed positive increases in the of 8-OH-dG levels.
Fig. 5.
Urinary 8-OH-dG levels corrected by creatinine (ng/mg) at each time point after i.p. administration of 3 mg metal oxide nanoparticles. The data show the ratio of 8-OH-dG levels at each time point to that at zero time, because each mouse had a different 8-OH-dG level before administration. Each value represents the average of 3 mice ± SE. *indicates significantly higher levels as compared to the control, corresponding to p<0.05.
Fig. 6.
Urinary 8-OH-dG levels in 24 h urine samples, collected after i.p. administration of 3 mg metal oxide nanoparticles. Each value represents the average of 3 mice ± SE. *indicates significantly higher levels as compared to the control, corresponding to p<0.05.
DNA 8-OH-dG in bone marrow and liver
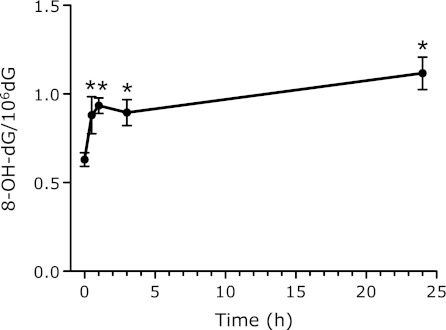
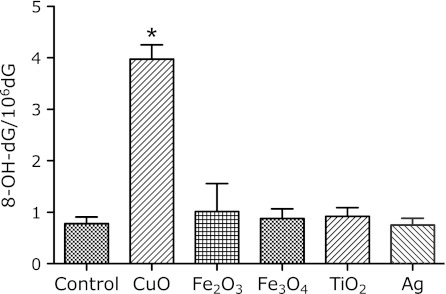
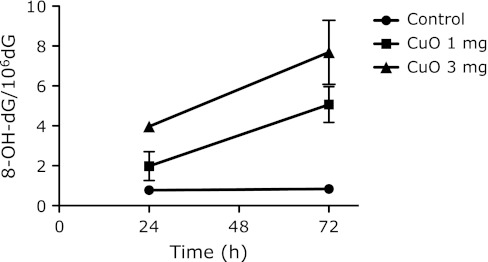
The 8-OH-dG levels in the bone marrow immediately increased after the injection of CuO, and continued to increase up to 24 h after administration (Fig. 7). The data in Fig. 8 show that the levels of 8-OH-dG in the DNA from the liver increased for 24 h after the administration of CuO. The 8-OH-dG levels in the liver DNA of the mice treated with 3 mg CuO were 5-fold higher than those in the non-treated control mouse liver DNA (0.78 ± 0.13 8-OH-dG/106 dG). The other nanoparticles did not cause an increase in the liver 8-OH-dG level at 24 h after administration. The 8-OH-dG levels in the liver DNA increased for 72 h after the administration of 1 and 3 mg doses of CuO (Fig. 9).
Fig. 7.
8-OH-dG levels in bone marrow DNA after i.p. administration of 3 mg CuO nanoparticles. Each value represents the average of 3 mice ± SE. *indicates significantly higher levels as compared to the control, corresponding to p<0.05.
Fig. 8.
8-OH-dG levels in liver DNA 24 h after i.p. administration of 3 mg metal oxide nanoparticles. Each value represents the average of 3 mice ± SE. *indicates significantly higher levels as compared to the control, corresponding to p<0.05.
Fig. 9.
Time courses of 8-OH-dG levels in liver DNA after i.p. administration of 1 or 3 mg CuO nanoparticles. Each value represents the average of 3 mice ± SE.
Discussion
Manufactured nanoparticles and their applications are an expanding field of technology, and as the use of these materials increases, it is becoming more and more important to investigate their possible adverse effects on human health as well as the environment. This study described the genotoxic activities and the induction of oxidative stress by metal oxide and silver nanoparticles in vivo.
Although several studies have reported the toxicities of metal oxide and silver nanoparticles in cultured cells, very little in vivo study information is available.(22–24)
The CuO nanoparticles were much more genotoxic, as compared to the other metal oxide nanoparticles, in the in vivo micronuclei test.(6) These genotoxic tendencies of metal oxide nanoparticles are similar to those recently reported by Karlsson et al.,(6) based on an in vitro Comet assay. In our results, the maximum rate of MNRETs occurred at 48 h, and thereafter declined to the control level by 72 h after CuO or iron oxide nanoparticle exposure. These micronuclei test results for the metal oxide nanoparticles support the proposal that MNRETs originate from lesions induced only during a short time after the administration of nanoparticles. Actually, the serum copper level increased immediately after the i.p. injection of CuO particles, and peaked at 1 h, followed by a gradual decrease with time. The copper level in the serum was reduced to the control levels at 24 h after administration. The increased copper concentrations in the blood indicated that the i.p. injection of CuO nanoparticles allowed them to enter the blood circulation and become distributed in the bone marrow. The time-courses of micronuclei induction and the serum metal levels seem to be intimately related to each other.
From a different standpoint, the proper timing of the peripheral blood sampling is important to evaluate the genotoxity of metal oxide nanoparticles by an in vivo micronuclei assay. Furthermore, a dose-related increase in micronuclei induction was observed in the peripheral blood of mice treated with CuO, Fe2O3 and Fe3O4 nanoparticles.
The actual reason why the CuO nanoparticles show the highest toxicity is still unclear, although several possibilities have been discussed, as follows. The CuO may have shown the highest toxicity because copper, like iron, is a transition metal, and can cause oxidative stress via the Fenton reaction. The Cu-ions released in the cell may be an additional source of the toxicity, and some studies have shown a strong relationship between cytotoxicity and nanoparticle solubility in vitro.(6,34) Another possibility is that the CuO nanoparticles physically interacted with the mitochondrial membranes. This structural damage would lead to the loss of mitochondrial membrane potential, the opening of the permeability transition pores, and ROS production.(35) Considering these phenomena together, a key mechanism underlying the high toxicity of CuO seems to be the ability to cause oxidative stress. Oxidative stress is a redox imbalance within cells, and usually results from increased intracellular reactive oxygen species (ROS) and decreased antioxidants.(25) ROS are highly reactive molecules that can disturb the homeostasis of the intracellular physiological state by reacting with cellular macromolecules including DNA, proteins and lipids. ROS-induced DNA damage is typified by single- and double-stranded DNA breaks, base modifications (e.g. the formation of 8-OH-dG adducts) and DNA cross-links, all of which, if un-repaired, have the potential to initiate and promote carcinogenesis.(36) 8-OH-dG(37) is one of the most well-studied oxidative stress markers in investigations of the role of oxidative stress in carcinogenesis. It is a useful marker to measure the oxidative damage in DNA, and the urinary 8-OH-dG level is also a common oxidative stress marker in living organisms. Although many studies using comet assays suggested that metal nanoparticles produce 8-OH-dG in DNA,(25–27) very few have directly measured, reliable 8-OH-dG data.(38) Therefore, we measured the 8-OH-dG levels in liver and bone marrow DNA and urine after the administration of metal oxide and silver nanoparticles, by the HPLC-ECD method.(33)
The urinary 8-OH-dG levels, corrected by creatinine (8-OH-dG/Cre), increased during 24–72 h after the CuO treatment (Fig. 5). The high level of liver 8-OH-dG persisted even at 72 h after the CuO administration (Fig. 9). Those data are in good agreement with other data. The 8-OH-dG levels in bone marrow immediately increased after the injection of CuO and continued to increase up to 24 h after administration (Fig. 7). During the first 24 h after administration, not only CuO but also all of the other metal compounds showed higher levels of urinary 8-OH-dG than the control (Fig. 6). The maximum point of urinary 8-OH-dG excretion was probably within 24 h after the injection of most of the metal nanoparticles, with the exception of CuO. The amount of 8-OH-dG excreted into urine during the 24 h after CuO treatment was rather low, in spite of its high toxicity. The degeneration of the kidney tubule epithelium has been reported as one of the toxic effects of copper.(39) As a result, the reduction of urine output (data not shown) by CuO may be related to the low 8-OH-dG excretion. The results described above revealed that the i.p. injected nanoparticles are quickly circulated through the blood system, and then are rapidly sequestered. This is reasonable, since the micronuclei induction peaked at 48 h after administration. Some metals, such as Cu, may accumulate in the liver and affect it for a long period of time. This may also be related to the continuously high levels of urinary 8-OH-dG (Fig. 5). However, the effects on bone marrow micronuclei formation are apparently short-lived.
The transition metals ions (such as copper, iron and titanium) released from certain nanoparticles have the potential to cause the conversion of cellular oxygen metabolic products, such as H2O2 and superoxide anions, to hydroxyl radicals (•OH), which are one of the primary DNA damaging species. Fe(II) can also cause the production of H2O2 from molecular O2, which can diffuse through cellular and nuclear membranes to react with Fe bound to DNA, resulting in the generation of •OH.
In conclusion, our study has shown that different nanoparticles have the common feature of inducing chromosomal damage and oxidative DNA damage in vivo. Among them, the CuO nanoparticles were the most potent, and exposure to these particles, occupationally or via consumer products, may pose a health risk. Iron oxide particles (Fe2O3, Fe3O4) also showed relatively high toxicity. However, TiO2 and Ag particles showed low toxicity. Taken together, our results suggest that metal oxide nanoparticles cause genotoxic effects in vivo. Nevertheless, further studies are needed to clarify the molecular mechanisms involved in the genotoxicity of metal oxide nanoparticles, for safer and proper utilization.
Acknowledgments
This work was supported by Grants-in-Aid from the Ministry of Health, Labor and Welfare of Japan, and by UOEH Grant for Advanced Research (2009–2011).
Abbreviations
- AO
acridine orange
- 8-OH-dG
8-hydroxy-2'-deoxyguanosine
- •OH
hydroxyl radicals
- ROS
reactive oxygen species
References
- 1.Braga VS, Garcia FAC, Dias JA, Dias SCL. Copper oxide and niobium pentoxide supported on silica-alumina: synthesis, characterization, and application on diesel soot oxidation. J Catal. 2007;247:68–77. [Google Scholar]
- 2.Ren G, Hu D, Cheng EW, Vargas-Reus MA, Reip P, Allaker RP. Characterisation of copper oxide nanoparticles for antimicrobial applications. Int J Antimicrob Agents. 2009;33:587–590. doi: 10.1016/j.ijantimicag.2008.12.004. [DOI] [PubMed] [Google Scholar]
- 3.Pan X, Redding JE, Wiley PA, Wen L, McConnell JS, Zhang B. Mutagenicity evaluation of metal oxide nanoparticles by the bacterial reverse mutation assay. Chemosphere. 2010;79:113–116. doi: 10.1016/j.chemosphere.2009.12.056. [DOI] [PubMed] [Google Scholar]
- 4.Wang Z, Lee YH, Wu B, et al. Anti-microbial activities of aerosolized transition metal oxide nanoparticles. Chemosphere. 2010;80:525–529. doi: 10.1016/j.chemosphere.2010.04.047. [DOI] [PubMed] [Google Scholar]
- 5.Ahamed M, Siddiqui MA, Akhtar MJ, Ahmad I, Pant AB, Alhadlaq HA. Genotoxic potential of copper oxide nanoparticles in human lung epithelial cells. Biochem Biophys Res Commun. 2010;396:578–583. doi: 10.1016/j.bbrc.2010.04.156. [DOI] [PubMed] [Google Scholar]
- 6.Karlsson HL, Cronholm P, Gustafsson J, Möller L. Copper oxide nanoparticles are highly toxic: a comparison between metal oxide nanoparticles and carbon nanotubes. Chem Res Toxicol. 2008;21:1726–1732. doi: 10.1021/tx800064j. [DOI] [PubMed] [Google Scholar]
- 7.Karlsson HL, Gustafsson J, Cronholm P, Möller L. Size-dependent toxicity of metal oxide particles: a comparison between nano- and micrometer size. Toxicol Lett. 2009;188:112–118. doi: 10.1016/j.toxlet.2009.03.014. [DOI] [PubMed] [Google Scholar]
- 8.Peng XH, Qian X, Mao H, et al. Targeted magnetic iron oxide nanoparticles for tumor imaging and therapy. Int J Nanomedicine. 2008;3:311–321. doi: 10.2147/ijn.s2824. [DOI] [PMC free article] [PubMed] [Google Scholar]
- 9.Thorek DL, Chen AK, Czupryna J, Tsourkas A. Superparamagnetic iron oxide nanoparticle probes for molecular imaging. Ann Biomed Eng. 2006;34:23–38. doi: 10.1007/s10439-005-9002-7. [DOI] [PubMed] [Google Scholar]
- 10.Rosenblum LT, Kosaka N, Mitsunaga M, Choyke PL, Kobayashi H. In vivo molecular imaging using nanomaterials: general in vivo characteristics of nano-sized reagents and applications for cancer diagnosis. Mol Membr Biol. 2010;27:274–285. doi: 10.3109/09687688.2010.481640. [DOI] [PMC free article] [PubMed] [Google Scholar]
- 11.Cherukuri P, Glazer ES, Curley SA. Targeted hyperthermia using metal nanoparticles. Adv Drug Deliv Rev. 2010;62:339–345. doi: 10.1016/j.addr.2009.11.006. [DOI] [PMC free article] [PubMed] [Google Scholar]
- 12.Lomer MC, Thompson RP, Powell JJ. Fine and ultrafine particles of the diet: influence on the mucosal immune response and association with Crohn’s disease. Proc Nutr Soc. 2002;61:123–130. doi: 10.1079/pns2001134. [DOI] [PubMed] [Google Scholar]
- 13.Baan R, Straif K, Grosse Y, Secretan B, El Ghissassi F, Cogliano V, WHO International Agency for Research on Cancer Monograph Working Group Carcinogenicity of carbon black, titanium dioxide, and talc. Lancet Oncol. 2006;7:295–296. doi: 10.1016/s1470-2045(06)70651-9. [DOI] [PubMed] [Google Scholar]
- 14.Falck GC, Lindberg HK, Suhonen S, et al. Genotoxic effects of nanosized and fine TiO2. Hum Exp Toxicol. 2009;28:339–352. doi: 10.1177/0960327109105163. [DOI] [PubMed] [Google Scholar]
- 15.Rahman Q, Lohani M, Dopp E, et al. Evidence that ultrafine titanium dioxide induces micronuclei and apoptosis in Syrian hamster embryo fibroblasts. Environ Health Perspect. 2002;110:797–800. doi: 10.1289/ehp.02110797. [DOI] [PMC free article] [PubMed] [Google Scholar]
- 16.Wang JJ, Sanderson BJ, Wang H. Cyto- and genotoxicity of ultrafine TiO2 particles in cultured human lymphoblastoid cells. Mutat Res. 2007;628:99–106. doi: 10.1016/j.mrgentox.2006.12.003. [DOI] [PubMed] [Google Scholar]
- 17.Gurr JR, Wang AS, Chen CH, Jan KY. Ultrafine titanium dioxide particles in the absence of photoactivation can induce oxidative damage to human bronchial epithelial cells. Toxicology. 2005;213:66–73. doi: 10.1016/j.tox.2005.05.007. [DOI] [PubMed] [Google Scholar]
- 18.Reeves JF, Davies SJ, Dodd NJ, Jha AN. Hydroxyl radicals (•OH) are associated with titanium dioxide (TiO(2)) nanoparticle-induced cytotoxicity and oxidative DNA damage in fish cells. Mutat Res. 2008;640:113–122. doi: 10.1016/j.mrfmmm.2007.12.010. [DOI] [PubMed] [Google Scholar]
- 19.Linnainmaa K, Kivipensas P, Vainio H. Toxicity and cytogenetic studies of ultrafine titanium dioxide in cultured rat liver epithelial cells. Toxicol In Vitro. 1997;11:329–335. doi: 10.1016/s0887-2333(97)00000-3. [DOI] [PubMed] [Google Scholar]
- 20.Miller BM, Pujadas E, Gocke E. Evaluation of the micronucleus test in vitro using Chinese hamster cells: results of four chemicals weakly positive in the in vivo micronucleus test. Environ Mol Mutagen. 1995;26:240–247. doi: 10.1002/em.2850260309. [DOI] [PubMed] [Google Scholar]
- 21.Chen X, Schluesener HJ. Nanosilver: a nanoproduct in medical application. Toxicol Lett. 2008;176:1–12. doi: 10.1016/j.toxlet.2007.10.004. [DOI] [PubMed] [Google Scholar]
- 22.Johnston HJ, Hutchison G, Christensen FM, Peters S, Hankin S, Stone V. A review of the in vivo and in vitro toxicity of silver and gold particulates: particle attributes and biological mechanisms responsible for the observed toxicity. Crit Rev Toxicol. 2010;40:328–346. doi: 10.3109/10408440903453074. [DOI] [PubMed] [Google Scholar]
- 23.Jones CF, Grainger DW. In vitro assessments of nanomaterial toxicity. Adv Drug Deliv Rev. 2009;61:438–456. doi: 10.1016/j.addr.2009.03.005. [DOI] [PMC free article] [PubMed] [Google Scholar]
- 24.Landsiedel R, Kapp MD, Schulz M, Wiench K, Oesch F. Genotoxicity investigations on nanomaterials: methods, preparation and characterization of test material, potential artifacts and limitations—many questions, some answers. Mutat Res. 2009;681:241–258. doi: 10.1016/j.mrrev.2008.10.002. [DOI] [PubMed] [Google Scholar]
- 25.Møller P, Jacobsen NR, Folkmann JK, et al. Role of oxidative damage in toxicity of particulates. Free Radic Res. 2010;44:1–46. doi: 10.3109/10715760903300691. [DOI] [PubMed] [Google Scholar]
- 26.Oberdörster G, Stone V, Donaldson K. Toxicology of nanoparticles: a historical perspective. Nanotoxicology. 2007;1:2–25. [Google Scholar]
- 27.Singh N, Manshian B, Jenkins GJ, et al. NanoGenotoxicology: the DNA damaging potential of engineered nanomaterials. Biomaterials. 2009;30:3891–3914. doi: 10.1016/j.biomaterials.2009.04.009. [DOI] [PubMed] [Google Scholar]
- 28.Kasai H. Chemistry-based studies on oxidative DNA damage: formation, repair, and mutagenesis. Free Radic Biol Med. 2002;33:450–456. [PubMed] [Google Scholar]
- 29.Kasai H, Iwamoto-Tanaka N, Miyamoto T, et al. Life style and urinary 8-hydroxydeoxyguanosine, a marker of oxidative dna damage: effects of exercise, working conditions, meat intake, body mass index, and smoking. Jpn J Cancer Res. 2001;92:9–15. doi: 10.1111/j.1349-7006.2001.tb01041.x. [DOI] [PMC free article] [PubMed] [Google Scholar]
- 30.Kasai H, Kawai K. Oxidative DNA damage: mechanisms and significance in health and disease. Antioxid Redox Signal. 2006;8:981–983. doi: 10.1089/ars.2006.8.981. [DOI] [PubMed] [Google Scholar]
- 31.Hayashi M, Morita T, Kodama Y, Sofuni T, Ishidate M., Jr The micronucleus assay with mouse peripheral blood reticulocytes using acridine orange-coated slides. Mutat Res. 1990;245:245–249. doi: 10.1016/0165-7992(90)90153-b. [DOI] [PubMed] [Google Scholar]
- 32.Kasai H, Svoboda P, Yamasaki S, Kawai K. Simultaneous determination of 8-hydroxydeoyguanosine, a marker of oxidative stress, and creatinine, a standardization compound, in urine. Ind Health. 2005;43:333–336. doi: 10.2486/indhealth.43.333. [DOI] [PubMed] [Google Scholar]
- 33.Kawai K, Li Y-S, Kasai H. Accurate measurement of 8-OH-dG and 8-OH-Gua in mouse DNA, urine and serum: effacts of X-ray irradiation. Genes and Environment. 2007;29:107–114. [Google Scholar]
- 34.Aruoja V, Dubourguier HC, Kasemets K, Kahru A. Toxicity of nanoparticles of CuO, ZnO and TiO2 to microalgae Pseudokirchneriella subcapitata. Sci Total Environ. 2009;407:1461–1468. doi: 10.1016/j.scitotenv.2008.10.053. [DOI] [PubMed] [Google Scholar]
- 35.Xia T, Kovochich M, Nel AE. Impairment of mitochondrial function by particulate matter (PM) and their toxic components: implications for PM-induced cardiovascular and lung disease. Front Biosci. 2007;12:1238–1246. doi: 10.2741/2142. [DOI] [PubMed] [Google Scholar]
- 36.Valko M, Rhodes CJ, Moncol J, Izakovic M, Mazur M. Free radicals, metals and antioxidants in oxidative stress-induced cancer. Chem Biol Interact. 2006;160:1–40. doi: 10.1016/j.cbi.2005.12.009. [DOI] [PubMed] [Google Scholar]
- 37.Kasai H, Nishimura S. Hydroxylation of the C-8 position of deoxyguanosine by reducing agents in the presence of oxygen. Nucleic Acids Symp Ser. 1983:165–167. [PubMed] [Google Scholar]
- 38.Trouiller B, Reliene R, Westbrook A, Solaimani P, Schiestl RH. Titanium dioxide nanoparticles induce DNA damage and genetic instability in vivo in mice. Cancer Res. 2009;69:8784–8789. doi: 10.1158/0008-5472.CAN-09-2496. [DOI] [PMC free article] [PubMed] [Google Scholar]
- 39.Haywood S. The effect of excess dietary copper on the liver and kidney of the male rat. J Comp Pathol. 1980;90:217–232. doi: 10.1016/0021-9975(80)90058-4. [DOI] [PubMed] [Google Scholar]


