

Abstract
Objective
The most common neurological symptom of tuberous sclerosis complex (TSC) and focal cortical dysplasia (FCD) is early-life refractory epilepsy. As previous studies have shown enhanced excitatory glutamatergic neurotransmission in TSC and FCD brains, we hypothesized that neurons associated with these lesions may also express altered GABAA receptor (GABAAR)-mediated inhibition.
Methods
Expression of the GABAAR subunitsα1 and α4, the Na+-K+-2Cl− (NKCC1), and the K+−Cl− (KCC2) transporters in human TSC and FCD Type II specimens were analyzed by Western blot and double label immunocytochemistry. GABAAR responses in dysplastic neurons from a single case of TSC were measured by perforated-patch recording and compared to normal-appearing cortical neurons from a non-TSC epilepsy case.
Results
TSC and FCD Type IIb lesions demonstrated decreased expression of the GABAAR α1, increased NKCC1 and decreased KCC2 levels. In contrast, FCD Type IIa lesions showed decreased α4, and increased expression of both NKCC1 and KCC2 transporters. Patch clamp recordings from dysplastic neurons in acute slices from TSC tubers demonstrated excitatory GABAAR responses that were significantly attenuated by the NKCC1 inhibitor bumetanide, in contrast to hyperpolarizing GABAAR-mediated currents in normal neurons from non-TSC cortical slices.
Interpretation
Expression and function of GABAARs in TSC and FCD IIb suggests the relative benzodiazepine insensitivity and more excitatory action of GABA compared to FCD IIa. These factors may contribute to resistance of seizure activity to anticonvulsants that increase GABAergic function, and may justify add-on trials of the NKCC1 inhibitor bumetanide for the treatment of TSC and FCD Type IIb related epilepsy.
INTRODUCTION
Cortical malformations are a major cause of pediatric focal epilepsy and are often associated with other disorders of intellectual development, including cognitive impairments and autism 1–3. Tuberous Sclerosis Complex (TSC) and focal cortical dysplasia (FCD) are two major classes of cortical malformations. TSC is a multiorgan autosomal dominant disorder due to inactivating mutations in the TSC1 and TSC2 genes4. In contrast, the various phenotypes of FCD are not associated with consistent genetic mutations, suggesting a role of fetal, perinatal, or early postnatal insults 1,5.
TSC cortical tubers are well-defined dysplastic lesions and are often the source of focal epileptiform activity that can also generalize 6. Loss of TSC1/TSC2 function in TSC results in hyperactivation of the mammalian target of rapamycin (mTOR) pathway and subsequent increased protein synthesis, abnormal cellular differentiation and growth 6,7. Cortical tubers are characterized by areas of disrupted cortical and subcortical architecture, and the presence of enlarged cells that strongly express the phospho-ribosomal protein S6 (pS6) marker of mTOR Complex1 (mTORC1) activation8–10. In addition to being comprised of abnormal cell types, tuber cells express altered receptor patterns for the excitatory neurotransmitter glutamate 8,11,12, which may contribute to the highly refractory nature of these epileptogenic lesions.
Similar to TSC, sporadically occurring focal cortical dysplasias (FCDs) contain a variety of cellular abnormalities, including clusters of dysplastic cells. Classification of FCDs distinguishes two major categories: mild malformations of cortical development (MCD) and focal cortical dysplasia (FCD), subdivided into further subtypes 13,14. FCD Type II includes Type IIa (cortical dyslamination and dysmorphic neurons) and Type IIb (cortical dyslamination, dysmorphic neurons and balloon cells)13. FCD Type IIb has several striking histopathological features similar to TSC cortical tubers, which raises the possibility of common mechanisms responsible for structural abnormalities and epileptogenesis. Balloon cells and dysplastic neurons in FCD Type IIb also show evidence of mTORC1 pathway upregulation 10,15 that is not observed in FDC Type IIa 16. Additionally FCD Type IIb tissue has been reported to express similar patterns of dysregulated glutamate receptors, such as decreased NR2A and high NR2B levels, as that observed in TSC 17–19.
Epilepsy in cortical malformations is thought to occur as a result of altered excitatory:inhibitory balance. There has been considerable interest in the status of the inhibitory γ-aminobutyric acid (GABA) neurotransmitter, given the aforementioned abnormalities observed in the glutamate receptor systems. Conventional antiepileptic drugs (AEDs) mainly target GABAA receptors (GABAARs), yet are largely ineffective in patients with refractory epilepsy secondary to TSC or FCD20, suggesting that altered inhibition in the dysplastic brain may contribute to seizure generation and epileptogenesis.
GABAARs are Cl−-permeable ion channels formed by an association of five subunits, and each subunit confers specific functional and pharmacological properties to the receptor 21,22. Expression of the α1 subunit is mainly responsible for the benzodiazepine sensitivity, and notably this isoform is developmentally regulated and expressed at low levels in the immature brain when seizures can be refractory to conventional AEDs23.
GABAAR function is also dependent on the transmembrane Cl− gradient, which is regulated by two major transporters: the Na+-K+-2Cl− (NKCC1) and the K+− Cl− (KCC2). In adult neurons, intracellular Cl− concentration is maintained at low levels due to the high KCC2 expression, therefore activation of these receptors results in a net Cl− influx and subsequent hyperpolarization 24. In contrast, immature neurons accumulate Cl− due to an age-specific upregulation of NKCC1 and a relative deficiency in KCC2 25,26, and therefore the receptor activation produces a net Cl− efflux and membrane depolarization. Not surprisingly, barbiturates that enhance GABAAR conductance are ineffective in suppressing electrographic seizures in human neonates 27. While experimental data demonstrate that combined therapy with barbiturates and bumetanide, a potent NKCC1 inhibitor, increases the efficacy of GABAergic inhibition in the neonatal brain 26,28, a recent case report shows that add-on bumetanide therapy decreased seizure activity in a neonatal patient 29.
There is accumulating evidence that human dysplastic tissue retains immature characteristics, including deficient cellular differentiation and maturation, as well as immature glutamatergic neurotransmitter receptors 8,30. Therefore, we hypothesized that TSC cortical tubers and FCD Type II lesions express immature GABAAR phenotypes, which may contribute to epileptogenesis and the relative resistance to conventional AEDs. We specifically examined the differential expression patterns of GABAAR subunits α1 and α4, and of Cl− transporters NKCC1 and KCC2 within TSC tubers and FCD lesions, relative to control non-epileptic tissue. In addition, we performed perforated-patch recordings to analyze the GABAAR responses in TSC dysplastic neurons, in comparison with normal-appearing cortical neurons within non-TSC epileptic tissue.
SUBJECTS/MATERIALS AND METHODS
Human subjects
In this study, we examined a total of 24 cortical tissue samples from TSC and FCD epilepsy patients (16 females and 8 males; mean age 10.3 years) and 10 control cases (6 females and 4 males; mean age 21.3 years). The main clinical and neuropathological characteristics of the study population are summarized in Table 1. TSC specimens were collected either from patients who underwent surgery for medically intractable epilepsy (n=8), or were obtained at autopsy (n=6). All patients were clinically diagnosed with TSC and presented a history of epilepsy. Postmortem TSC specimens (see Supplemental Methods) were obtained as a whole block containing both the diseased tissue and the surrounding normal-appearing cortex (a representative tissue block is shown in Supplemental Figure 1A–B). Tuberal tissue was dissected from within the distinct margins of the lesion, while the non-tuberal tissue was selected from areas of normal-appearing cortex well outside the lesion. Of note, we specifically avoided “perituberal” tissue within the border zone between the tuber and normal-appearing cortex, as the extent of neuropathological abnormalities in this area may vary among subjects. Consistent with its normal appearance, non-tuberal tissue demonstrated the same degree of mTORC1 activation as the control cortex (Supplemental Figure 1C). The non-tuberal tissue served as an internal control to correct for potential clinical variables, such as duration of epilepsy, seizure frequency or antiepileptic medication.
TABLE 1. Study Population.
Overview of the Clinical and Neuropathological Characteristics
| Case # | Gender | Age (Years) | Diagnosis | Brain Region |
|---|---|---|---|---|
| 1 | F | 1.4 | TSC | Parieto-occipital Tuber |
| 2 | M | 1.6 | TSC | Parietal Tuber |
| 3 | F | 2.5 | TSC | Temporal Tuber |
| 4 | F | 3 | TSC | Frontal Tuber |
| 5 | F | 3 | TSC | Occipital Tuber and Non-tuberal Cortex |
| 6 | F | 3.8 | TSC | Occipital Tuber |
| 7 | M | 4.8 | TSC | Parietal Tuber |
| 8 | F | 5 | TSC | Temporal Tuber |
| 9 | M | 7 | TSC | Temporal Tuber |
| 10 | F | 7 | TSC | Parietal Tuber and Non-tuberal Cortex |
| 11 | F | 20 | TSC | Frontal Tuber and Non-tuberal Cortex |
| 12 | M | 22 | TSC | Parietal Tuber and Non-tuberal Cortex |
| 13 | F | 22 | TSC | Parietal Tuber and Non-tuberal Cortex |
| 14 | F | 31 | TSC | Frontal Tuber and Non-tuberal Cortex |
| 15 | M | 1.2 | FCD IIb | Occipital and Frontal Lesions |
| 16 | F | 3 | FCD IIb | Frontal Lesion |
| 17 | M | 3 | FCD IIb | Temporal Lesion |
| 18 | F | 4 | FCD IIb | Parieto-occipital Lesion |
| 19 | F | 2.5 | FCD IIa | Frontal Lesion |
| 20 | M | 5 | FCD IIa | Temporal Lesion |
| 21 | F | 11 | FCD IIa | Temporal Lesion |
| 22 | M | 12 | FCD IIa | Occipital Lesion |
| 23 | F | 18 | FCD IIa | Temporal Lesion |
| 24 | F | 20 | FCD IIa | Temporal Lesion |
| 25 | M | 1 | Control | Parieto-occipital Lobe |
| 26 | F | 3 | Control | Parieto-occipital Lobe |
| 27 | F | 4.5 | Control | Occipital Lobe |
| 28 | M | 7.8 | Control | Occipital Lobe |
| 29 | F | 20 | Control | Frontal Lobe |
| 30 | M | 20 | Control | Parietal Lobe |
| 31 | F | 28 | Control* | Temporal Lobe |
| 32 | M | 31 | Control | Frontal Lobe |
| 33 | F | 41 | Control | Parieto-occipital Lobe |
| 34 | F | 57 | Control | Parieto-occipital Lobe |
Abbreviations: M, male; F, female; TSC, tuberous sclerosis complex; FCD, focal cortical dysplasia (Type IIa, IIb);
denotes the epilepsy control case used for comparison in the electrophysiology studies.
All FCD samples were obtained following epilepsy surgery for medically intractable epilepsy (n=10). The histopathological examination revealed dysplastic features consistent with FCD Type IIa (n=6) and Type IIb (n=4)13. The control group included cortical samples collected at autopsy from cases with normal neurological history (non-epilepsy controls; n=9), as well as non-dysplastic cortical tissue surgically removed due to medically intractable temporal lobe epilepsy (epilepsy control; n=1). This sample, devoid of dysplastic neurons, served as control for the electrophysiology experiments. All surgical specimens were obtained from the Departments of Neurosurgery at Children’s Hospital and Brigham and Women’s Hospital, Boston, MA. For these cases, additional clinical information (age at seizure onset, duration of epilepsy, seizure type and frequency, antiepileptic medication) is presented in Supplemental Table 1. The autopsy samples were obtained from the Brain and Tissue Bank for Developmental Disorders at the University of Maryland, Baltimore, MD and the Department of Neuropathology at Brigham and Women’s Hospital, Boston, MA. The postmortem interval (PMI) in all cases was 24 hours or less (mean 19.3 hours for TSC cases and 14.1 hours for controls). All tissues were collected and handled in accordance with the guidelines of the hospitals’ Institutional Review Boards.
Western Blot Analysis
Frozen cortical samples were processed for either membrane or whole cell protein extraction, as previously published 8 (see Supplemental Methods). Protein levels were calculated as percentage of the mean expression levels of control samples run on the same blot (100%). Means (of minimum 3 cases/group) were compared by two tailed t-tests and differences between groups were considered significant at p<0.05.
Immunocytochemistry
Paraformaldehyde (4%)-fixed tissue sections were stained using standard protocols 8 (see Supplemental Methods). Sections were analyzed by epifluorescence microscopy (Zeiss Axioscope, Germany). Digital images were acquired with a Spot digital camera and Spot Software 4.5 (Diagnostic Instruments, Sterling Heights, MI), and processed using Adobe Photoshop 12.0 (Adobe Systems, San Jose, CA).
Cortical brain slice preparation
Biopsy cortical tissue from one TSC (Table 1, Case 1) and one non-TSC epilepsy patient (Table 1, Case 31) was transported to the laboratory and, within 10–15 min from resection, 300μm thick slices were prepared and maintained as described in the Supplemental Methods.
Perforated-patch recordings
Perforated-patch recordings were obtained from identified dysplastic and non-dysplastic human cortical neurons by using an Axopatch 200A amplifier (Axon Instruments) with a sampling frequency of 10 kHz after low-pass filtering at 1 kHz, and the pClamp9 software (Clampex; Molecular Devices). The experimental procedures are described in detail in the Supplemental Methods. Statistical significant differences were established at p<0.05 using the Kolmogorov-Smirnov tests, or paired two-tailed t–test.
RESULTS
Differential expression levels of GABAA receptor α1 and α4 subunits in human TSC cortex
The expression of GABAAR subunits α1 andα4 in TSC cortical tubers, non-tuberal tissue and non-epileptic controls was quantified by Western blot (Figure 1). Cortical tubers demonstrated a significant reduction in membrane-expressed α1 subunit (Figure 1A) when compared to controls (59±7% of control, n=9, p<0.01), while there was no significant difference in the expression of α4 subunit (113±23% of control, n=9, p=0.6; Figure 1B). The resulting α4:α1 ratio was significantly increased in cortical tubers relative to controls (2.42±0.65 fold, n=8, p<0.05; Figure 1C). In contrast, non-tuberal TSC tissue revealed α1 and α4 expression levels comparable to controls (78±12% of control, n=6, p=0.6 for α1, and 84±10% of control, n=6, p=0.31 for α4; Figure 1A–B). Similarly, there was no significant difference inα4:α1 ratio between the non-tuberal tissue and controls (1.53±0.28 fold increase, n=6, p=0.58; Figure 1C). Decreased α1 expression and increasedα4:α1 ratio in cortical tubers correlated with upregulated mTORC1 signaling, as demonstrated by increased pS6 (Ser 235/236) levels (316±60% of control, n=8, p<0.01; Supplemental Figure 1). Altered GABAAR subunit composition in TSC cortical tubers may lead to reduced regional inhibition and decreased receptor responsiveness to benzodiazepine.
Figure 1. Differential expression of GABAA receptor subunits in human cortical tubers and non-tuberal cortex.

A. Western blot quantification of GABAAR subunit α1 demonstrates a significant decrease in cortical tubers, but levels comparable to control in the non-tuberal cortex. B. Quantitative western blot analysis for GABAAR subunit α4 shows normal expression levels in cortical tubers and in the non-tuberal cortex. C. α4:α1 ratios are significantly increased in TSC cortical tubers, but not in the non-tuberal tissue. Histograms represent averaged optical density normalized to actin, and expressed relative to the mean control values. Insets are the representative western blots for individual proteins. *: p < 0.05. Error bars indicate S.E.M.
As deficient GABAergic inhibition may also result from reduced number of interneurons and/or decreased inhibitory terminals, we next quantified the tuberal and non-tuberal expression levels of the glutamic acid decarboxylase -67 (GAD-67), a GABA-converting enzyme selectively expressed in inhibitory neurons. Interestingly, we found no significant changes in GAD-67 expression in cortical tubers (82±10% of control, n=9, p=0.30) and non-tuberal tissue (99±13% of control, n=6, p=0.94; data not shown), relative to non-epileptic controls.
Altered NKCC1 and KCC2 expression levels in human TSC cortex
Western blot analysis for NKCC1 and KCC2 was similarly performed on membrane protein extracts from TSC cortical tubers, non-tuberal TSC tissue and non-epileptic control cortex (Figure 2A–B). Cortical tubers demonstrated a significant upregulation of NKCC1 expression (133±15% of control, n=10, p<0.05; Figure 2A), accompanied by a significant reduction in KCC2 levels (59±6% of control, n=10, p<0.001; Figure 2B). Unlike cortical tubers, the non-tuberal tissue showed significantly lower NKCC1 expression (74±10% of control, n=6, p<0.05), but KCC2 levels comparable to controls (84±9% of control, n=6, p=0.19). Consistently, the NKCC1: KCC2 ratios were significantly higher in cortical tubers (1.78±0.25 fold increase, n=10, p<0.01), while the ratios were similar to control levels in the non-tuberal tissue (1.08±0.21 fold, n=6, p=0.6; Figure 2C). These data suggest that hyperactivation of mTORC1 within cortical tubers (Supplemental Figure 1C) leads to dysregulation of Cl− transport, and that activation of GABAARs within these lesions might contribute to membrane depolarization.
Figure 2. Dysregulated expression of Cl− transporters NKCC1 and KCC2 in cortical tubers and non-tuberal human cortex.

A. Membrane-expressed NKCC1 transporter is significantly increased in cortical tubers, while downregulated in the non-tuberal cortex when compared to control. B. Western blot analysis for KCC2 shows decreased expression in cortical tubers and expression levels comparable to controls in the non-tuberal cortex. C. NKCC1:KCC2 ratios are significantly increased in TSC cortical tubers, but no different from controls in the non-tuberal tissue. Histograms represent averaged optical density normalized to actin, and expressed relative to the mean control values. Insets are the representative western blots for individual proteins. *: p < 0.05. Error bars indicate S.E.M.
Cell-specific expression of NKCC1 and KCC2 transporters in human TSC cortical tubers
As our western blot analysis demonstrated significant changes in the membrane expression of Cl− transporters (Figure 2), we next aimed to evaluate the cell-specific staining pattern of NKCC1 (Figure 3) and KCC2 (Figure 4) in TSC lesions. In addition, as we observed that dysregulated NKCC1 and KCC2 expression correlated regionally with the degree of mTORC1 activation (Supplemental Figure 1C), we next compared the cellular specificity of NKCC1 and KCC2 with that of pS6 (Supplemental Figure 2). Double labeling with pS6 and neuronal and glial markers (NeuN, SMI 311, vimentin and GFAP) demonstrated marked increases in pS6 expression in the majority of dysplastic neurons (Supplemental Figure 2A–C, small arrows), giant cells (Supplemental Figure 2D–F and J–L, arrowheads), dysplastic astrocytes (arrowheads in Supplemental Figure 2A–C and G–I), but not in normal-sized neurons (Supplemental Figure 2G–I, small arrows) and reactive astrocytes (Supplemental Figure 2J–L, small arrows) (n=4). The selective activation pattern of mTORC1 in dysplastic cells was consistently observed in all cortical tubers analyzed, and is in agreement with previous publications 8,10,15,16. Cellular expression pattern of NKCC1 differed from pS6, as the transporter was highly expressed in cytomegalic dysplastic neurons (Figure 3A–C, arrowheads), giant cells (Figure 3D–F, arrowheads) and dysplastic astrocytes (Figure 3A–C, small arrows), but also in normal-sized neurons (Figure 3D–F, small arrows and Figure 3G–I) and reactive astrocytes (Figure 3J–L) (n=4). This pattern suggests that within the tuber, in addition to mTORC1 dysfunction, the ictal activity may secondarily induce changes in NKCC1 expression in pS6 negative normal sized neurons and reactive astrocytes. In contrast, in the predominantly normal appearing adjacent cortex both NKCC1 and pS6 expression were very low or undetectable (n=3; data not shown).
Figure 3. Cell-specific expression of NKCC1 in human cortical tubers.
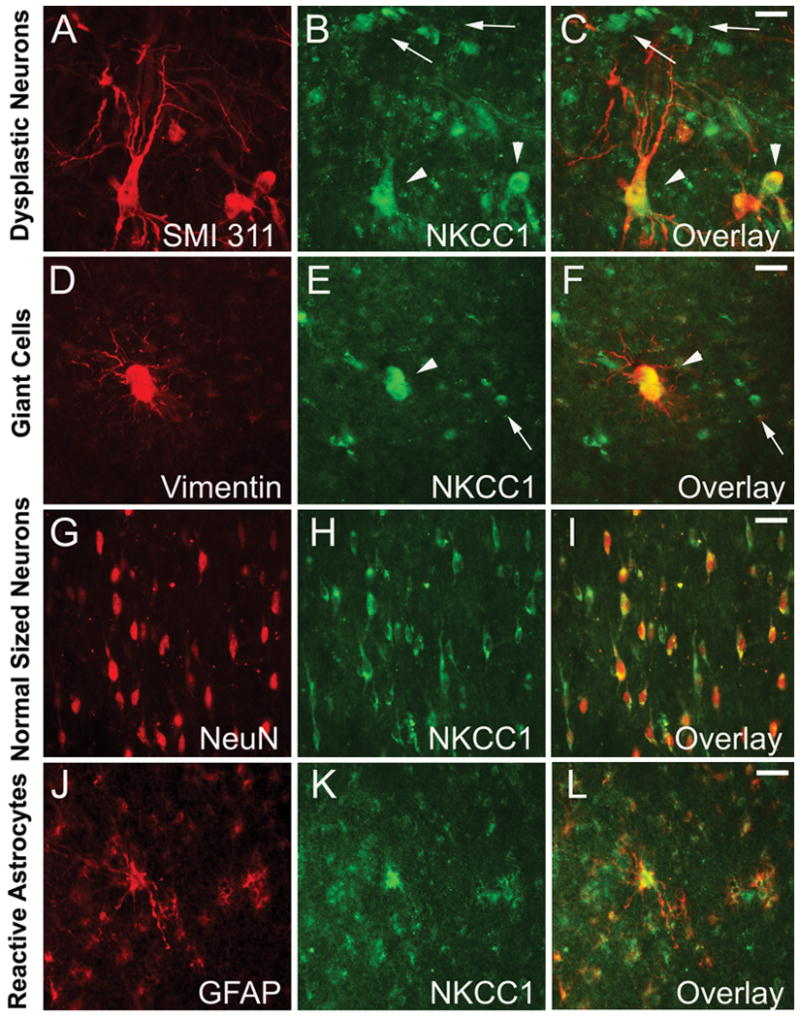
A–C. Double-label immunocytochemistry for non-phosphorylated neurofilament SMI 311 and NKCC1 demonstrates high NKCC1 expression in dysplastic neurons (arrowheads), as well as in other non-neuronal dysplastic cells (small arrows). D–F. NKCC1 is highly expressed in vimentin positive giant cells (arrowheads) and vimentin negative normal-sized neurons (small arrows). G–I. Strong NKCC1 immunoreactivity is present in NeuN expressing disoriented immature neurons. J–L. GFAP-expression reactive astrocytes within cortical tubers are also highly NKCC1 positive. Scale bars represent 20μm in all panels.
Figure 4. Differential cellular distribution of KCC2 in human cortical tubers.

A–C. NeuN positive immature and dysplastic neurons within the tuber demonstrate very low KCC2 expression surrounding the cell body and proximal dendrites. Dysplastic neurons show intense KCC2 immunoreactivity in the cytoplasm (B–C, arrowheads). D–F. Normal appearing NeuN neurons in the adjacent cortex demonstrate high perisomatic KCC2 expression, and low or no intracellular labeling (E–F, arrowheads). Insets (D1–F1) show corresponding higher magnification of individual cells. Scale bars are 20mm for A–F and 10 mm for D1–F1.
While NKCC1 is widely expressed in both neuronal and glial cell types, KCC2 has been shown to be exclusively expressed in neurons 31. Indeed, we found that in TSC cortical tubers KCC2 was only expressed in dysplastic and normal neurons, but not in undifferentiated giant cells or dysplastic astrocytes. Consistent with our western blot data showing decreased membrane-bound expression for this transporter (Figure 2), we found a marked diffuse decrease in KCC2 perisomatic neuropil staining within cortical tubers (Figure 4) (n=4). A striking observation was the abnormally high intrasomatic labeling pattern in the cytomegalic dysplastic neurons (Figure 4A–C, arrowheads), which was not observed in normal appearing neurons (Figure 4D–F, arrowheads). The intracellular KCC2 expression in dysplastic neurons correlated at a cellular level with upregulated mTORC1 signaling (Supplemental Figure 2). Similar KCC2 expression pattern was previously reported in normal developing neurons, in which the transporter is accumulated in the cytoplasm prior to its incorporation into the cellular membrane 32. These immunocytochemical data further suggest that altered Cl− transporter expression in TSC dysplastic neurons could in turn compromise Cl− homeostasis and reverse GABA-mediated inhibition to excitation.
Decreased BDNF expression in TSC cortical tubers
Brain derived neurotrophic factor (BDNF) plays a critical role in the formation, maturation and stabilization of inhibitory synapses during normal CNS development 33,34 and its expression is highest in the immature brain 35. As the expression profiles of GABAAR subunits and Cl− transporters in TSC dysplastic neurons are compatible with an immature status, we next aimed to determine if there were differences in endogenous BDNF expression in the tuberal and non-tuberal tissue relative to non-epileptic controls that may contribute to these changes. Western blot quantification demonstrated that BDNF levels (Figure 5) were significantly downregulated in cortical tubers (66±7% of control, n=9, p<0.01), while non-tuberal tissue was not different from control tissue (86±8% of control, n=6, p=0.23). Our data thus support the hypothesis that the relative BDNF deficiency in TSC cortical tubers, along with constitutive upregulation of mTORC1 signaling, might contribute to the maintenance of an immature transcriptional pattern in these lesions.
Figure 5. Decreased BDNF expression in TSC cortical tubers.

Western blot quantification of whole cell homogenates demonstrates a significant decrease in endogenous BDNF levels in cortical tubers, but levels comparable to control in the non-tuberal cortex. Histograms are averaged optical density normalized to actin, and expressed relative to the mean control values. Insets are the representative western blots for individual proteins. *: p < 0.05. Error bars indicate S.E.M.
Evidence for Cl− transport dysfunction in human TSC cortical neurons
Given the protein expression changes in cortical tubers, we performed electrophysiological analysis of GABAAR responses in biopsy tissue from a single human TSC case, in comparison to an epilepsy control case without evidence of cellular dysplasia. To maintain the intact intracellular Cl− concentration, we used the gramicidin perforated patch-clamp recording technique in all experiments. We first examined spontaneous GABAAR-mediated post-synaptic currents (PSCs) in normal-appearing cortical neurons of acute cortical slices from the epilepsy control tissue (Figure 6A). As shown in Figure 6A1, the neuron had a resting membrane potential of −60.4 mV and an input resistance of 262 MΩ. With a holding potential of −60 mV, we observed both inward excitatory PSCs mediated by AMPA/NMDA receptors as evidenced by complete blockade with the specific receptor antagonists NBQX and DL-AP5, as well as outward inhibitory GABAAR-mediated PSCs, isolated by blocking AMPA and NMDA receptor-mediated PSCs (Figure 6A2). The reversal potential of GABAAR-mediated PSCs in the normal appearing neurons were close to −70 mV, and were completely abolished by bath application of 60μM picrotoxin (PTX), confirming that they were mediated by GABAARs.
Figure 6. Dysplastic neurons in TSC cortical tubers present depolarizing GABAA receptor responses that are bumetanide sensitive.

A. Inhibitory GABAA receptor responses in cortical ex vivo slices from a non-TSC epilepsy case. A1. Representative differential interference contrast (DIC) image of normal-appearing neurons recorded in cortical ex vivo slices. A2. First panel: Representative current traces of perforated-patch voltage clamp recordings at a holding potential of −60mV. Note that both inward excitatory PSCs and outward inhibitory PSCs presented at −60 mV holding potential. Insert traces show individual outward PSCs in detail at expanded time scale. Second panel: Outward inhibitory PSCs were removed by increasing the holding potential to −70mV. Third panel: Inward excitatory sPSCs were blocked by bath application of AMPA and NMDA receptor antagonists: 2,3-dihydroxy-6-nitro-7-sulfamoyl-benzo[f]quinoxaline-2,3-dione (NBQX, 10 μM), and DL-2-Amino-5-phosphonopentanoic acid (DL-AP5, 100μM) at a holding potential of −70 mV. Fourth panel: Outward inhibitory GABAA receptor mediated PSCs appeared when the holding potential is decreased from −70 mV to −60 mV. Fifth panel: Outward inhibitory GABAA receptor mediated PSCs were completely abolished by bath application of picrotoxin (PTX, 60μM). Insert traces show individual outward PSCs in detail at expanded time scale. B. Bumetanide-sensitive depolarizing GABAA receptor responses in dysplastic neurons in TSC cortical tubers. B1. Representative DIC image of dysplastic neurons in cortical ex vivo slices from a TSC patient. B2. First panel: Repregsentative current traces of perforated-patch voltage clamp recordings at a holding potential of −60mV. Second panel: GABAAR -mediated sPSCs were isolated by bath application of AMPA and NMDA receptor antagonists: NBQX (10 μM), and DL-AP5 (100μM). Third panel: Bath application of bumetanide (BUM, 10μM) significantly attenuated GABAAR mediated sPSCs. Fourth panel: Spontaneous PSCs were completely abolished by bath application of picrotoxin (PTX, 60μM). B3. Normalized cumulative distribution of GABAAR sPSCs demonstrates a significant decrease in amplitude by bumetanide (p < 0.01, Kolmogorov–Smirnov test). B4 and B5. Both amplitude (B4) and frequency (B5) of GABAAR mediated sPSCs are effectively inhibited by bath application of bumetanide. Scale bars represent 20μm in A1 and B1.
We next performed recordings in acute TSC cortical tuber slices from dysplastic neurons under guidance of DIC imaging (Figure 6B1). In contrast to the normal neurons in epilepsy control tissue, these dysplastic neurons exhibited depolarizing GABAAR-mediated spontaneous PSCs (Figure 6B2), consistent with NKCC1 and KCC2 expression pattern observed by western blot and immunocytochemical analysis. Current clamp recordings revealed that the resting membrane potential of dysplastic cortical neurons was −58.7 mV with an input resistance of 238 MΩ. GABAAR-mediated PSCs were isolated by blocking AMPA and NMDA receptor-mediated PSCs under voltage clamp mode with a holding potential of −60 mV, close to the resting membrane potential. Spontaneous PSCs were completely abolished by bath application of 60μM PTX, demonstrating that they were mediated by GABAARs. GABAAR-mediated PSCs were excitatory with relatively high frequency and amplitude (sPSC amplitude: 29.1 pA; sPSC frequency: 2.8 Hz), indicating an excitatory GABA function and depolarized GABA reversal potential, or high [Cl−]i (Figure 6B3). Post-recording immunocytochemical double labeling confirmed increased pS6 and NKCC1, and decreased KCC2 expression in these cells (data not shown).
We next tested the effects of the NKCC1 blocker bumetanide 28 on GABAAR mediated excitatory PSCs in human TSC slices. Bath application of 10μM bumetanide (BUM) effectively suppressed PSC amplitude (50.2% of control) and frequency (53.6% of control) (Figure 6B2-B5). This is consistent with previously published data showing an inhibitory effect of bumetanide on depolarized GABA reversal potential in hippocampal neurons during neonatal seizures 28. Our data confirm the functional dysregulation of Cl− transport in human TSC dysplastic neurons and suggest that preventing GABA mediated excitation in TSC dysplastic cortex with bumetanide may represent a new therapeutic strategy for seizure control in TSC patients.
Comparison analysis between TSC and FCD Type II
As the severe focal cortical dysplasias (FCD Type II) share numerous histopathological, clinical and biochemical features of TSC, including altered mTORC1 signaling 2, it is possible that they also present similar alterations in GABAAR expression and function. To test this hypothesis, we next performed a comparative analysis of GABAAR subunits, and Cl− transporters NKCC1 and KCC2 in FCD Type IIa and Type IIb tissue (Figure 7). Western blot quantification of GABAAR subunits α1 and α4 in FCD IIa cases demonstrated no changes in the expression of α1 subunit compared to control (112±41% of control, n=6, p=0.69). However, the α4 subunit was actually down regulated (49±8% of control, n=4, p<0.05; Figure 7A), with a significant decrease in the α4:α1 ratio compared to non-epileptic controls (0.64±0.21 fold, n=4, p<0.05; Figure 7B). In contrast, FCD Type IIb cases showed a significant reduction in α1 subunit expression (34±8% of control, n=4, p<0.01), but no significant differences in α4 levels (81±23% of control, n=4, p=0.57; Figure 7A), resulting in a significant increase in the α4:α1 ratio (2.94±0.8 of control, n=3, p<0.001; Figure 7B), similar to the pattern observed in TSC cortical tubers.
Figure 7. Altered GABAergic inhibition in focal cortical dysplasia (FCD) Type IIa and Type IIb.

A. Western blot quantification of GABAAR subunits α1 and α4 demonstrate a significant α1 decrease in FCD Type IIb, and a significant α4 downregulation in FCD Type IIa. B. The relative abundance of α4 subunit (α4:α1 ratio) is significantly increased in FCD Type IIb and decreased in FCD Type IIa. C. Quantitative western blot analysis for Cl− transporters NKCC1 and KCC2 demonstrates increased NKCC1 and decreased KCC2 levels in FCD Type IIb, in contrast to increased NKCC1 and upregulated KCC2 in FCD Type IIa. D. This pattern results in significantly increased NKCC1:KCC2 ratios in FCD Type IIb. Histograms represent averaged optical density normalized to actin, and expressed relative to the mean control values. Doted lines in A. and C. represent the mean control levels. Insets are the representative western blots for individual proteins. *: p < 0.05. Error bars indicate S.E.M.
Unlike cortical tubers where we found only a slight decrease in GAD-67 levels, here we found a marked reduction in GAD-67 expression in both FCD Type IIa (25±6% of controls, n=3, p<0.05) and FCD Type IIb lesions (36±12% of controls, n=4, p<0.05; data not shown). These data are consistent with previous observations of reduced number of interneurons in cortical dysplasia 36, relative to TSC cortical tubers where the interneurons appear to be less affected 10.
Next we quantified the expression levels of NKCC1 and KCC2 in both types of FCD II samples. In FCD Type IIa, both NKCC1 and KCC2 were significantly unregulated (252±62% of control, n=4, p<0.001 for NKCC1, and 193±46% of control, n=6, p<0.01 for KCC2; Figure 7C), with no significant change in the NKCC1: KCC2 ratio compared to controls (1.83±0.6 fold, n=4, p=0.06; Figure 7D), suggesting rather hyperpolarizing and inhibitory GABAARs. In contrast, FCD Type IIb cases showed a significant increase in NKCC1 expression (138±21% of control, n=3, p<0.05) with a significant reduction in KCC2 levels (40±7% of control, n=5, p<0.001; Figure 7C). Similar to TSC cortical tubers, the NKCC1:KCC2 ratio in FCD Type IIb was significantly higher relative to controls (3.6±0.7 fold increase, n=3, p<0.001; Figure 7D), suggesting that GABAARs could have the capacity to be depolarizing in this disorder, consistent with previous observations37.
Double-label immunocytochemical staining of FCD Type IIa and Type IIb showed critical differences in KCC2 expression patterns in the setting of high NKCC1 expression (Figure 8). In FCD Type IIa, KCC2 demonstrated high neuropil and membrane expression in the majority of neurons (Figure 8B–C, small arrows) (n=3), while in FCD Type IIb lesions there was a marked decrease in KCC2 staining in the neuropil around neuronal cell bodies (Figure 8D–F) (n=3). In contrast, similar to TSC cortical tubers, the dysplastic neurons in FCD Type IIb lesions demonstrated the same KCC2 accumulation in the cytoplasm (Figure 8E–F, arrowheads), while no membrane or cytoplasmic KCC2 staining was observed in balloon cells (data not shown). NKCC1 expression was not different between FCD IIa and IIb. In FCD Type IIa, dysplastic and nondysplastic neurons, as well as most reactive astrocytes showed high NKCC1 levels (n=4, data not shown). Similarly, in FCD Type IIb NKCC1 was highly expressed in dysplastic neurons, balloon cells, immature and normal appearing neurons and reactive astrocytes, resembling the pattern seen in TSC cortical tubers (n=4, data nor shown).
Figure 8. Sub-cellular KCC2 distribution in human FCD Type II lesions.

A–C. NeuN positive dysplastic neurons in FCD Type IIa lesions demonstrate high perisomatic KCC2 localization, but no cytoplasmic expression (B–C, small arrows). D–F. In contrast, SMI 311 expressing dysplastic neurons in FCD Type IIb lesions show very low perisomatic KCC2 expression, but diffuse KCC2 staining in the cytoplasm (E–F, arrowheads). Scale bars are 50μm for A–F.
In summary, this comparative analysis shows striking similarities between TSC and FCD Type IIb with respect to GABAAR subunits, NKCC1 and KCC2 expression patterns, which are distinct from FCD Type IIa. These findings suggest possible common, or at least partially overlapping pathophysiological mechanisms of epileptogenesis in the first two entities.
DISCUSSION
In this study we demonstrate that TSC cortical tubers and FCD Type IIb lesions express similar alterations in GABAAR subunit composition, as well as dysregulated NKCC1 and KCC2 levels that may result in altered inhibitory function and subsequent epileptogenesis. These changes are not seen in FCD type IIa, suggesting potentially shared mechanisms of epileptogenesis for TSC and FCD Type IIb. In addition, this is the first demonstration of an effect of bumetanide in human brain slices, and we show that dysplastic neurons from one TSC patient display excitatory GABAAR responses that are effectively attenuated by the NKCC1 inhibitor bumetanide. Thus, our data may justify further consideration of clinical trials using FDA- approved NKCC1 inhibitors as adjunctive therapy for refractory epilepsy in TSC and FCD Type IIb, but not FCD Type IIa.
Differential postsynaptic GABAA receptor alpha subunit alterations in TSC, FCD Type IIb and FCD Type IIa
Our study demonstrates striking similarities in the expression of GABAAR subunits in TSC and FCD Type IIb lesions. We show that α1 subunit expression is significantly decreased with resultant increases in α4:α1 ratios in both pathologies. While these data are the first to report altered GABAAR subunit protein expression in TSC, our findings are consistent with previous reports of decreased α1 mRNA levels in TSC cortical tubers 12. The reported changes in GABAAR subunit protein in FCD Type IIb cases is consistent with previously reported electrophysiological and pharmacological properties of cytomegalic neurons from FCD Type II lesions 36,38. Longer GABAAR kinetics, decreased sensitivity to benzodiazepines (zolpidem), and increased responses to bretazenil in FCD Type II neurons, relative to neurons from FCD Type I or non-dysplastic cortex, is consistent with decreased expression of α1 relative to α3, α4, orα5 GABAARsubunits 21. In contrast, we show the opposite pattern in FCD Type IIa cases, with a significant reduction in α4 subunit expression and decreased α4: α1 ratio. These changes are suggestive of better responsiveness of FCD Type IIa patients to benzodiazepines compared to FCD Type IIb and TSC cases. Interestingly, unlike TSC and FCD Type IIb lesions, FCD Type IIa is characterized by a milder cellular dysplasticity, including the absence of balloon cells, and is usually associated with a less severe seizure phenotype, such as later onset and lower seizure frequency (Supplemental Table 1)13,39.
Numerous animal studies have shown that alterations in GABAAR α subunits are associated with development of chronic epilepsy. In rodents, status epilepticus (SE) induces acute decreases in α1 expression and upregulation of α4 (increased α4:α1 ratios), which correlate with profound changes in GABAAR function such as slower kinetics and decreased benzodiazepine sensitivity40. Importantly, these changes precede the development of epilepsy, while overexpression of α1 subunit (decreased α4:α1 ratios), reduces the incidence of spontaneous seizures after SE by 60%41, supporting the role of this subunit in mediating refractory epilepsy and/or epileptogenesis.
Dysregulation of NKCC1 and KCC2 expression consistent with altered Cl− homeostasis in TSC and FCD Type IIb, but not FCD Type IIa
Here we show for the first time that in TSC cortical tubers the expression of Cl− transporters NKCC1 and KCC2 is significantly altered, specifically we found increases in NKCC1 expression associated with downregulated KCC2 levels (increased NKCC1: KCC2 ratios). At a cellular level, NKCC1 expression was increased in neurons and glia. Compared to normal neuronal expression of KCC2 that is confined to the cellular membrane, dysplastic neurons in TSC cortical tubers showed accumulation of KCC2 in the cytoplasm, and relative depletion in the neuropil. Interestingly, this specific cellular pattern we report here in TSC cortical tubers was previously observed in FCD Type IIb 42,43, further supporting the idea that both pathologies may share the same mechanisms of epileptogenesis. In contrast, KCC2 membrane expression was actually increased in FCD Type IIa lesions, consistent with prior reports 44,45, and might be related to their lower refractoriness, or may represent a compensatory mechanism to prevent development of epilepsy46.
The subcellular localization of KCC2 protein most critically regulates its function, and previous developmental studies have demonstrated that KCC2 is constitutively expressed in neurons even during the early stages when GABAA receptors are depolarizing. However, in neonatal neurons KCC2 is mostly expressed within the cytoplasm, but gradually inserted into the membrane with increasing age, which coincides with the reversal of GABA polarity 32. Targeting of KCC2 to the neuronal cell surface is critically regulated by protein kinase (PKC), which is one of the known downstream targets of mTOR Complex 2 (mTORC2). PKC-dependent phosphorylation of KCC2 inhibits its endocytosis, and at the same time increases the membrane-bound transporter activity 47. In TSC, mTORC2 function is reduced, which has been shown to decrease PKC activity 48. This mechanism may provide a link between TSC1/TSC2 deficiency and altered expression and function of KCC2 in human cortical tubers. This also raises the possibility that signaling molecules that activate PKC signaling pathways may restore neuronal Cl− homeostasis in these lesions.
Decreased GABAergic inhibition mediated by depolarizing GABAARs may represent a critical mechanism of epileptogenesis in TSC and FCD Type IIb lesions. Increases in the expression of NKCC1 relative to KCC2 (increased NKCC1: KCC2 ratios) have been previously associated with depolarizing GABA responses and implicated in the pathophysiology of various types of seizures, including neonatal seizures and temporal lobe epilepsy 26,49,50. In addition, it has been shown that KCC2 deficiency leads to increased neuronal excitability and enhanced seizure susceptibility 51,52.
Evidence for depolarizing GABAA receptors in TSC cortical tubers
While our expression data suggested a shift of GABA polarity towards excitation in TSC cortical neurons, we were also able to demonstrate GABAAR mediated excitatory postsynaptic responses in dysplastic neurons from one TSC case. Using whole-cell patch clamp recordings, a previous study by Cepeda et al. 37 has reported depolarized GABA reversal potentials and excitatory GABA responses in severe FCD lesions, compared to mild FCD or non-dysplasia cases. However, the whole-cell recording technique may cause the dialysis disruption of [Cl−]i that critically regulates GABA reversal potential. Gramicidin-perforated patch recordings were applied in the present study to keep [Cl− ]i intact 53, and as expected the normal appearing neurons in non-TSC tissue showed inhibitory GABAAR- mediated PSCs at resting membrane potential. In contrast, slices from a TSC tuber exhibited excitatory GABAAR- mediated PSCs at resting membrane potential, indicating a depolarized GABA reversal potential and high [Cl−]i in dysplastic neurons. Importantly, the specific NKCC1 blocker bumetanide effectively attenuated these GABAAR-mediated responses, supporting a potential role for abnormally high NKCC1:KCC2 membrane ratios as promoting network hyperexcitability. Thus, our data suggests that excitatory GABA responses in TSC may contribute to the relative refractoriness of GABAergic antiepileptic drugs in this patient population, and that bumetanide may represent a novel adjuvant therapeutic strategy for seizure control in TSC.
Epileptogenic mechanisms in TSC and FCD Type IIb may be different from FCD IIa
The expression patterns of the of GABAARs and Cl− transporters suggesting that lesional expression profiles in TSC and FCD Type IIb cases are persistent immature transcriptional phenotypes 37,54, similar to patterns observed for glutamate receptors 8,18. Alternatively, acute post-ictal changes in GABAAR kinetics and subunit expression as well as upregulation of NKCC1 with simultaneous downregulation of KCC2 have been previously reported in rodent epilepsy models in adult rats 40,50,55, raising the possibility that ongoing seizure activity may be in part responsible for altered expression and function of GABAARs in TSC and FCD Type IIb. However, as the additional analysis of TSC non-tuberal tissue revealed no significant changes compared to controls, this mechanism cannot fully explain the observed changes.
The mechanisms that regulate the development of GABAergic inhibition are still not fully elucidated. Immature GABAARs are characterized by an abundance of α2 and α4 subunits, while the incorporation of α1 coincides with brain maturation 23. At the same time, in the developing brain, GABAARs are depolarizing, a feature that has multiple age-specific physiologic functions, including the control of neuronal differentiation and dendritic development 56,57. In addition, these receptors enable NMDARs function, otherwise inhibited by a voltage-dependent Mg2+ blockade, facilitating the excitatory synapse formation in the neocortex 58. In contrast, the switch in the action of GABA from excitatory to inhibitory, which in human neocortex occurs by the end of the first year of life 26, coincides with augmentation of GABAergic synapses 59. This suggests that in the human dysplastic TSC and FCD Type IIb lesions, the persistence of depolarizing GABAARs might not just compromise GABAergic inhibition, but also might be responsible for the maintenance of immature glutamate receptor profiles (GluR2 lacking AMPA receptors and NR2B/NR3A containing NMDA receptors) and enhancement of glutamate receptor functions during epileptogenesis 8.
Importantly, both Cl− transporters and GABAARs are regulated, among other factors, by BDNF. Transgenic mice over-expressing BDNF demonstrate higher rates of GABAergic synaptogenesis and GABA production, as well as increased KCC2 expression 33, while heterozygous BDNF knockout mice demonstrate reduced efficiency of GABAergic inhibition, consistent with an immature status 34. Our data showing a significant reduction in endogenous BDNF levels in TSC suggest a potential role of this neurotrophin in abnormal GABAergic synaptic maturation in these lesions.
Implications for treatment
The most common AEDs action involves modulation of GABAergic function, either by modulating the post-synaptic GABAA receptors (barbiturates and benzodiazepine), or by acting on synaptic GABA availability (vigabatrin). Our data suggests that GABAARs in TSC and FCD IIb lesions are not only likely to be insensitive to benzodiazepine but are also depolarizing, so drugs that increase GABAergic function may fail to suppress seizures or even induce hyperexcitability. In neonatal rat brain, combined therapy with barbiturates and an NKCC1 inhibitor such as bumetanide increases the efficacy of GABAergic inhibition 28, and a clinical trial testing the safety and efficacy of bumetanide/phenobarbital therapy in neonatal seizures is currently ongoing (clinicaltrials.gov/NCT00830531). Similar to the neonatal patient population, a more specific therapeutic approach to control seizures in TSC and FCD Type IIb patients might be needed, such as combining bumetanide with an AED that enhances GABAA receptor function.
Supplementary Material
A–B. Typical macroscopic appearance of dysplastic and nondysplastic brain tissue. The small arrows indicate the sharp contrast between tuberal and non-tuberal portions of the specimen, while the arrowheads show the approximate location of dissected tissue. C. Western blot quantification of whole cell homogenates demonstrates a significant increase in pS6 expression levels in cortical tubers, but levels comparable to control in the non-tuberal cortex. Histograms are averaged optical density normalized to actin, and expressed relative to the mean control values. Insets are the representative western blots for individual proteins. *: p < 0.05. Error bars indicate S.E.M.
A–C. Double-label immunocytochemistry for non-phosphorylated neurofilament SMI 311 and pS6 demonstrates hyperactivation of mTORC1 signaling in tuber dysplastic neurons (small arrows) and dysplastic astrocytes (arrowheads). D–F. Vimentin positive giant cells express high pS6 levels. G–I. NeuN-expressing normal-seized neurons within cortical tubers express low levels of pS6 (small arrow), in contrast to high pS6 expression in dysplastic astroglia (arrowheads). J–L. Reactive astrocytes labeled with GFAP express low/no pS6 (small arrow), while giant cells (arrowheads) are highly pS6 positive. Scale bars represent 20μm in all panels.
Acknowledgments
The authors wish to thank Dr. Kevin Staley for his advice during the course of this study, as well as Kathia Cordero for her technical help in the early stages of this work. This work was supported by the CURE Quest Award (D.M.T.), Lombroso Trust (DMT), and the National Institutes of Health (NIH) Grants: NS 31718 (NINDS) (F.E.J.), DP1 OD003347 (from the Office of the Director) (F.E.J.), NS 040109 (NINDS) (F.E.J.), and Intellectual Developmental Disabilities Center Grant P30 HD18655 (NICHHD). Additional human tissue was obtained from the NICHD Brain and Tissue Bank for Developmental Disorders at the University of Maryland, Baltimore, MD.
Footnotes
The authors have no conflict of interest to disclose.
References
- 1.Sisodiya SM, Fauser S, Cross JH, Thom M. Focal cortical dysplasia type II: biological features and clinical perspectives. Lancet Neurol. 2009;8:830–843. doi: 10.1016/S1474-4422(09)70201-7. [DOI] [PubMed] [Google Scholar]
- 2.Orlova KA, Crino PB. The tuberous sclerosis complex. Ann N Y Acad Sci. 2010;1184:87–105. doi: 10.1111/j.1749-6632.2009.05117.x. [DOI] [PMC free article] [PubMed] [Google Scholar]
- 3.de Vries PJ. Targeted treatments for cognitive and neurodevelopmental disorders in tuberous sclerosis complex. Neurotherapeutics. 2010;7:275–282. doi: 10.1016/j.nurt.2010.05.001. [DOI] [PMC free article] [PubMed] [Google Scholar]
- 4.van Slegtenhorst M, et al. Identification of the tuberous sclerosis gene TSC1 on chromosome 9q34. Science. 1997;277:805–808. doi: 10.1126/science.277.5327.805. [DOI] [PubMed] [Google Scholar]
- 5.Robinson S. Systemic prenatal insults disrupt telencephalon development: implications for potential interventions. Epilepsy Behav. 2005;7:345–363. doi: 10.1016/j.yebeh.2005.06.005. [DOI] [PMC free article] [PubMed] [Google Scholar]
- 6.Bartova E, et al. Structure and epigenetics of nucleoli in comparison with non-nucleolar compartments. J Histochem Cytochem. 2010;58:391–403. doi: 10.1369/jhc.2009.955435. [DOI] [PMC free article] [PubMed] [Google Scholar]
- 7.Han JM, Sahin M. TSC1/TSC2 signaling in the CNS. FEBS Lett. 2011;585:973–980. doi: 10.1016/j.febslet.2011.02.001. [DOI] [PMC free article] [PubMed] [Google Scholar]
- 8.Talos DM, Kwiatkowski DJ, Cordero K, Black PM, Jensen FE. Cell-specific alterations of glutamate receptor expression in tuberous sclerosis complex cortical tubers. Ann Neurol. 2008;63:454–465. doi: 10.1002/ana.21342. [DOI] [PMC free article] [PubMed] [Google Scholar]
- 9.Hajime Miyata ACYCHVV. Insulin signaling pathways in cortical dysplasia and TSC-tubers: Tissue microarray analysis. Annals of Neurology. 2004;56:510–519. doi: 10.1002/ana.20234. [DOI] [PubMed] [Google Scholar]
- 10.Baybis M, et al. mTOR cascade activation distinguishes tubers from focal cortical dysplasia. Ann Neurol. 2004;56:478–487. doi: 10.1002/ana.20211. [DOI] [PubMed] [Google Scholar]
- 11.Boer K, et al. Cellular localization of metabotropic glutamate receptors in cortical tubers and subependymal giant cell tumors of tuberous sclerosis complex. Neuroscience. 2008;156:203–215. doi: 10.1016/j.neuroscience.2008.06.073. [DOI] [PubMed] [Google Scholar]
- 12.White R, et al. Selective alterations in glutamate and GABA receptor subunit mRNA expression in dysplastic neurons and giant cells of cortical tubers. Ann Neurol. 2001;49:67–78. doi: 10.1002/1531-8249(200101)49:1<67::aid-ana10>3.0.co;2-l. [DOI] [PubMed] [Google Scholar]
- 13.Palmini A, et al. Terminology and classification of the cortical dysplasias. Neurology. 2004;62:S2–S8. doi: 10.1212/01.wnl.0000114507.30388.7e. [DOI] [PubMed] [Google Scholar]
- 14.Blumcke I, et al. The clinicopathologic spectrum of focal cortical dysplasias: a consensus classification proposed by an ad hoc Task Force of the ILAE Diagnostic Methods Commission. Epilepsia. 2011;52:158–174. doi: 10.1111/j.1528-1167.2010.02777.x. [DOI] [PMC free article] [PubMed] [Google Scholar]
- 15.Schick V, et al. Differential Pi3K-pathway activation in cortical tubers and focal cortical dysplasias with balloon cells. Brain Pathol. 2007;17:165–173. doi: 10.1111/j.1750-3639.2007.00059.x. [DOI] [PMC free article] [PubMed] [Google Scholar]
- 16.Miyata H, Chiang AC, Vinters HV. Insulin signaling pathways in cortical dysplasia and TSC-tubers: tissue microarray analysis. Ann Neurol. 2004;56:510–519. doi: 10.1002/ana.20234. [DOI] [PubMed] [Google Scholar]
- 17.Crino PB, Duhaime AC, Baltuch G, White R. Differential expression of glutamate and GABA-A receptor subunit mRNA in cortical dysplasia. Neurology. 2001;56:906–913. doi: 10.1212/wnl.56.7.906. [DOI] [PubMed] [Google Scholar]
- 18.Ying Z, Bingaman W, Najm IM. Increased numbers of coassembled PSD-95 to NMDA-receptor subunits NR2B and NR1 in human epileptic cortical dysplasia. Epilepsia. 2004;45:314–321. doi: 10.1111/j.0013-9580.2004.37703.x. [DOI] [PubMed] [Google Scholar]
- 19.Finardi A, et al. NMDA receptor composition differs among anatomically diverse malformations of cortical development. J Neuropathol Exp Neurol. 2006;65:883–893. doi: 10.1097/01.jnen.0000235117.67558.6d. [DOI] [PubMed] [Google Scholar]
- 20.Beleza P. Refractory epilepsy: a clinically oriented review. Eur Neurol. 2009;62:65–71. doi: 10.1159/000222775. [DOI] [PubMed] [Google Scholar]
- 21.Picton AJ, Fisher JL. Effect of the alpha subunit subtype on the macroscopic kinetic properties of recombinant GABA(A) receptors. Brain Res. 2007;1165:40–49. doi: 10.1016/j.brainres.2007.06.050. [DOI] [PMC free article] [PubMed] [Google Scholar]
- 22.Korpi ER, Grunder G, Luddens H. Drug interactions at GABA(A) receptors. Prog Neurobiol. 2002;67:113–159. doi: 10.1016/s0301-0082(02)00013-8. [DOI] [PubMed] [Google Scholar]
- 23.Brooks-Kayal AR, Pritchett DB. Developmental changes in human gamma-aminobutyric acidA receptor subunit composition. Annals of neurology. 1993;34:687–693. doi: 10.1002/ana.410340511. [DOI] [PubMed] [Google Scholar]
- 24.Rivera C, et al. The K+/Cl− co-transporter KCC2 renders GABA hyperpolarizing during neuronal maturation. Nature. 1999;397(6716):251–255. doi: 10.1038/16697. [DOI] [PubMed] [Google Scholar]
- 25.Ben Ari Y. Excitatory actions of gaba during development: the nature of the nurture. Nat Rev Neurosci. 2002;3:728–739. doi: 10.1038/nrn920. [DOI] [PubMed] [Google Scholar]
- 26.Dzhala VI, et al. NKCC1 transporter facilitates seizures in the developing brain. Nat Med. 2005;11:1205–1213. doi: 10.1038/nm1301. [DOI] [PubMed] [Google Scholar]
- 27.Sankar R, Painter MJ. Neonatal seizures: after all these years we still love what doesn’t work. Neurology. 2005;64:776–777. doi: 10.1212/01.WNL.0000157320.78071.6D. [DOI] [PubMed] [Google Scholar]
- 28.Dzhala VI, Brumback AC, Staley KJ. Bumetanide enhances phenobarbital efficacy in a neonatal seizure model. Ann Neurol. 2008;63:222–235. doi: 10.1002/ana.21229. [DOI] [PubMed] [Google Scholar]
- 29.Kahle KT, Barnett SM, Sassower KC, Staley KJ. Decreased seizure activity in a human neonate treated with bumetanide, an inhibitor of the Na(+)-K(+)-2Cl(−) cotransporter NKCC1. J Child Neurol. 2009;24:572–576. doi: 10.1177/0883073809333526. [DOI] [PubMed] [Google Scholar]
- 30.Cepeda C, et al. Epileptogenesis in pediatric cortical dysplasia: the dysmature cerebral developmental hypothesis. Epilepsy Behav. 2006;9:219–235. doi: 10.1016/j.yebeh.2006.05.012. [DOI] [PubMed] [Google Scholar]
- 31.Payne JA, Stevenson TJ, Donaldson LF. Molecular characterization of a putative K-Cl cotransporter in rat brain. A neuronal-specific isoform. J Biol Chem. 1996;271:16245–16252. doi: 10.1074/jbc.271.27.16245. [DOI] [PubMed] [Google Scholar]
- 32.Balakrishnan V, et al. Expression and function of chloride transporters during development of inhibitory neurotransmission in the auditory brainstem. The Journal of neuroscience: the official journal of the Society for Neuroscience. 2003;23:4134–4145. doi: 10.1523/JNEUROSCI.23-10-04134.2003. [DOI] [PMC free article] [PubMed] [Google Scholar]
- 33.Aguado F, et al. BDNF regulates spontaneous correlated activity at early developmental stages by increasing synaptogenesis and expression of the K+/Cl− co-transporter KCC2. Development. 2003;130:1267–1280. doi: 10.1242/dev.00351. [DOI] [PubMed] [Google Scholar]
- 34.Abidin I, et al. Reduced presynaptic efficiency of excitatory synaptic transmission impairs LTP in the visual cortex of BDNF-heterozygous mice. Eur J Neurosci. 2006;24:3519–3531. doi: 10.1111/j.1460-9568.2006.05242.x. [DOI] [PubMed] [Google Scholar]
- 35.Webster MJ, Herman MM, Kleinman JE, Shannon Weickert C. BDNF and trkB mRNA expression in the hippocampus and temporal cortex during the human lifespan. Gene Expr Patterns. 2006;6:941–951. doi: 10.1016/j.modgep.2006.03.009. S1567-133X(06)00070-6 [pii] [DOI] [PubMed] [Google Scholar]
- 36.Andre VM, et al. Interneurons, GABAA currents, and subunit composition of the GABAA receptor in type I and type II cortical dysplasia. Epilepsia. 2010;51(Suppl 3):166–170. doi: 10.1111/j.1528-1167.2010.02634.x. [DOI] [PMC free article] [PubMed] [Google Scholar]
- 37.Cepeda C, et al. Immature neurons and GABA networks may contribute to epileptogenesis in pediatric cortical dysplasia. Epilepsia. 2007;48(Suppl 5):79–85. doi: 10.1111/j.1528-1167.2007.01293.x. [DOI] [PubMed] [Google Scholar]
- 38.Andre VM, et al. Pyramidal cell responses to gamma-aminobutyric acid differ in type I and type II cortical dysplasia. J Neurosci Res. 2008;86:3151–3162. doi: 10.1002/jnr.21752. [DOI] [PubMed] [Google Scholar]
- 39.Lerner JT, et al. Assessment and surgical outcomes for mild type I and severe type II cortical dysplasia: a critical review and the UCLA experience. Epilepsia. 2009;50:1310–1335. doi: 10.1111/j.1528-1167.2008.01998.x. [DOI] [PubMed] [Google Scholar]
- 40.Brooks-Kayal AR, Shumate MD, Jin H, Rikhter TY, Coulter DA. Selective changes in single cell GABA(A) receptor subunit expression and function in temporal lobe epilepsy. Nat Med. 1998;4:1166–1172. doi: 10.1038/2661. [DOI] [PubMed] [Google Scholar]
- 41.Raol YH, et al. Enhancing GABA(A) receptor alpha 1 subunit levels in hippocampal dentate gyrus inhibits epilepsy development in an animal model of temporal lobe epilepsy. J Neurosci. 2006;26:11342–11346. doi: 10.1523/JNEUROSCI.3329-06.2006. [DOI] [PMC free article] [PubMed] [Google Scholar]
- 42.Aronica E, et al. Differential expression patterns of chloride transporters, Na+-K+-2Cl−-cotransporter and K+-Cl−-cotransporter, in epilepsy-associated malformations of cortical development. Neuroscience. 2007;145:185–196. doi: 10.1016/j.neuroscience.2006.11.041. S0306-4522(06)01637-X [pii] [DOI] [PubMed] [Google Scholar]
- 43.Munakata M, et al. Altered distribution of KCC2 in cortical dysplasia in patients with intractable epilepsy. Epilepsia. 2007;48:837–844. doi: 10.1111/j.1528-1167.2006.00954.x. [DOI] [PubMed] [Google Scholar]
- 44.Sen A, et al. Increased NKCC1 expression in refractory human epilepsy. Epilepsy Res. 2007;74:220–227. doi: 10.1016/j.eplepsyres.2007.01.004. [DOI] [PubMed] [Google Scholar]
- 45.Shimizu-Okabe C, et al. KCC2 was downregulated in small neurons localized in epileptogenic human focal cortical dysplasia. Epilepsy Res. 2011;93:177–184. doi: 10.1016/j.eplepsyres.2010.12.008. [DOI] [PubMed] [Google Scholar]
- 46.Galanopoulou AS. Developmental patterns in the regulation of chloride homeostasis and GABA(A) receptor signaling by seizures. Epilepsia. 2007;48(Suppl 5):14–18. doi: 10.1111/j.1528-1167.2007.01284.x. [DOI] [PubMed] [Google Scholar]
- 47.Lee HH, et al. Direct protein kinase C-dependent phosphorylation regulates the cell surface stability and activity of the potassium chloride cotransporter KCC2. J Biol Chem. 2007;282:29777–29784. doi: 10.1074/jbc.M705053200. [DOI] [PubMed] [Google Scholar]
- 48.Huang J, Wu S, Wu CL, Manning BD. Signaling events downstream of mammalian target of rapamycin complex 2 are attenuated in cells and tumors deficient for the tuberous sclerosis complex tumor suppressors. Cancer Res. 2009;69:6107–6114. doi: 10.1158/0008-5472.CAN-09-0975. [DOI] [PMC free article] [PubMed] [Google Scholar]
- 49.Palma E, et al. Anomalous levels of Cl− transporters in the hippocampal subiculum from temporal lobe epilepsy patients make GABA excitatory. Proc Natl Acad Sci U S A. 2006;103:8465–8468. doi: 10.1073/pnas.0602979103. 0602979103 [pii] [DOI] [PMC free article] [PubMed] [Google Scholar]
- 50.Pathak HR, et al. Disrupted dentate granule cell chloride regulation enhances synaptic excitability during development of temporal lobe epilepsy. The Journal of neuroscience: the official journal of the Society for Neuroscience. 2007;27:14012–14022. doi: 10.1523/JNEUROSCI.4390-07.2007. [DOI] [PMC free article] [PubMed] [Google Scholar]
- 51.Hubner CA, et al. Disruption of KCC2 reveals an essential role of K-Cl cotransport already in early synaptic inhibition. Neuron. 2001;30:515–524. doi: 10.1016/s0896-6273(01)00297-5. [DOI] [PubMed] [Google Scholar]
- 52.Woo NS, et al. Hyperexcitability and epilepsy associated with disruption of the mouse neuronal-specific K-Cl cotransporter gene. Hippocampus. 2002;12:258–268. doi: 10.1002/hipo.10014. [DOI] [PubMed] [Google Scholar]
- 53.Jarolimek W, Lewen A, Misgeld U. A furosemide-sensitive K+-Cl− cotransporter counteracts intracellular Cl− accumulation and depletion in cultured rat midbrain neurons. The Journal of neuroscience: the official journal of the Society for Neuroscience. 1999;19:4695–4704. doi: 10.1523/JNEUROSCI.19-12-04695.1999. [DOI] [PMC free article] [PubMed] [Google Scholar]
- 54.Cepeda C, et al. Epileptogenesis in pediatric cortical dysplasia: the dysmature cerebral developmental hypothesis. Epilepsy Behav. 2006;9:219–235. doi: 10.1016/j.yebeh.2006.05.012. [DOI] [PubMed] [Google Scholar]
- 55.Bragin DE, Sanderson JL, Peterson S, Connor JA, Muller WS. Development of epileptiform excitability in the deep entorhinal cortex after status epilepticus. Eur J Neurosci. 2009;30:611–624. doi: 10.1111/j.1460-9568.2009.06863.x. [DOI] [PMC free article] [PubMed] [Google Scholar]
- 56.Loturco JJ, Owens DF, Heath MJ, Davis MB, Kriegstein AR. GABA and glutamate depolarize cortical progenitor cells and inhibit DNA synthesis. Neuron. 1995;15:1287–1298. doi: 10.1016/0896-6273(95)90008-x. [DOI] [PubMed] [Google Scholar]
- 57.Cancedda L, Fiumelli H, Chen K, Poo MM. Excitatory GABA action is essential for morphological maturation of cortical neurons in vivo. The Journal of neuroscience: the official journal of the Society for Neuroscience. 2007;27:5224–5235. doi: 10.1523/JNEUROSCI.5169-06.2007. [DOI] [PMC free article] [PubMed] [Google Scholar]
- 58.Wang DD, Kriegstein AR. Blocking early GABA depolarization with bumetanide results in permanent alterations in cortical circuits and sensorimotor gating deficits. Cereb Cortex. 2011;21:574–587. doi: 10.1093/cercor/bhq124. [DOI] [PMC free article] [PubMed] [Google Scholar]
- 59.Chudotvorova I, et al. Early expression of KCC2 in rat hippocampal cultures augments expression of functional GABA synapses. J Physiol. 2005;566:671–679. doi: 10.1113/jphysiol.2005.089821. [DOI] [PMC free article] [PubMed] [Google Scholar]
Associated Data
This section collects any data citations, data availability statements, or supplementary materials included in this article.
Supplementary Materials
A–B. Typical macroscopic appearance of dysplastic and nondysplastic brain tissue. The small arrows indicate the sharp contrast between tuberal and non-tuberal portions of the specimen, while the arrowheads show the approximate location of dissected tissue. C. Western blot quantification of whole cell homogenates demonstrates a significant increase in pS6 expression levels in cortical tubers, but levels comparable to control in the non-tuberal cortex. Histograms are averaged optical density normalized to actin, and expressed relative to the mean control values. Insets are the representative western blots for individual proteins. *: p < 0.05. Error bars indicate S.E.M.
A–C. Double-label immunocytochemistry for non-phosphorylated neurofilament SMI 311 and pS6 demonstrates hyperactivation of mTORC1 signaling in tuber dysplastic neurons (small arrows) and dysplastic astrocytes (arrowheads). D–F. Vimentin positive giant cells express high pS6 levels. G–I. NeuN-expressing normal-seized neurons within cortical tubers express low levels of pS6 (small arrow), in contrast to high pS6 expression in dysplastic astroglia (arrowheads). J–L. Reactive astrocytes labeled with GFAP express low/no pS6 (small arrow), while giant cells (arrowheads) are highly pS6 positive. Scale bars represent 20μm in all panels.