
Figure 1.
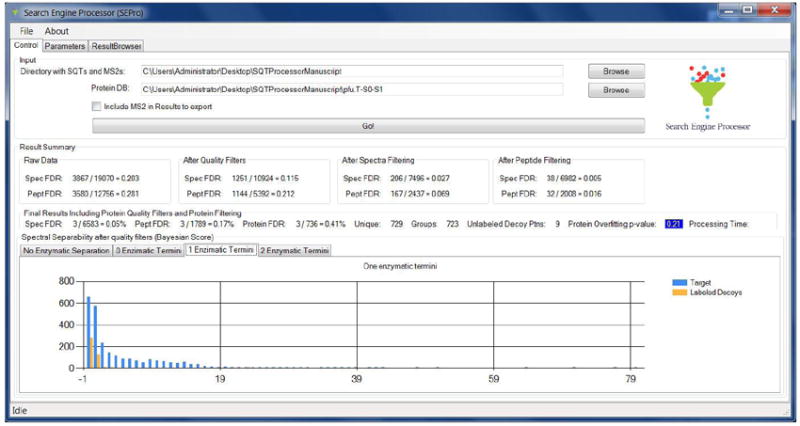
SEPro’s GUI contains three main tabs: Control, Parameters, and Results Browser. The Control tab is shown here and displays a summary of the FDR values after each filtration step. Spec FDR and Pept FDR stand for spectral and peptide FDR, respectively. The histogram at the bottom shows the distribution of BayesS for semi-tryptic peptides. The protein overfitting p-value is highlighted in blue, indicating that the solution is acceptable and thus no further post-processing filters need to be applied.